-- Published: Thursday, 6 September 2018 | Print | Disqus
By Avi Gilburt
As I have mentioned in prior articles, Elliott theorized that public sentiment and mass psychology move in 5 waves within a primary trend, and 3 waves within a counter-trend. Once a 5 wave move in public sentiment has completed, then it is time for the subconscious sentiment of the public to shift in the opposite direction, which is simply the natural cycle within the human psyche, and not the operative effect of some form of news.
And, in 1940, Elliott publicly tied the movements of human behavior to the natural law represented through Fibonacci mathematics. Therefore, these primary trend and counter-trend movements in the market generally adhere to standard Fibonacci extensions and retracements.
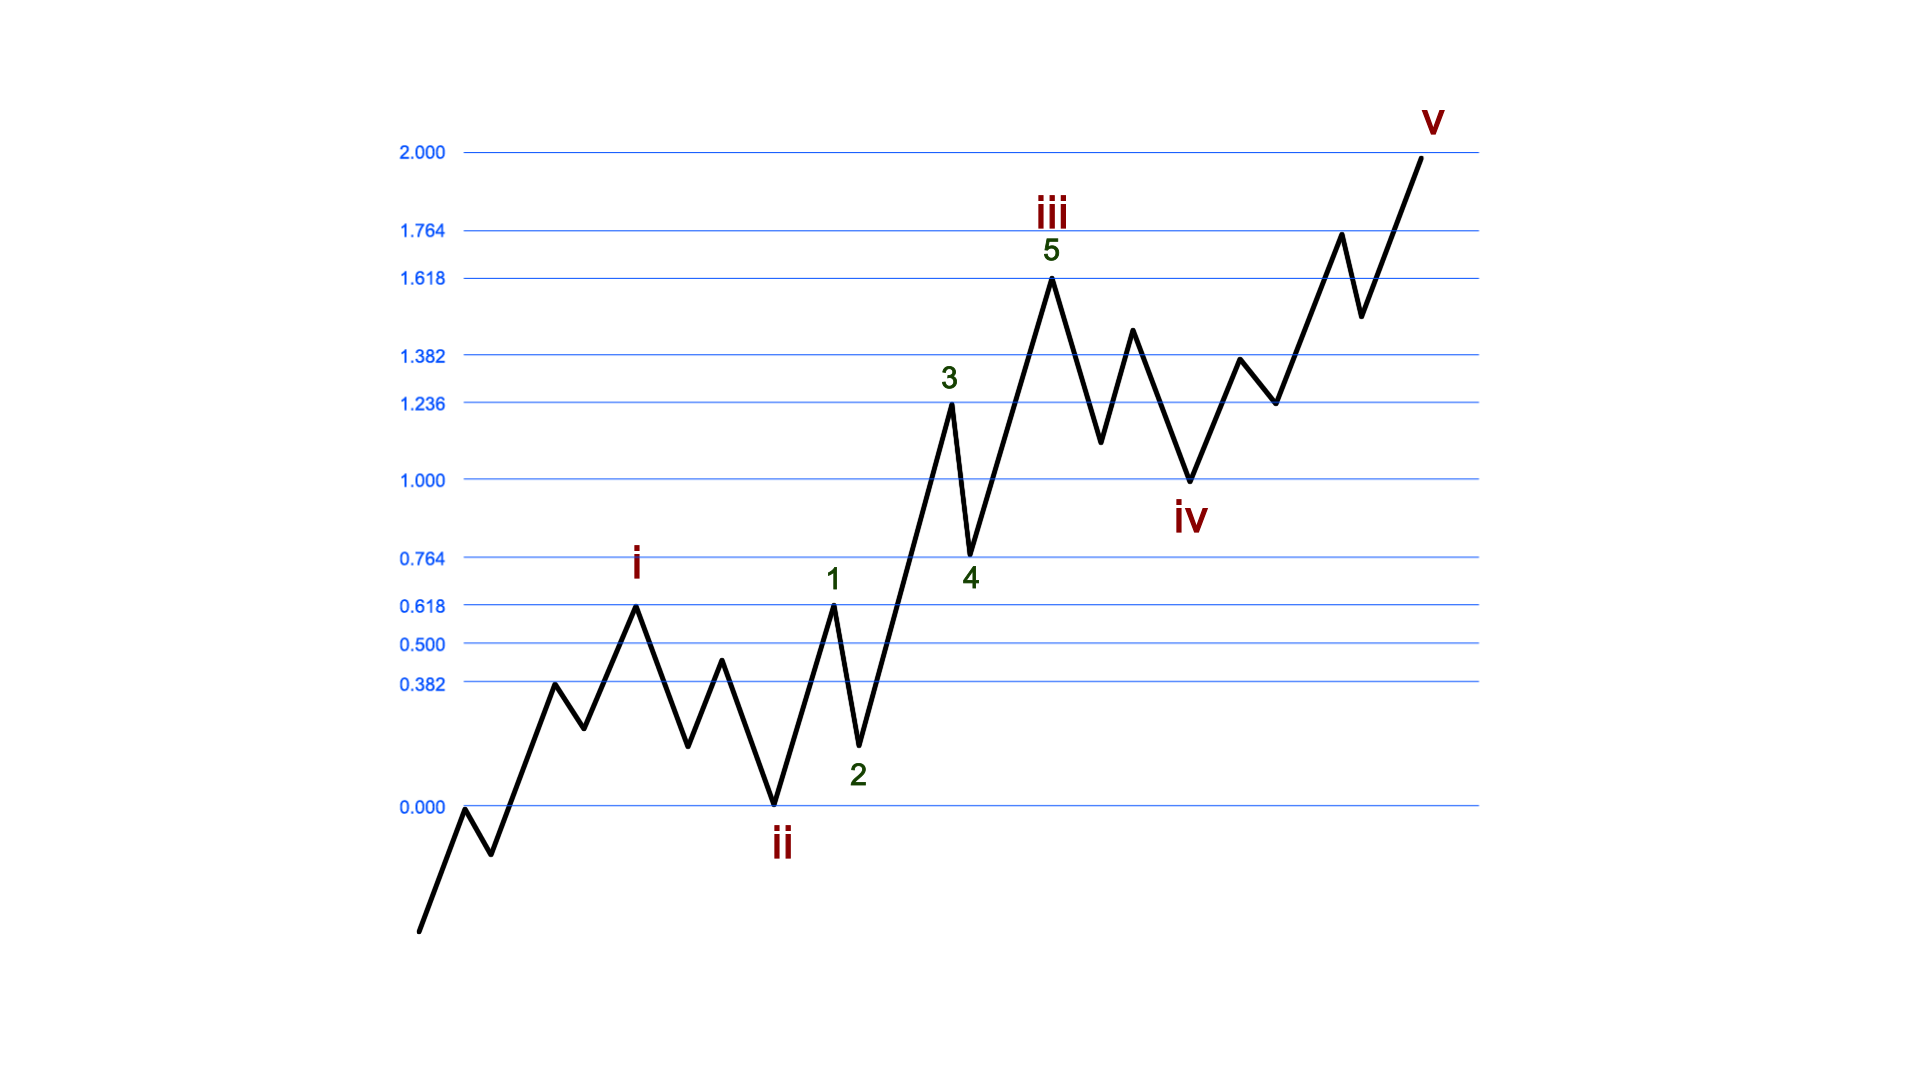
For an example of a typical 5 wave structure, please see the attachment below.
A move in the direction of the trend is considered a motive move (or, as I often refer to it as an impulsive move), and will constitute 5 waves in the primary trend direction. A counter-trend move is considered a corrective move, and constitutes 3 waves, which are counter to the primary trend direction.
Within the impulsive 5-wave move, waves 1, 3 and 5 move in the direction of the primary trend, and waves 2 and 4 will be counter-trends in the opposite direction.
Since the market is fractal in nature, it means that these movements are variably self-similar at different degrees of trend. In other words, these impulsive and corrective movements of the market are occurring at all degrees and in all time frames. That means that the smaller components, or sub-waves, have the same basic shape, form, and pattern as the larger components. So, waves 1, 3 and 5 all have to develop as 5-wave structures.
While this may have begun to sound more complex, I do want to note that the main rules of Elliott Wave analysis are really quite simple. First, wave 2 can never retrace beyond the start of wave 1. Second, wave 3 cannot be the shortest wave. In its simplest form, these are the main rules which you cannot break for a valid Elliott Wave structure. The rest of the analysis is based upon guidelines. And, yes, there are too many to list here.
For anyone who is really interested in developing a working knowledge of Elliott Wave analysis, I would first suggest you read the bible, entitled The Elliott Wave Principle, written by Frost & Prechter. After you read that book several times, I would suggest you review the detailed webinars that Garrett Patten has developed at Elliottwavetrader.
Lets now move onto the most common retracement percentages we see for a 2nd wave. While the most common retracement level is the .618 retracement of wave 1, we can also see retracements as shallow as .382, or as deep as .764. But, remember, a wave structure is not invalidated until wave 2 retraces more than 100% of wave 1. However, the sub-wave structure of that retracement will often provide early warning signs as to whether this will occur.
As for the Fibonacci targets for the other waves, third waves most commonly target the 1.382 or 1.618 Fibonacci extension of waves 1 and 2. Fourth waves often retrace .382 of the size of wave 3. And, fifth waves are often equal in size to the first wave. These are just some of the simple guidelines we follow when applying Elliott Wave analysis. And, next week, we will go into how we frame this standard analysis into a more objective format using Fibonacci Pinball.
As I said in my last article, Phi, when used appropriately in conjunction with Elliott Wave, can be an incredibly powerful predictive market tool. But, the internal wave structure within an Elliott Wave analysis must display relationships based upon Phi in order to be able to appropriately predict the next move within a market with any form of accuracy. In fact, after you identify the appropriate Elliott Wave pattern within a market, you are often able to then identify the next move of the market with shocking accuracy based upon a Phi-based target.
However, one of the practices which causes people to feel that Elliott Wave analysis just does not work is that they engage in something I refer to as wave slapping. So, I want to take a moment to provide a warning to all of you who will now open your charts, and try to find a 5 wave move. You see, many will take their rudimentary understanding of Elliott Wave and just count how many waves they see going up or down, and then place their labels for the Elliott Wave structure based upon that look. I want to be very clear: THIS IS NOT ELLIOTT WAVE ANALYSIS. Yet, this is likely the most common use I have seen of Elliotts 5-wave model.
Remember what we noted at the start of this exercise:
Since the market is fractal in nature, it means that these movements are variably self-similar at different degrees of trend. In other words, these impulsive and corrective movements of the market are occurring at all degrees and in all time frames. That means that the smaller components, or sub-waves, have the same basic shape, form, and pattern as the larger components.
So, if your intention is to come up with an accurate Elliott Wave analysis, you will need to accurately count all the sub-waves within the structures you are labeling to make sure they adhere to the appropriate Elliott Wave structures. This takes a lot of detailed work. Without this detailed work, the chances that you will be accurate in your assessment of market direction will be reduced to the point of guessing. And that is why wave slappers give Elliott Wave a bad name, as they provide nothing more than guesswork. Moreover, when their expectations are not met, they throw their hands up in the air, and claim that Elliott Wave simply does not work.
Even those analysts who attempt to apply Fibonacci ratios to their wave counts can also find themselves classified as wave slappers. I have seen too many wave counts that are akin to scratching your right ear with your left hand by going over the top of your head. In other words, too many of these analysts are simply attempting to fit their Elliott Wave count to a fundamental perspective they maintain. So, their analysis is not based upon an objective reading of what the market is presenting before them. Rather, they are forcing a wave count to fit their fundamental perspective. This is another reason many analysts give Elliott Wave a bad name, and even some very famous practitioners have been quite guilty of this error.
Also, I do not want you to assume that once you master Elliott Wave analysis, you will be able to determine every market movement the market provides. Elliott Wave analysis deals in probabilities within a non-linear environment. That means that there are certainly times we will not be able to accurately identify the next move in the market. In fact, those that follow us have noted that we are right about 70% of the time. That means we will inevitably be wrong 30% of the time. But, one of the main strengths of Elliott Wave analysis (if you utilize our Fibonacci Pinball method) is it provides an objective perspective to know when your wave count is wrong early enough so that you can stop out of a wrong position, and then align your positioning with the appropriate trend.
Lastly, while many of you have derided me through the years for not taking into account fundamentals in my analysis, I hope you can now understand that my purpose is to be able to approach the market without a bias having been formed. For those that have bought into a story with regard to how markets should move, such as most of the market who have been bearish and not believing the stock market can continue to rally over these last several years, believing in the common bearish stories would have you approach your analysis with a bearish bias. Yet, ignoring those fundamentals has allowed me to view the markets from an objective perspective, and has kept us on the correct side of the market for many years. This is most true at the market extremes, when everyone is so certain about the continuation of the trend, just as the trend is about to turn.
So, I hope I have offered you some insight into the basics of Elliott Wave analysis this week. Next week, I will show you how our Fibonacci Pinball method works, and why it frames the standard Elliott Wave analysis within a much more objective framework. I will also show you how we use it for entries and exits for the various stocks and indices we track.
Fib Pinball 1 236 (2)
Avi Gilburt is founder of ElliottWaveTrader.net.
| Digg This Article
-- Published: Thursday, 6 September 2018 | E-Mail | Print | Source: GoldSeek.com


