-- Published: Tuesday, 16 October 2018 | Print | Disqus
By Frank Holmes

According to the 2018 edition of the Stock Traders Almanac, October has been a great time to buy. Once ranked last in terms of stock performance, the 10th month has delivered relatively average returns since 1950. What makes it so attractive is that its followed by November and December, historically among the very best months for stocks. Were also entering the three most bullish quarters of the four-year presidential cycle, based on 120 years of stock market data.

click to enlarge
At the same time, October is sometimes known as the jinx month because an inordinate number of huge selloffs have occurred in the month, including those in 1929 and 1987. The worst month of the global financial meltdown was October 2008, when stocks gave up close to 17 percent.
There have been only six trading days in S&P 500 Index history in which stocks sold off by eight or more standard deviations, according to a report last week by Goldman Sachs. Last Wednesday was one of those six days, the fifth largest in history, following trading days in September 1955, October 1989, October 1987 and February 2007. The selloff in 1955, interestingly enough, was prompted by news that President Dwight Eisenhower had suffered a heart attack.
If youve read my whitepaper Managing Expectations, you should know that eight standard deviations (or more) represents a massive, exceedingly rare variance from the mean. Days like last Wednesday remind us of the importance of diversification into assets that have little to no correlation with stocksassets such as municipal bonds and gold.
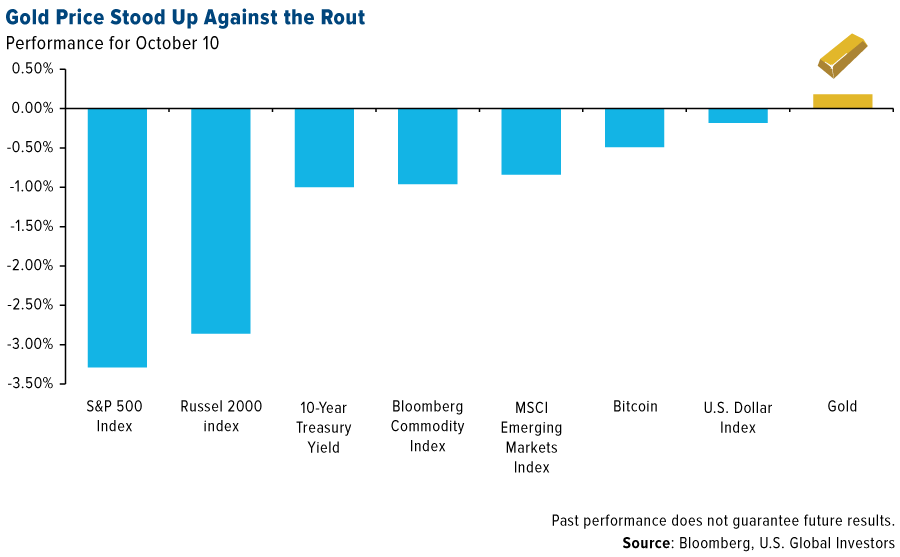
Gold Helped Investors Stanch the Losses
I was impressed with how well gold did last week. The yellow metal behaved exactly as you would expect it to, edging up slightly on safe haven demand Wednesday as stockslarge and small, domestic and foreigntumbled.

click to enlarge
On Thursday, the spread between gold and equities was even more pronounced, with gold closing almost 3 percent higher and the S&P 500 ending down more than 2 percent, below its 200-day moving average.
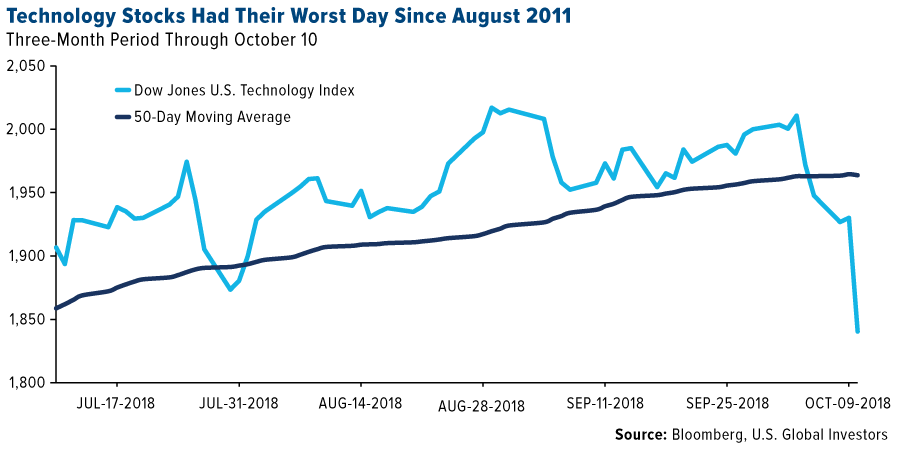
Wednesdays laggards included big-name tech firms such as Apple, Amazon and Netflix. Combined, these three companies lost nearly $120 billion in market value on that day alone.

click to enlarge
As I shared with you last month, e-commerce is the second largest equity bubble of the last four decades following housing. E-commerce is also vastly overpresented in indexes, meaning extraordinary amounts of money have flowed into a very small number of stocks by way of passive index funds that track them.
Apple alone is featured in almost 210 indexes. Consequentially, when the iPhone-makers stock plummets 4.5 percent or more, as it did last Wednesday, a huge percentage of investors are affected.
Again, this is one of the reasons why I advocate the Golden Rulea 10 percent weighting in the yellow metal, with 5 percent in bullion and gold jewelry, the other 5 percent in high-quality gold stocks, mutual funds and ETFs.
The Return of Volatility
Last week the CBOE Volatiliy Index (VIX), sometimes called the fear gauge, had its biggest one-day surge since February. But after such a tranquil third quarter, a substantial move in either direction might have been anticipated. LPL Financial Research reports that this year was the first time since 1963 that the normally volatile third quarter didnt have a single one-day jump of more than 1 percent, up or down.
Volatility is back and it may require more active strategies on the part of investors to pursue their long-term goals, LPL Financials chief investment strategist, John Lynch, said.
Higher Rates Reflective of a Strong Economy
In response to the selloff, President Donald Trump put the blame squarely at the feet of the Federal Reserve, saying its ridiculous what theyre doing and calling monetary policy too tight.
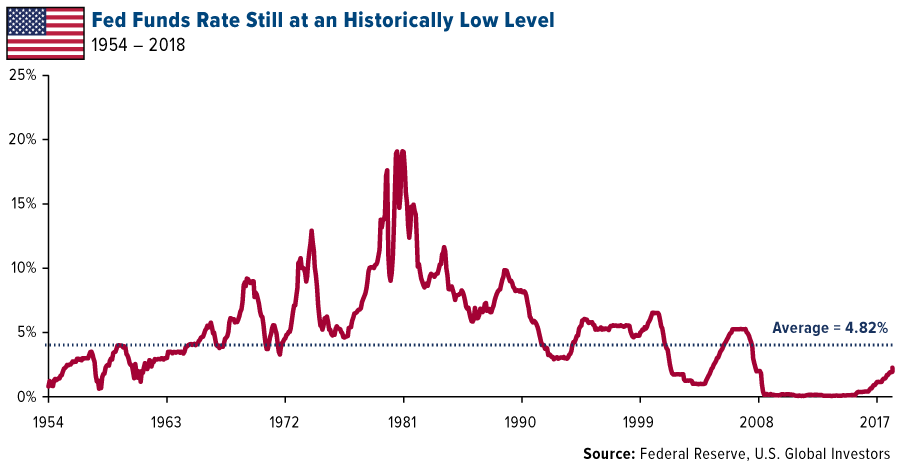
The Fed is indeed tightening, and Ive pointed out before that rate hike cycles in the past have preceded market downturns. But calling policy too tight at the moment might be a stretch. After being hiked yet again last month, the federal funds rate stands at 2.25 percent. Thats up considerably from near-zerowhich is where it remained during much of Barack Obamas two terms as presidentbut its still historically low, not yet having reached the long-term average of 4.82 percent.

click to enlarge
It must also be said that higher rates are reflective of a strong economysomething Trump has fought hard for. In the second quarter, U.S. gross domestic product (GDP) grew 4.2 percent, its fastest pace since 2014, and the Atlanta Fed is now forecasting the same for the third quarter. Unemployment is currently at a multi-decade low, wage growth hit a nine-year high of 2.9 percent in August and median household income in 2017 climbed to $61,372, the most on record. U.S. consumer confidence, as measured by the Conference Board, reached an 18-year high in September.
The private sector is also seeing healthy expansion. S&P 500 companies are expected to report earnings growth above 20 percent for the third straight quarter, according to FactSet. Stocks rebounded Friday morning after a number of companies reported earnings that surprised to the upside. Delta Air Lines, for example, beat expectations, with net income in the third quarter coming in at $1.31 billion, or $1.91 a share, up from $1.16 billion, or $1.61 a share, in the same three months last year.
Although stocks appear to be stabilizing somewhat, I think the two-day selloff last week should be enough to convince investors to make sure they have a 10 percent weighting in gold and gold stocks, with allocations to municipal bonds and ultrashort government bonds.
Find out why so many investors are flocking to U.S. Treasuries. Watch the video by clicking here!
The S&P 500 is a stock market index that tracks the stocks of 500 large-cap U.S. companies. The Russell 2000 Index is a small-cap stock market index of the bottom 2,000 stocks in the Russell 3000 Index. The Bloomberg Commodity Index (BCOM) is a highly liquid and diversified benchmark for commodity investments. The MSCI Emerging Markets Index captures large and mid-cap representation across 24 Emerging Markets (EM) countries. The U.S. Dollar Index is an index of the value of the United States dollar relative to a basket of foreign currencies, often referred to as a basket of U.S. trade partners' currencies. The Dow Jones U.S. Technology Index measures the performance of the technology sector of the U.S. equity market. The CBOE Volatility Index, known by its ticker symbol lVIX, is a popular measure of the stock market's expectation of volatility implied by S&P 500 index options, calculated and published by the Chicago Board Options Exchange (CBOE). The Consumer Confidence Index (CCI) Survey is an index by The Conference Board that measures how optimistic or pessimistic consumers are with respect to the economy in the near future.
Standard deviation is a measure of the dispersion of a set of data from its mean. The more spread apart the data, the higher the deviation. Standard deviation is also known as historical volatility.
Diversification does not protect an investor from market risks and does not assure a profit.
Fund portfolios are actively managed, and holdings may change daily. Holdings are reported as of the most recent quarter-end. The following securities mentioned in the article were held by one or more of U.S. Global Investors Funds as of 9/30/2018: Delta Air Lines Inc.
All opinions expressed and data provided are subject to change without notice. Some of these opinions may not be appropriate to every investor.
| Digg This Article
-- Published: Tuesday, 16 October 2018 | E-Mail | Print | Source: GoldSeek.com