Inflation is a funny thing: we feel it virtually every day, but we’re told it doesn’t exist—the official inflation rate is around 2.5% over the past few years, a little higher when energy prices are going up and a little lower when energy prices are going down.
Historically, 2.5% is about as low as inflation gets in a mass-consumption economy like the U.S. that depends on the constant expansion of credit.
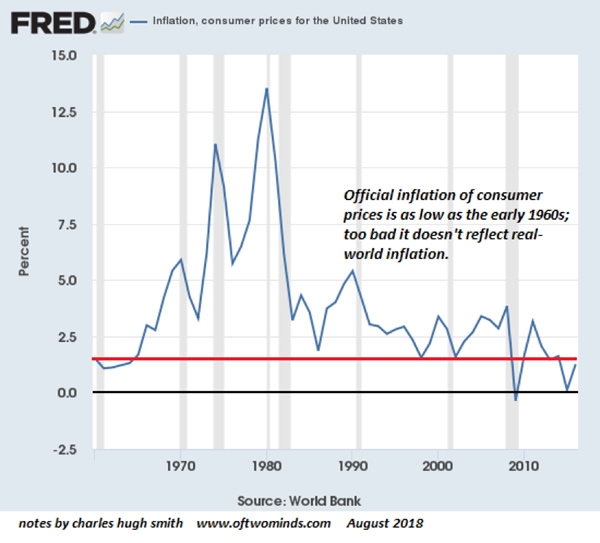
But even 2.5% annually can add up if wages are stagnant. According to the Bureau of Labor Statistics (BLS), what cost $1 in January 2009 now costs $1.19. https://www.bls.gov/data/inflation_calculator.htm
That 19% decline in the purchasing power of dollars is tolerable as long as wages go up by 20% over the same period, but for many American households, wages haven’t kept pace with official inflation.
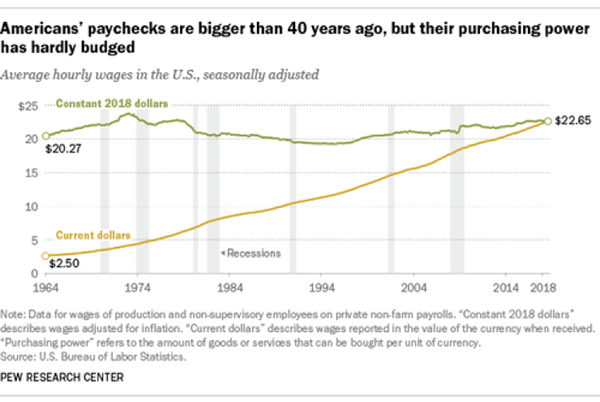
While the nominal hourly wages keep rising, adjusted for inflation, wages have stagnated for decades. Here’s a chart based on BLS data that shows median weekly earnings adjusted for official inflation rose $6 a week after five years of decline:
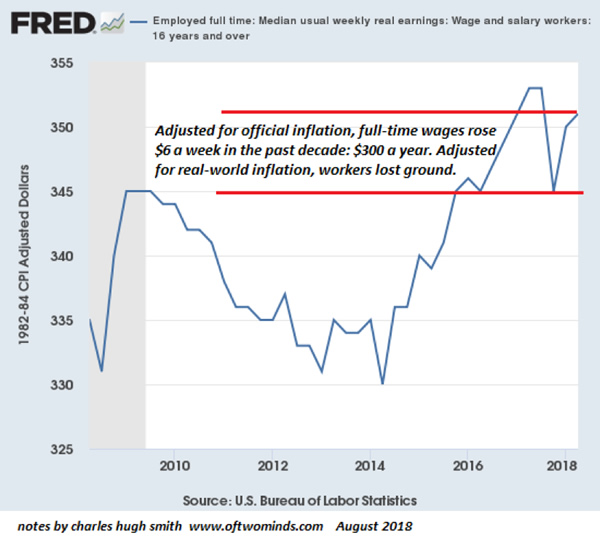
But stagnant wages are only part of the inflation picture: official inflation under-represents real-world inflation on several counts.
First, the weightings of the components in the Consumer Price Index (CPI) are suspect. Many commentators have explored this issue, but the main point is the severe underweighting of expenses such as healthcare, which is only 8.67% of the CPI but over 18% of the U.S. Gross Domestic Product (GDP).
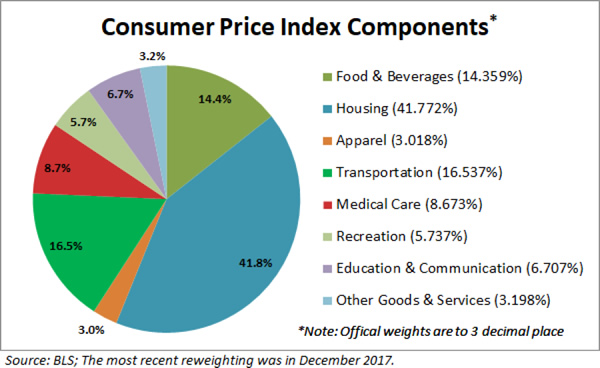
Second, the “big ticket” components—rent/housing, healthcare and higher education—are under-reported for those who have to pay the unsubsidized cost. The CPI reflects minor cost decreases in tradable commodity goods such as TVs and clothing that are small parts of the family budget, while minimizing enormous expenses such as college tuition and healthcare that can cost $20,000 annually or more.
Third, by lumping the entire nation into one basket, the CPI ignores the reality that the inflation rate experienced by the protected class whose big-ticket expenses are subsidized by the government or employers is far lower than the rate experienced by the unprotected class that pays full freight. While the protected class complains about healthcare visit co-pays rising from $20 to $40, the unprotected class is getting hit with monthly increases of hundreds of dollars or co-pays in the thousands of dollars.
Fourth, there are significant regional differences which the CPI doesn’t reflect: inflation in coastal areas is running white-hot compared to lower-cost regions.
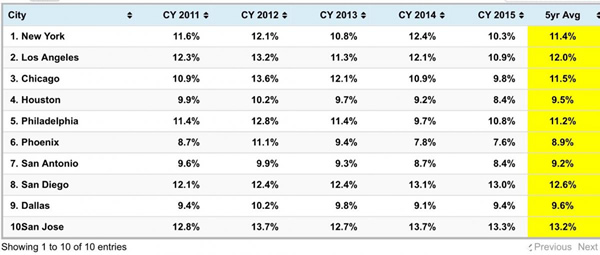
The Chapwood Index attempts to measure apples-to-apples real-world expenses, and as you can see, the Index estimates real inflation is above 10% for many American households.
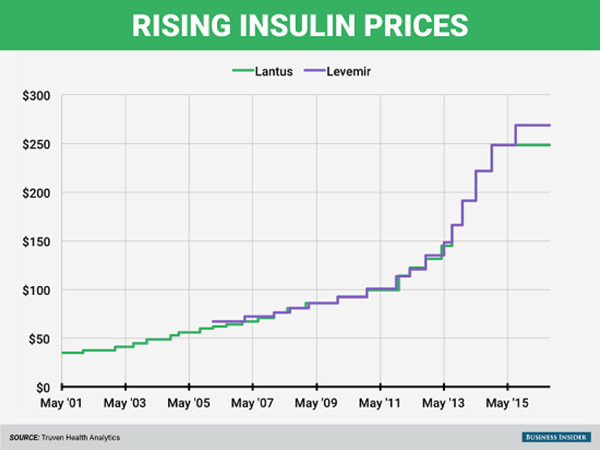
It’s hard to believe 2.5% inflation includes the soaring costs of goods such as insulin:
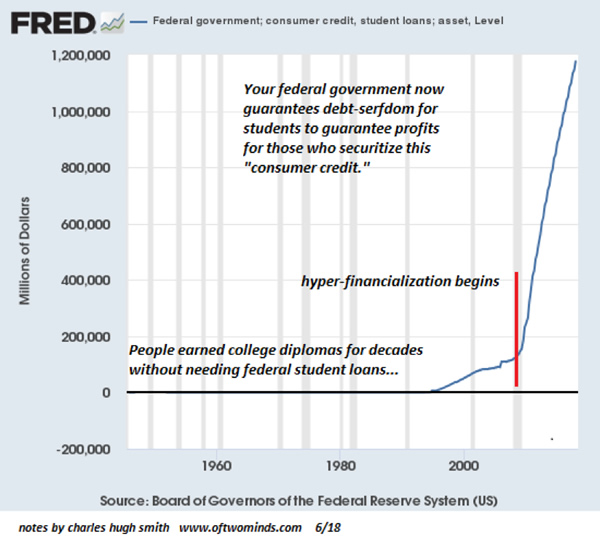
Or student loan payments:
Then there’s the mystery of how the Federal Reserve can create trillions of dollars of new currency and governments and banks can issue trillions of dollars in newly borrowed money—private, corporate and sovereign—can flood into the economy without generating higher official inflation.
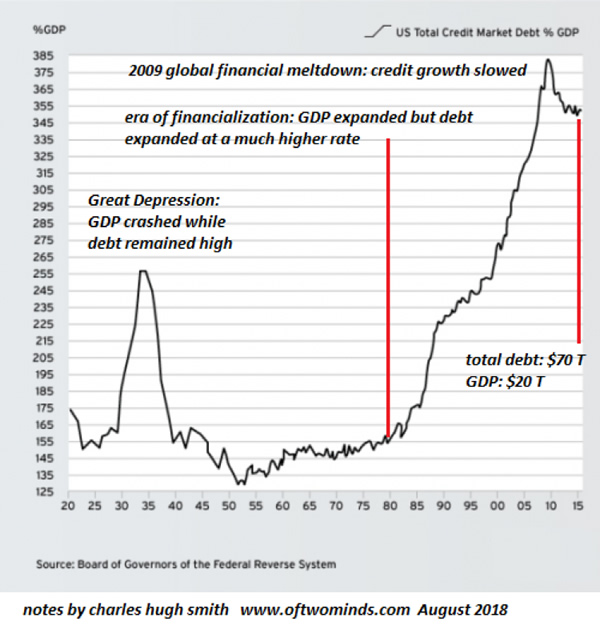
Here’s a chart of all credit outstanding in the U.S.: $70 trillion, up $40 trillion since 2000 and up $15 trillion since 2009:
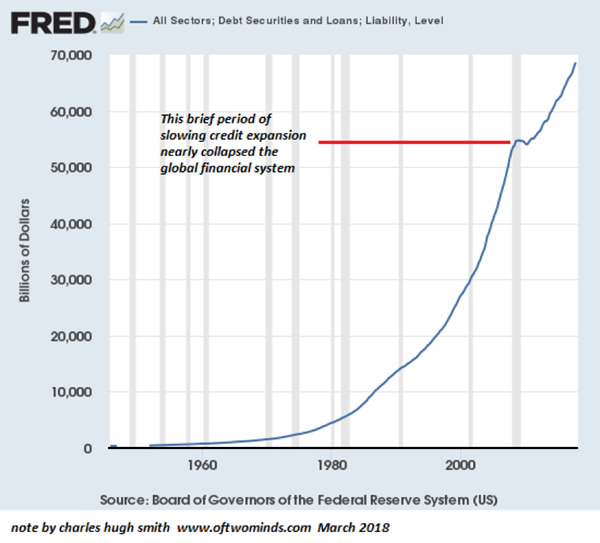
The answer of course is most of that new money has flowed into assets, pushing the valuations of assets such as stocks, high-yield (junk) bonds and real estate to the moon.
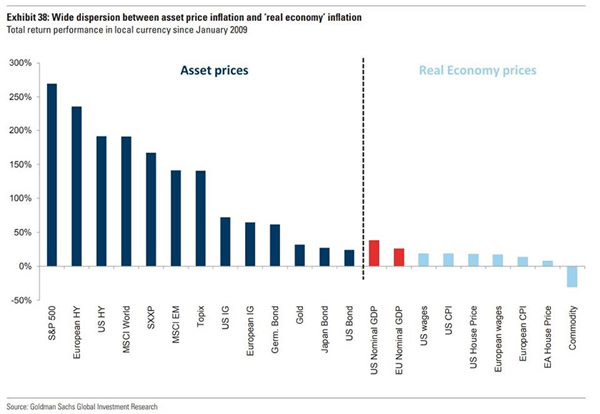
This vast inflation of asset prices has pushed household net worth to the moon, too, but...

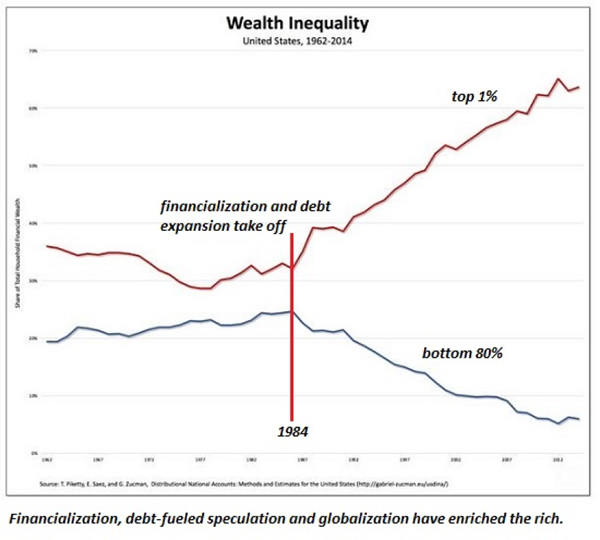
..the problem is, the wealth isn’t distributed very evenly. The gains have flowed mostly to the top .1% and to a lesser degree to the top 5%:
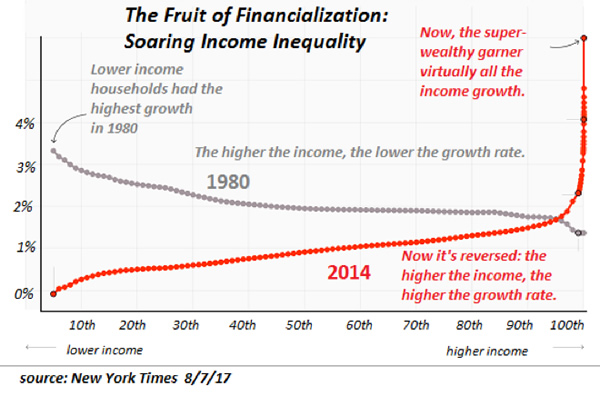
Unsurprisingly, this asset inflation has greatly enriched those who were already rich, i.e. the owners of the assets which have soared in value.
The fly in the ointment is the real economy hasn’t expanded at the same rate as debt; the ratio of debt to GDP now far exceeds the extremes of the Roaring 20s that set up the collapse of both debt and the asset prices that depended on new debt to fuel demand for overpriced assets.
The enormous expansion of debt and the resulting asset inflation are global phenomena:
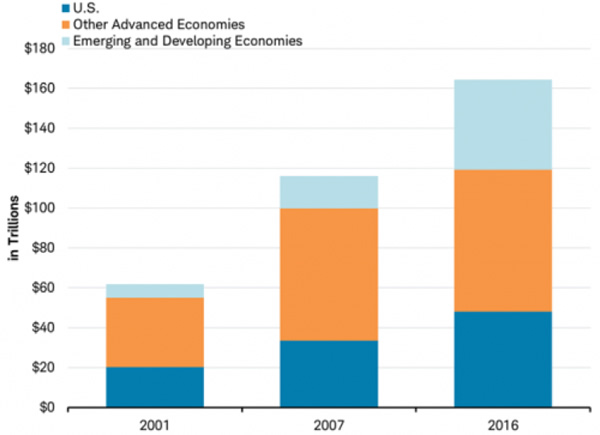
Three secular trends have driven asset inflation and moderate deflation of commoditized goods and services:
- Globalization, a.k.a. global capital moving around the globe, reaping the gains of labor, credit, environmental and tax arbitrage: move from high-cost, high-tax, environmentally regulated locales to low-tax, low-labor costs and environmentally lax locales and skim all the profits.
- Declining interest rates. Increasing production overseas and stock buybacks have been encouraged by central banks’ maintaining super-low interest rates and easy lending liquidity. Both have pushed corporate profits much higher.
- Financialization, i.e. low interest rates, ample liquidity, expanding leverage, the commoditization of previously low-risk financial instruments such as home mortgages, expansion of credit-default swaps and other derivatives and the generalized belief that risk can be eliminated by counterparty contracts.

All three of these secular trends are reversing: globalization is under assault on multiple fronts, as people are starting to question globalization’s role in increasing inequality, environment damage and the hollowing out of domestic economies and the middle class.
A decade of financial repression to keep interest rates near zero is slowly being “normalized” by central banks, enabling rates to rise. As the overhang of bad debt and the rising risk of defaults start being priced into the bond and debt markets, the pressure on rates will only increase as higher risks demand higher compensation via higher yields.
Furthermore, all the trillions in existing debt will be rolled over at much higher rates going forward, squeezing the revenues of all borrowers, governments, corporations and households alike.
Financialization is following an S-Curve of diminishing returns: all the speculative games that have boosted assets to the moon are running out of steam or faltering.
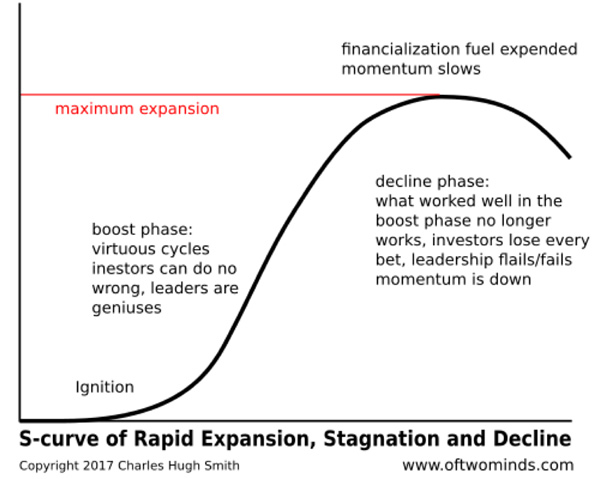
This is visible in the divergence of GDP (the real-world economy) and household net worth (speculative debt-fueled asset bubbles) mentioned above:

So what happens to inflation as the trends that kept real-world inflation officially low and boosted asset inflation to unprecedented heights all reverse?
The obvious conclusion is asset valuations re-correlate to the trend line of the real-world economy, which is another way saying they drop a lot in a global repricing of risk and the impact of secularly rising interest rates.
That will put the kibosh on the much-vaunted wealth effect that supposedly boosted the animal spirits of borrowing and spending (and speculating) that has fueled the “recovery” of the past decade.
As the global economy spirals into recession, central banks will panic (as usual) and attempt to spark flagging consumption by lowering interest rates and governments will increase deficit spending (i.e. government borrowing) to boost household incomes and corporate revenues.
But unlike last time, these policies may not reflate asset bubbles that have popped, or suppress real-world inflation. Rather, they may fail to boost asset inflation and succeed in boosting real-world inflation while wages continue stagnating and household net worth craters.
Simply put, the world has changed, and the unintended consequences of the past decade’s policies cannot be stuffed back in the bottle. The easy years of watching index funds and other assets rise like clockwork because central banks willed it are over.
In Part 2: Get Ready For "QE For The People" we detail the likeliest next steps in this story in which, under the guise of "progressive fairness", the next phase of money printing will transmit free money directly into the populace's pockets.
What's not to like about that? Well, for starters, it won't create any true prosperity, it will send cost inflation skyrocketing, and it will further subjugate the populace to the cartels running our economy and political system. But the masses will cheer for it anyways. So get ready.
Click here to read Part 2 of this report (free executive summary, enrollment required for full access

