 By Photo:flickr/Joe Loong | Creative Commons Attribution 2.0 Generic |
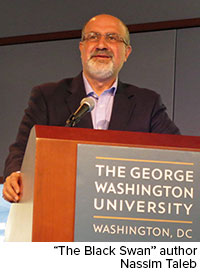
The world is more fragile today than it was in 2007. That’s the opinion of former derivatives trader Nassim Taleb, whose bestseller, The Black Swan, is about how people make sense of unexpected events, especially in financial markets. True to form, he made a whole lot of money after predicting the global financial crisis more than a decade ago.
Speaking with Bloomberg’s Erik Schatzker last week, Taleb said the reason why he has reservations about today’s economy is that it suffers from the “same disease” as before. The meltdown in 2007 was a “crisis of debt,” and if anything, the problem has only worsened.
Indeed, debt is on the rise. By the end of the first quarter, the total amount the world owes climbed to a record $247 trillion, according to the Institute of International Finance (IIF). That’s up almost $150 trillion over the past 15 years.
A lot of this debt, Taleb said, may have moved to different places since the financial crisis—it’s shifted from housing to governments and corporate balance sheets—but the debt “is still there.” Student loan debt in the U.S., for example, stands at about $1.5 trillion today, or nearly $33,000 per borrower. After mortgages, student debt is now the largest form of debt in the U.S.
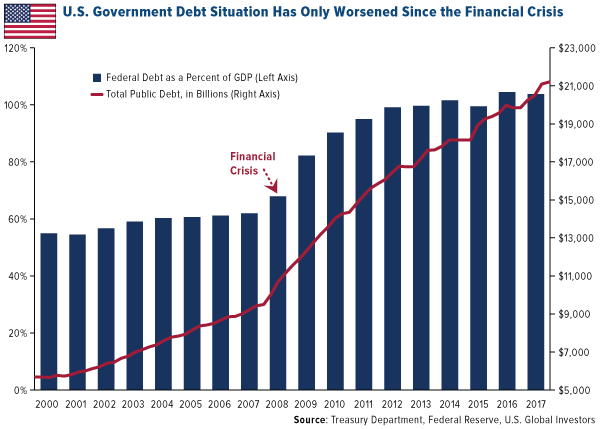
Just look at the federal government’s balance sheet. Gross debt has more than doubled from pre-recession levels, meaning Washington now owes slightly more than the entire size of the U.S. economy.
Higher Debt Levels Pose an “Economic Threat”
President Donald Trump said last week that “we’re going to start paying down debt.” But all the signs appear to say otherwise. The Treasury Department estimates that it will issue some $1.338 trillion in debt this year—more than twice the amount as last year. And the Office of Management and Budget (OMB) recently reported that the government is set to run trillion-dollar deficits for the next four years, despite a roaring economy.
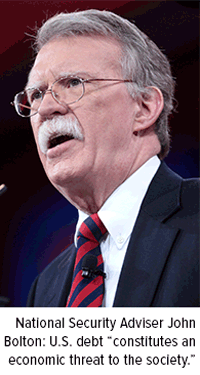 Photo: Gage Skidmore | Creative Commons Attribution-Share Alike 3.0 Unported license |
According to Taleb, the U.S. government is now in a “debt spiral,” meaning it must borrow to repay its creditors. And with rates on the rise, servicing all this debt will continue to get more and more expensive.
Did you know that the government could soon pay more in interest than on defense? Interest costs are projected to become the third largest category in the federal budget by 2026, according to the Peter G. Peterson Foundation’s analysis of Congressional Budget Office (CBO) data. By 2046, these payments could become the second largest category; and by 2048, the single largest category.
“It is a fact that when your national debt gets to the level ours is, that it constitutes an economic threat to the society,” National Security Adviser John Bolton said last week in Washington, D.C. “And that kind of threat ultimately has a national security consequence for it.”
Spending reform, especially entitlement spending reform, is politically unpopular and will require bipartisan support, according to Senate Majority Leader Mitch McConnell.
“I think it’s pretty safe to say that entitlement changes, which is the real driver of the debt by any objective standard, may well be difficult if not impossible to achieve when you have unified government,” McConnell told Bloomberg last month.
The U.S. isn’t alone in its budget woes, of course. Several European Union (EU) members are facing big budget crunches of their own, with Belgium, Spain and Italy leading the way. Last month, Moody’s Investors Service reported that “rising mandatory spending and slowing economic growth have left a number of euro area governments with less budget flexibility than before the financial crisis a decade ago.”
So how will this all play out, and what can investors do?
Could the “Barbell Strategy” Whip Your Portfolio Into Shape?
We all know what happened in 2007 and 2008, after debt levels became unsustainable. During the interview, Taleb stopped short of predicting another such crash, but he stressed the importance of paying attention to the risks.
As for his current allocations, he’s invested in real estate, short-term Treasuries and gold, “just in case.” If you own stocks, he said, make sure you have some kind of put protection. Readers of his books might recognize this approach as the “barbell strategy.” Here he is in The Black Swan:
If you know that you are vulnerable to prediction errors, and if you accept that most “risk measures” are flawed… then your strategy is to be as hyperconservative and hyperaggressive as you can be instead of being mildly aggressive or conservative. Instead of putting your money in “medium risk” investments… you need to put a portion, say 85 to 90 percent, in extremely safe instruments, like Treasuries—as safe a class of instruments as you can manage to find on this planet. The remaining 10 to 15 percent you put in extremely speculative bets, as leveraged as possible (like options), preferably venture capital-style portfolios. That way you do not depend on errors of risk management.
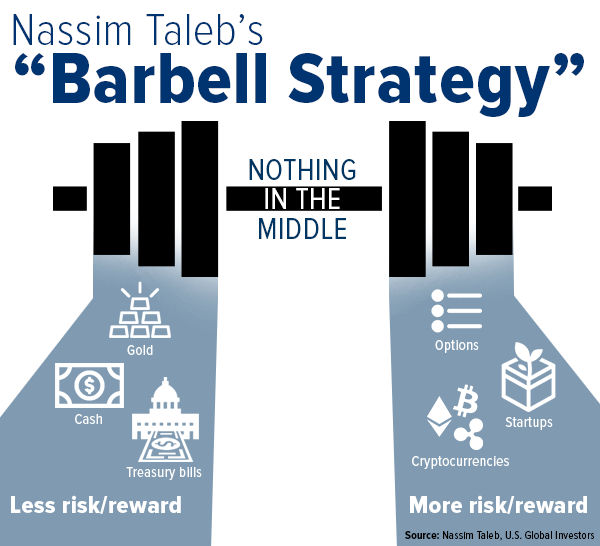
I share Taleb’s unconventional allocation strategy with you not because I fully endorse it but simply as food for thought. It evokes the discussion I had earlier in the week about investing vs. speculating, with gold and government bonds on one end, venture capital and digital currencies on the other. And although I believe your portfolio should leave room for equities—domestic as well as emerging market—there is some merit to Taleb’s idea that you should be both incredibly defensive and incredibly aggressive.
You can watch the full Bloomberg interview by clicking here.
The Fear Trade and Love Trade Make Gold Look Compelling
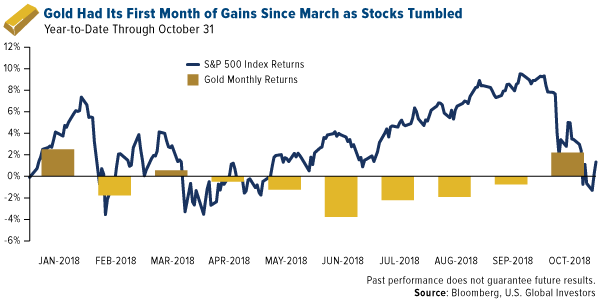
Speaking of gold, the Fear Trade moved prices in October, the “jinx month,” as volatility spiked and stocks lost most of their gains for the year. The yellow metal managed to notch its first positive month since March, despite still being under pressure from a stronger U.S. dollar and higher yields.
The third quarter was a solid one for gold’s Love Trade, according to the most recent report by the World Gold Council (WGC). Total demand in India was up 10 percent from the same time a year ago, just ahead of this week’s Diwali festival. Chinese demand increased at about the same rate, with jewelry sales up during the Qixi festival, China’s equivalent of Valentine’s Day.
Purchases made by central banks, meanwhile, were very robust in the third quarter, up an impressive 22 percent from a year ago. At 148.8 metric tons, the amount was the highest for any quarter since the end of 2015.
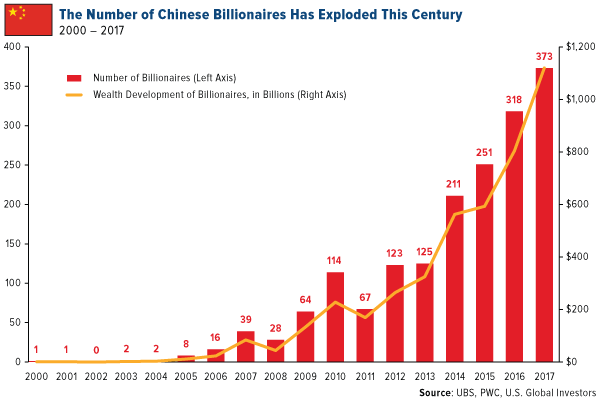
I’ve pointed out before that global gold demand has benefited from a rise in wealth, which we’re seeing today. A recent report by UBS showed that wealth shared among the world’s billionaires enjoyed its greatest-ever increase in 2017, rising 19 percent to a new all-time high of close to $9 trillion. China, however, was the clear standout, with wealth among its now-373 billionaires climbing 39 percent to $1.12 trillion. That’s double the global rate.
The Asian giant minted two new billionaires per week last year, according to UBS, an incredible feat for an economy that had only one billionaire at the beginning of the century.
It’s the Policies, Not the Party
On a final note, midterm elections are tomorrow. Historically, the president’s party has lost Congressional seats in his first term, but it’s important to temper whatever expectations you might have with some perspective. When evaluating the macro investment climate, it’s not the party that matters so much as the policies, and so I’m a firm believer that there are ways to make money no matter which party is in control. I’ll definitely be sure to share with you my thoughts on the election results!
All opinions expressed and data provided are subject to change without notice. Some of these opinions may not be appropriate to every investor. By clicking the link(s) above, you will be directed to a third-party website(s). U.S. Global Investors does not endorse all information supplied by this/these website(s) and is not responsible for its/their content.
The S&P 500 Index is a widely recognized capitalization-weighted index of 500 common stock prices in U.S. companies.


