-- Published: Tuesday, 20 November 2018 | Print | Disqus
By Frank Holmes

Here in San Antonio, the temperature hit a bone-chilling low of 27 degrees last Wednesday, breaking a 102-year-old record for mid-November. An out-of-state visitor, Cornerstone Macros Head of Portfolio Insights Stephen Gregory, speculated that the Central Texas temperature, ordinarily mild this time of year, was down more than three standard deviations. I didnt make the calculation, but my guess would be about the same.
With temperatures so low, its perhaps no surprise that natural gas had one of its best days in years. Its price popped almost 18 percent last Wednesdaybefore falling nearly as much on Thursday. The Energy Information Administration (EIA) reported that natural gas storage in the lower 48 states was below the five-year average as of October 31. This, combined with a stronger-than-expected start to winter, prompted traders to push prices to a four-year high of $4.84 per million British thermal units (MBtu). Meanwhile, natural gas futures trading hit an all-time daily volume record of 1.2 million contracts, according to CME Group.

click to enlarge
Freezing temperatures increase demand for heating, much of which is provided by natural gas. In January of this year, when temperatures fell below the average in many parts of the U.S., demand reached a single-day record of 150.7 billion cubic feet, according to the EIA. I cant say well beat this record again in the coming months, but forecasts for more freezing weather this Thanksgiving week and beyond should support additional moves to the upside.
What kind of moves? Says Jacob Meisel, chief weather analyst at Bespoke Weather Services, the price could get to $7 or $8 per MBtus, levels we havent seen since 2008. This looks like a capitulation move today, but if cold weather really takes off, the sky is the limit, Meisel told CNBC.
Oil Selloff Steepest in Three Years, Overdone
Natural gas wasnt the only commodity that broke records last week. On Tuesday, West Texas Intermediate (WTI) crude oil ended an extraordinary 12 straight days of losses, settling at a 2018 low of $55.69 per barrel, down more than 27 percent from its 2018 high in early October. Triggered by concerns of a global demand slowdown, the plunge is oils steepest in three years, and a stunning reversal from last months calls for $100-per-barrel crude.
The bears appear to have overreacted, though. Crude-oil-position liquidations have never been this extreme, indicating the purge in WTI futures is overdone, writes Business Intelligence strategist Mike McGlone, adding that petroleum markets have never experienced a comparable decline over a similar period.
World Needs the Equivalent of Another Russias Worth of Crude
Again, the oil selloff halted last Tuesday, the same day the International Energy Agency (IEA) announced its estimate that U.S. shale will need to add the equivalent of Russias entire oil production by 2025 to prevent a global shortage. In its flagship World Energy Outlook 2018, the Paris-based group says that world oil consumption will increase significantly in the coming decades due to rising petrochemicals, trucking and aviation demand.
U.S. shale production, which has already been expanding at record pace, would have to add more than 10 million barrels a day from today to 2025, the equivalent of adding another Russia to global supply in seven yearswhich would be an historically unprecedented feat, according to the IEA.

The U.S. produced 11.7 million barrels of crude per day in the week ended November 9. That means shale producers would need to ramp up output to at least 21 million barrels in seven years, if the IEAs estimates are accurate.
I think this would be a challenge, but a real possibility. The reason I think this is because the U.S. fracking industry continues to prove it can produce more with less. According to a recent report by the EIA, U.S. crude oil and natural gas production increased in 2017, despite there being fewer wells. This is thanks in large part to horizontal wells, which contact more reservoir rock and therefore produce greater volumes of oil and gas. Although more expensive to drill, horizontal wells are growing faster than traditional vertical wells. In 2017 they accounted for 13 percent of total well drills, up from only 10 percent three years earlier.
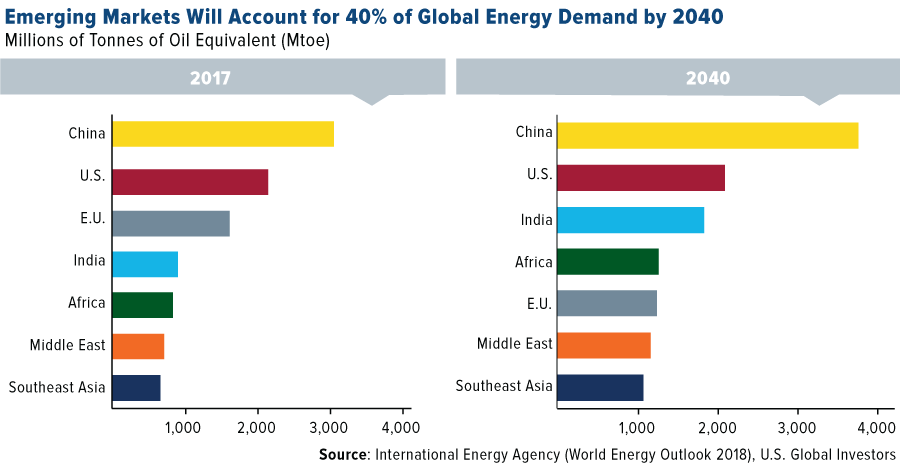
Also in the IEAs outlook: By 2040, emerging markets, led by China and India, will account for 40 percent of global energy demand, up from 20 percent in 2000. Below, note how the European Union is expected to be displaced by India and Africa in terms of energy demand within the next couple of decades.

click to enlarge
I believe only the U.S. fracking industry would be able to meet this demand. Russia and Saudi Arabia are pumping at record levels right now, but production cuts of as much as 1.4 million barrels per day are being discussed among members of the Organization of Petroleum Exporting Countries (OPEC) to firm up prices. If cuts do go into effect, U.S. producers can be expected to fill in the supply gap.
It can happen but would be a small miracle, said Fatih Birol, the IEAs executive director.
U.S. Shale More Profitable Than Ever
Normally, ever greater supply would weigh on prices and weaken profitability. Based on new data, it looks as if the U.S. fracking industry has changed the game.
According to Reuters, U.S. shale firms are more profitable than ever after a strong third quarter, according to the agencys analysis of 32 independent producers. These companies are producing more efficiently, generating more cash flow and consolidating in a wave of mergers.
Nearly a third of these 32 companies generates more cash from operations than they spent on drilling and shareholder payouts, a group including Devon Energy, EOG Resources and Continental Resources. A year ago, there were just three companies on that list, Reuters writes.
Thanksgiving Travel to Hit 13-Year High
On a final but related note, this week is Thanksgiving, the busiest travel season of the year in the U.S. The American Automobile Association (AAA) predicts that the number of travelers on Thanksgiving Day, by auto and air, will top 54.3 million people, an increase of almost 5 percent from last year, and the highest volume since 2005.
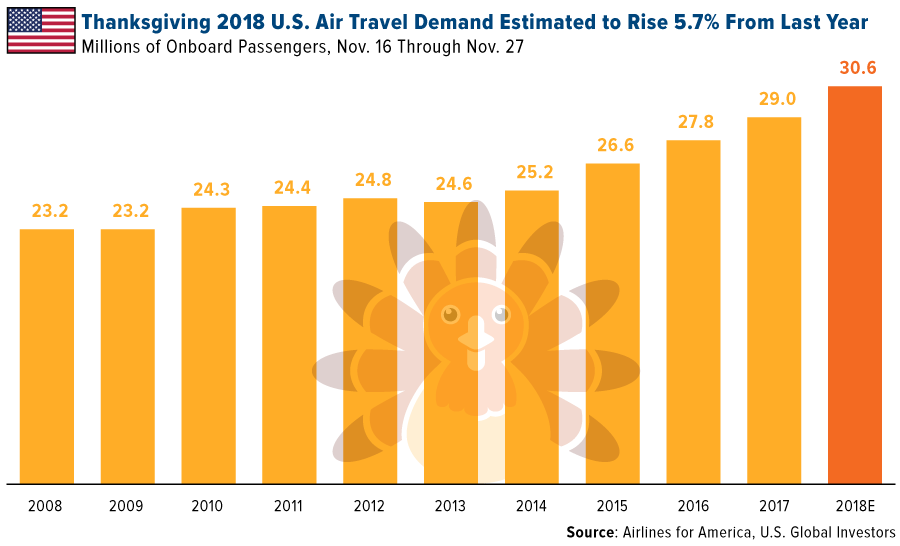
Similarly, Airlines for America (A4A) believes U.S. Thanksgiving air travel demand between last Friday and November 27 will climb to an all-time high of 30.6 million passengers. It is thanks to incredibly accessible and affordable flight options that more travelers than ever before are visiting loved ones, wrapping up year-end business or enjoying a vacation this Thanksgiving, commented A4A Vice President and Chief Economist John Heimlich.

click to enlarge
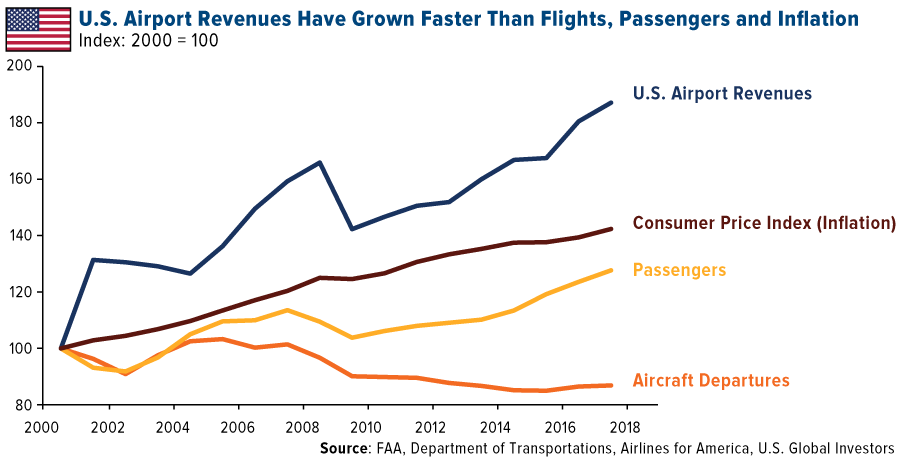
While Im on the topic of aviation, A4A also reported that U.S. airport revenues have grown faster than the consumer price index (CPI) as well as the number of air passengers and aircraft departures. From 2000 to 2017, airport revenues rose 87 percent, double the pace of U.S. inflation. Increased growth came thanks to a number of resources, from taxes and fees to the Passenger Facility Charge (PFC) and Airport & Airway Trust Fund (AATF).

click to enlarge
According to Fitch Ratings, strong overall performance for U.S. airports should continue undeterred for the foreseeable future. Over 90 percent of the airports Fitch currently rates have a Stable Rating Outlook, signifying continued stability deep into 2019.
Curious to learn more? Explore our latest slideshow, How Do Airports Make Money?
Standard deviation is a measure of the dispersion of a set of data from its mean. The more spread apart the data, the higher the deviation. Standard deviation is also known as historical volatility.
The Consumer Price Index (CPI) is one of the most widely recognized price measures for tracking the price of a market basket of goods and services purchased by individuals. The weights of components are based on consumer spending patterns.
Holdings may change daily. Holdings are reported as of the most recent quarter-end. None of the securities mentioned in the article were held by any accounts managed by U.S. Global Investors as of 9/30/2018.
All opinions expressed and data provided are subject to change without notice. Some of these opinions may not be appropriate to every investor. By clicking the link(s) above, you will be directed to a third-party website(s). U.S. Global Investors does not endorse all information supplied by this/these website(s) and is not responsible for its/their content.
| Digg This Article
-- Published: Tuesday, 20 November 2018 | E-Mail | Print | Source: GoldSeek.com