-- Published: Sunday, 9 December 2018 | Print | Disqus
By Steve St. Angelo
Over the past week, the gold and silver prices have held up rather well compared to the overall markets. While precious metals investors still fear that a huge sell-off in the gold and silver prices will take place during the next market crash, it seems that the metals continue to be very resilient during large market corrections.
Now, I am not saying that the metals prices cannot fall any lower, but a lot of the leverage in the gold and silver market has already been removed and is now at a near all-time low. So, even though we could see weaker precious metals prices, the overwhelming leverage and bubble asset prices are in the stock and real estate markets.
Furthermore, one of the reasons precious metals investors still fear that a major selloff is imminent is that they are using the 2007-2008 economic market meltdown as a guideline. However, when gold and silver prices were plummeting from their highs in 2008, along with the rest of the market, speculators held huge long positions while the commercials controlled an enormous number of short contracts.
If we look at the following Gold Hedgers Chart, we can clearly see that the market setup today is the exact opposite of what it was in 2008:
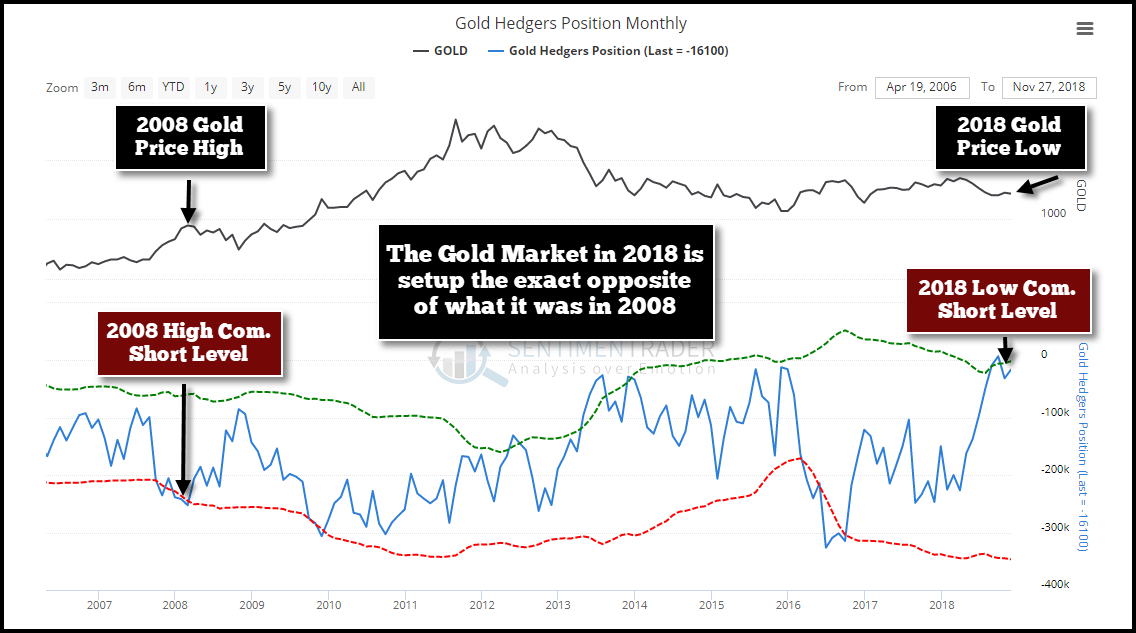
When gold was trading near $1,000 in early 2008, the commercial banks held a record high of 252,000 net short contracts compared to the present gold price of $1,222 (time of chart), with the commercials only holding 16,000 net short contracts. The commercial short positions are shown by the blue line. Thus, the higher the commercial short positions, the lower the line goes and the lower the number, the higher the line moves. Currently, the gold price and commercial net short positions are both at the near lows. Also, the speculator net long positions are close to their lows as well
So, when PUSH COMES TO SHOVE, we won’t see a large number of speculators forced to cover their long gold positions if the gold price falls lower because there isn’t that much leverage in the market.
Gold & Silver Prices Increase As The Market Sells Off
Over the past week, as the markets fell, the gold and silver prices did quite the opposite. If we look at the next three charts, the Dow Jones fell by more than 1,600 points since Dec 3rd, while gold increased $26 and silver gained $0.45:
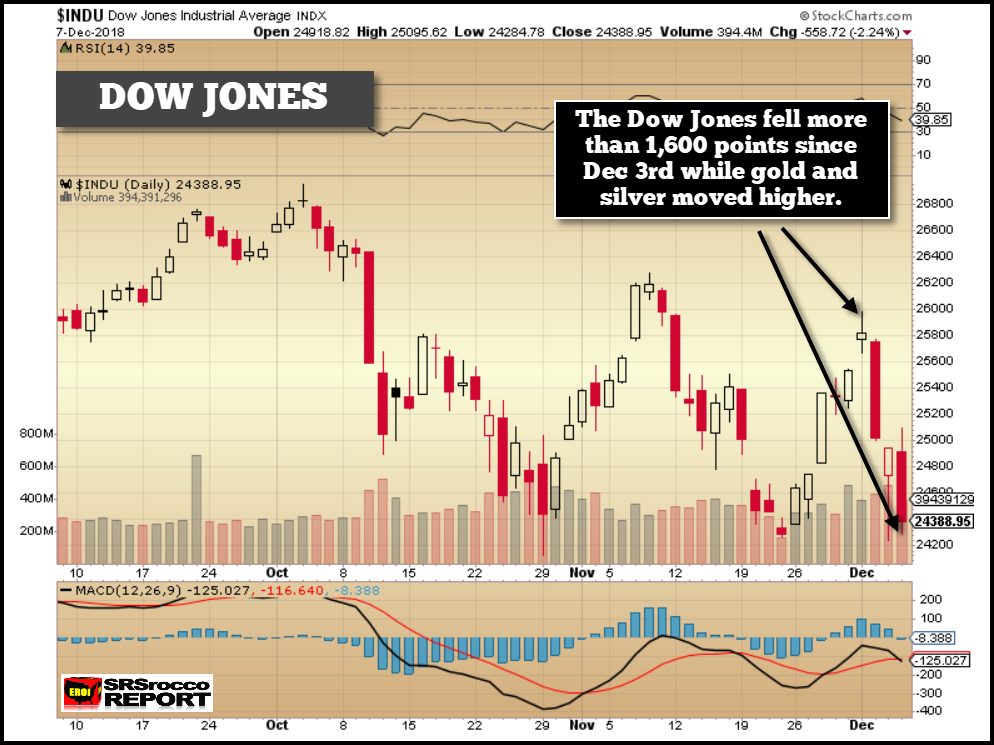
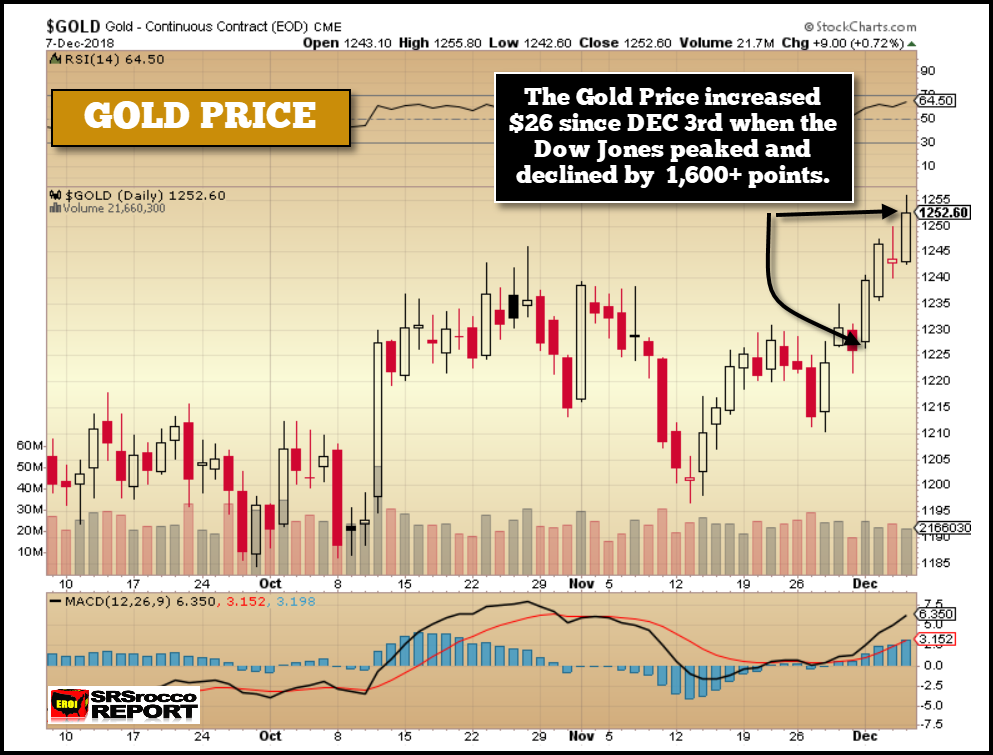
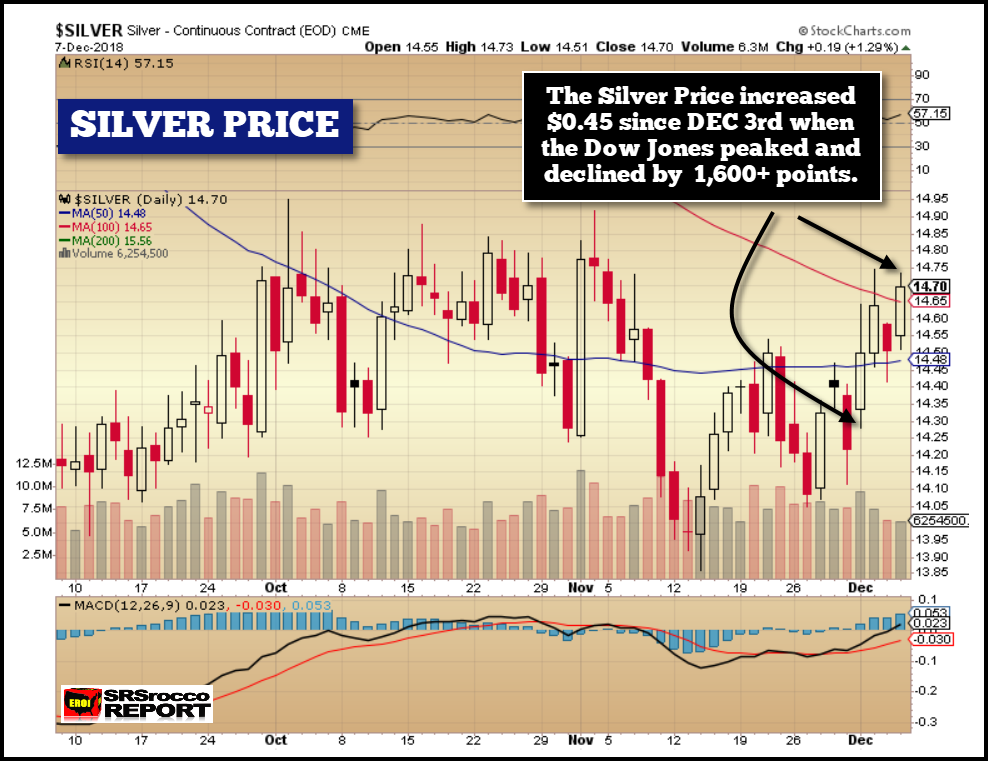
So, as we can see, both gold and silver increased while the Dow Jones Index sold off from its peak on Dec 3rd. If we focus on the gold and Dow Jones charts, we can clearly see that the gold price, on many days, moves in the opposite direction of Dow. This tells me that traders are already practicing SAFE ASSET INVESTING during market selloffs. What happens when FEAR really enters the market?
Moreover, the notion that the gold and silver prices are tied to the oil price doesn’t seem to be the case lately. Since the oil price peaked at $77 at the beginning of October, the silver price over the same period is about the same while gold is $40 higher:
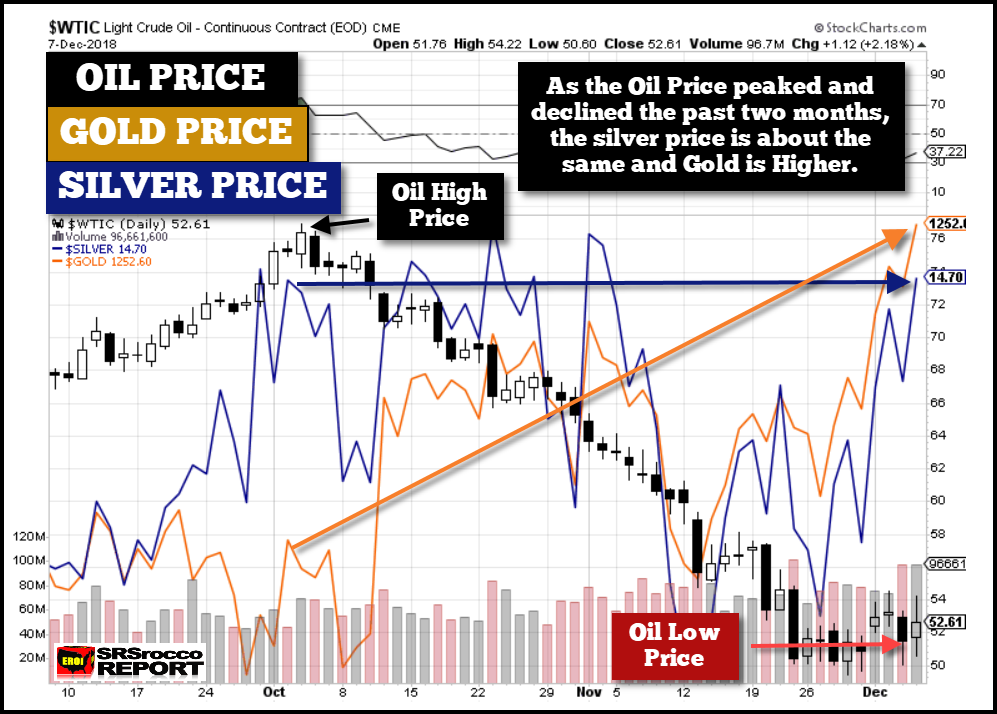
And, even as the gold and silver prices jumped since Dec 3rd, the oil price is actually lower. Again, the precious metals are holding up rather well compared to the markets and the oil price. I believe precious metals investors will be surprised how well the gold and silver prices will do when the highly leveraged markets crash over the next few years.
Lastly, I will be publishing a new short video shortly on some very interesting charts on how technical levels have played a role in the broader markets, precious metals and energy prices.
Check back for new articles and updates at the SRSrocco Report.
| Digg This Article
-- Published: Sunday, 9 December 2018 | E-Mail | Print | Source: GoldSeek.com

