-- Published: Wednesday, 26 December 2018 | Print | Disqus
By Steve St. Angelo
The much awaited and hoped for Santa Claus Rally turned into a complete rout today as the broader markets continued to sell-off to new lows this month. The Dow Jones plunged a stunning 653 points today, the worst in the in the 122-year-old history of the index. Furthermore, the Dow is on track for its biggest December loss since the Great Depression.
The Dow Jones was trading at nearly 26,000 at the beginning of December and just closed at 21,792. That is a 16% decline so far this month. As I mentioned in my last video, GOLD INVESTING: What Really Drives The Market Price, I posted a chart showing that the Dow Index had a critical support level of 24,000. I stated that the Dow reached a high of 26,000 at the beginning of 2018 and has been trading up and down off the 24,000 support level for the entire year. The Index actually hit another record high of nearly 27,000 at the beginning of October.
When the Dow finally closes below the 24,000 on a monthly basis, it can get very ugly. We still have three full trading days and a half day on New Years Eve for the Plunge Protection Team to do their magic and push the Dow back above the 24,000 level, but I doubt they will be able to do so. If the Index was down 500-1,000 points from the 24,000 level, then it might be possible. However, the Dow is down 2,200 points from that level.
Here is my updated Dow Jones Index with the Monthly support and resistance levels:
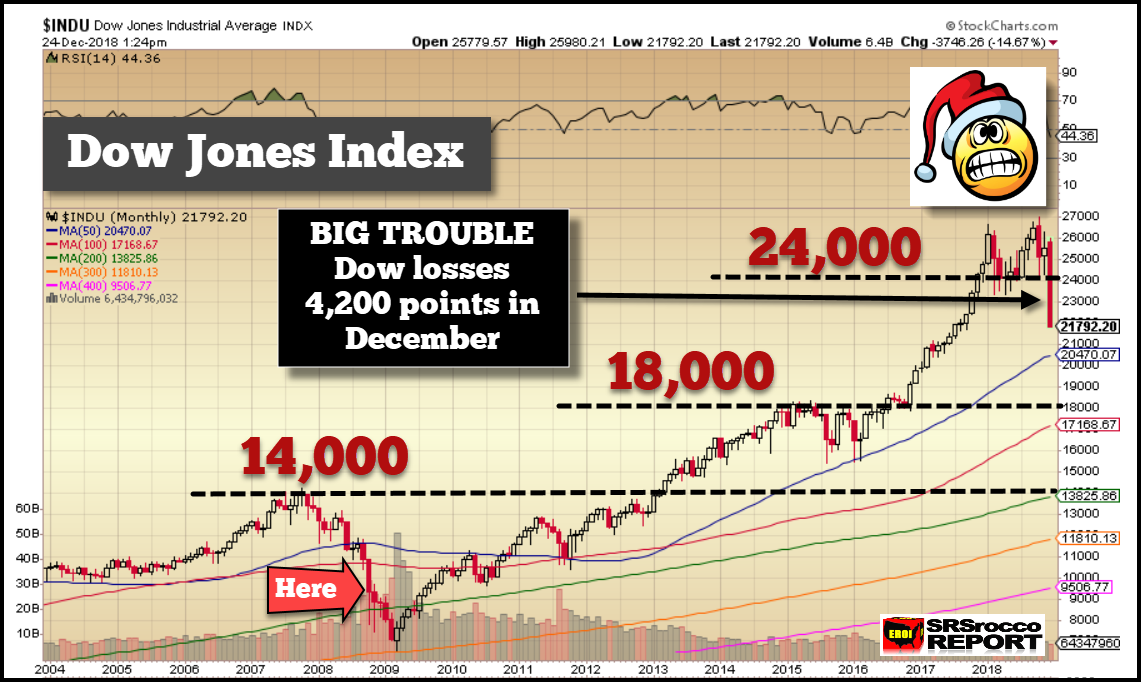
You will notice that the present Dow (monthly) candlestick is the biggest decline ever. Its even larger than the 3,000+ point drop in October 2008, shown by the RED ARROW. However, if you look at that candlestick, it recovered from its lows that month. According to the data, the Dow Jones opened on October 2008 at 10,847, fell to a low of 7,773 and closed at the last day of the month at 9,325. That is why it has that large wick at the bottom of the candlestick.
Now, that could also happen to the Dow for the remainder of December. We might see a nice rally, so traders wont get too nervous about the market in 2019. Either way, I believe the Dow will still drop to the 50 MA (BLUE LINE) at 20,470 and then we might see a nice correction higher before the continued BEAR MARKET.
If the market behaves similar as to what took place in 2007-2009, the Dow Jones Index will likely fall back below the 14,000 level by the summer or fall in 2019
could even by much sooner. Yes, of course, the Fed might get nervous and stop raising interest rates and start QE money printing again. That would change the dynamics of the market as we would then be entering the beginning stages of hyperinflation. But, if the Fed continues to raise interest rates as it says two more times in 2019, then we are going to see a continued sell-off in the broader markets.
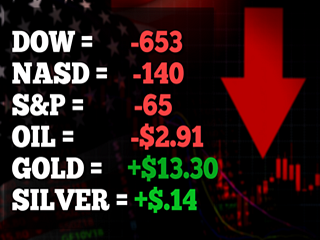
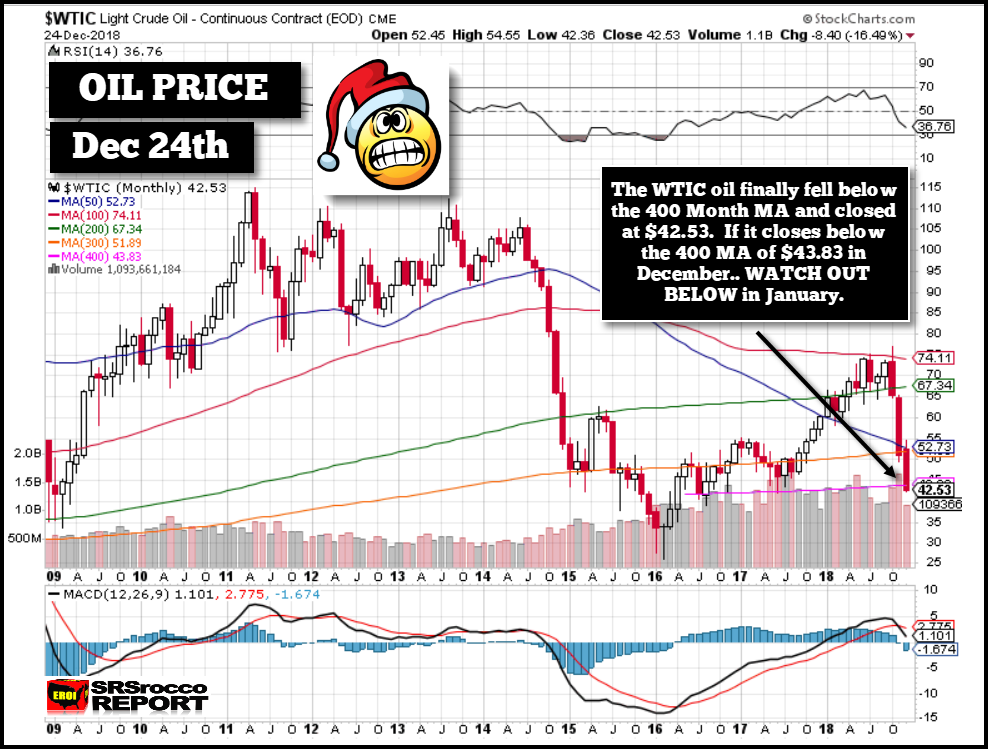
It was very interesting to see just about everything trade deeply in the RED today except for the precious metals. Gold was up nicely by $13+ and silver gained nearly 1%. Hell, even the U.S. Dollar Index fell 33 points. I was quite surprised to see the oil price fall that much on Christmas Eve after it has been down 40% since the beginning of October. The West Texas Intermediate Oil price fell $2.91 to a new low of $42.53. That is very BAD NEWS because it is now below the very critical 400 Month MA (PINK LINE)of $43.83:
With the oil price now trading at $42.53, even more of the U.S. Shale Oil producers are now hemorrhaging losses. I have since updated the chart by Art Berman to include to the oil price line below:
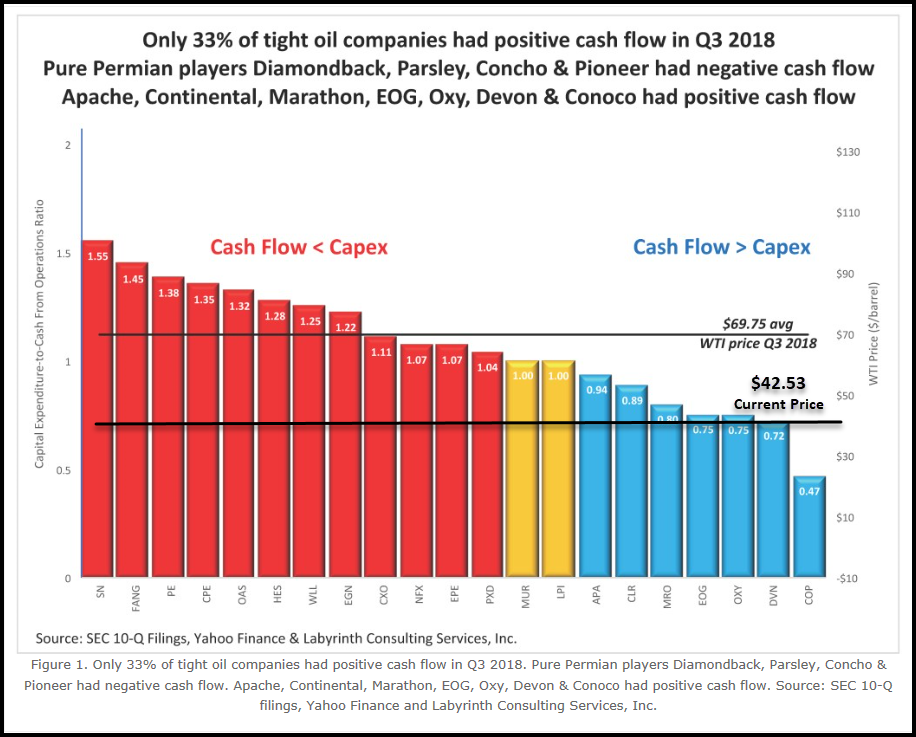
So, with the current oil price of $42.53, only one company, COP Connoc0 Phillips is making money. Even though the average oil price for Q4 will be much higher than the present spot price, these companies will likely be facing $40-$45 for Q1-Q2. If the oil price does remain that low in the first half of 2019, watch for serious FIREWORKS in the U.S. Shale Oil Patch.
Finally, I am glad that I am a precious metals investor because 2019 is going to be one hell of a year.
Merry Christmas and Happy Holidays to everyone.
Check back for new articles and updates at the SRSrocco Report.
| Digg This Article
-- Published: Wednesday, 26 December 2018 | E-Mail | Print | Source: GoldSeek.com


