-- Published: Thursday, 3 January 2019 | Print | Disqus
By Ryan Wilday
Some time has passed since I wrote a more lengthy article, but not nearly as long a time as this grueling bear market in cryptos - now 12 months long, and counting. So, in this article Id like to rewind the clock a bit.
When we first saw our bull market top in cryptos, I did not fully expect a long bear market such as weve seen. While the March breakdown confirmed in my mind that the $3000 to $4700 zone would be visited again, I did not think it would take this long.
Further, we had many false rallies along the way. You may recall that I followed the April rally with a long position just in case the market decided to break out earlier than I expected. The price action appeared solid. Sometimes markets dodge intermediate support when they are in a longer-term bull market. So I took a shot.
However, by June we were looking at confirmation of a breakdown, and I have seen no reason to be bullish since then. In fact, the best Bitcoin could muster during that time was a sideways triangle that persisted for six months. That broke down aggressively on November 14th and brought the market into our long-term support zone.
So here we are, recently hitting deep into that long-term support zone. We have a nice bounce off the lows, providing a 30% return off our low at $3120. But is this the final bottom? Regardless of whether I pinpointed this region or not, we have to see what price can do here. If we do not hold this region, my long-term perspective on Bitcoin will have been invalidated. Thats not to say it will never be bullish again, but Ill be looking at $1600 and $700 for a potential bottom, if our low at $3120 does not hold. I will let go of the long term count Ive held onto through this correction.
This has definitely been a swing traders market since our top last January, providing ample opportunity for traders to profit on both sides of the trade, long and short. In that spirit, I take a swing traders perspective on this bounce. We have strong price action off the low, at least as strong as in April, which although it failed, provided a decent long trade.
But for this to turn into a larger bottom, price has much work to do.
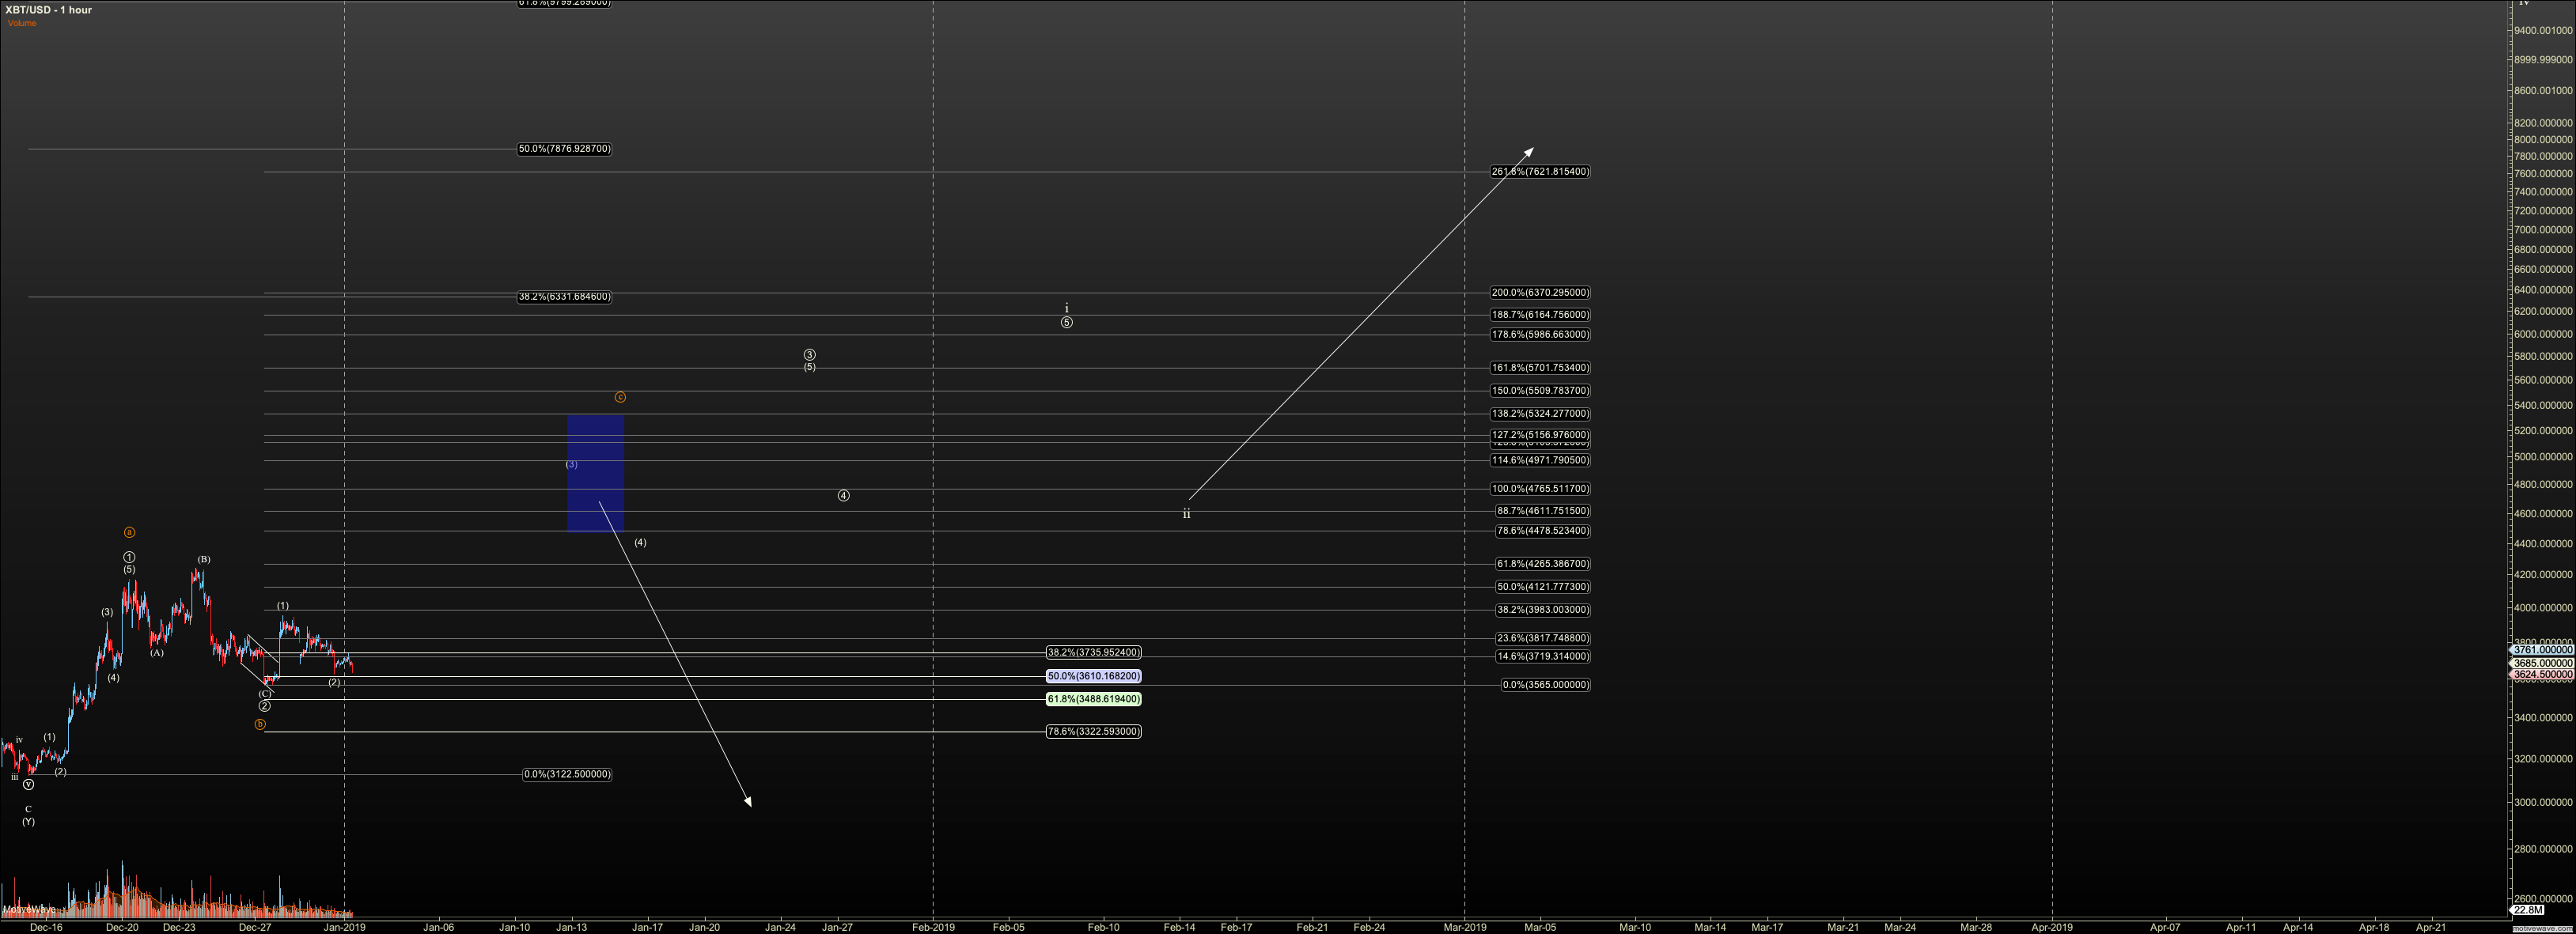
So far weve seen a rally from $3120 to $4230 in an impulsive five waves. Five waves versus three is significant, as it suggests we have more room to rally, if support is held.
I pinpoint support currently for circle-2 at $3320, although Bitcoin was not able to drop below $3565. If that level can hold, I mark it circle 2 which prepares us for the next degree third fifth wave, targeting $5700 and $5985 respectively.
If this count can fill in, we have a much stronger probability that our bear market has ended, and more so if we hold the next degree support. Ill mark that support when we have a confirmed top in circle 5.
Also, in such a price structure, I watch the points of wave symmetry. The price halting in those zones is the early sign of a corrective rally, or a "dead cat bounce" as some like to call it. This zone is between $4780 and $5300 and is marked by a blue box. If we see an impulsive five waves down, out of that region, I will again become a bear.
Of further interest to me is that this potential impulse I am tracking points up toward the triangle that broke down on November 13th.
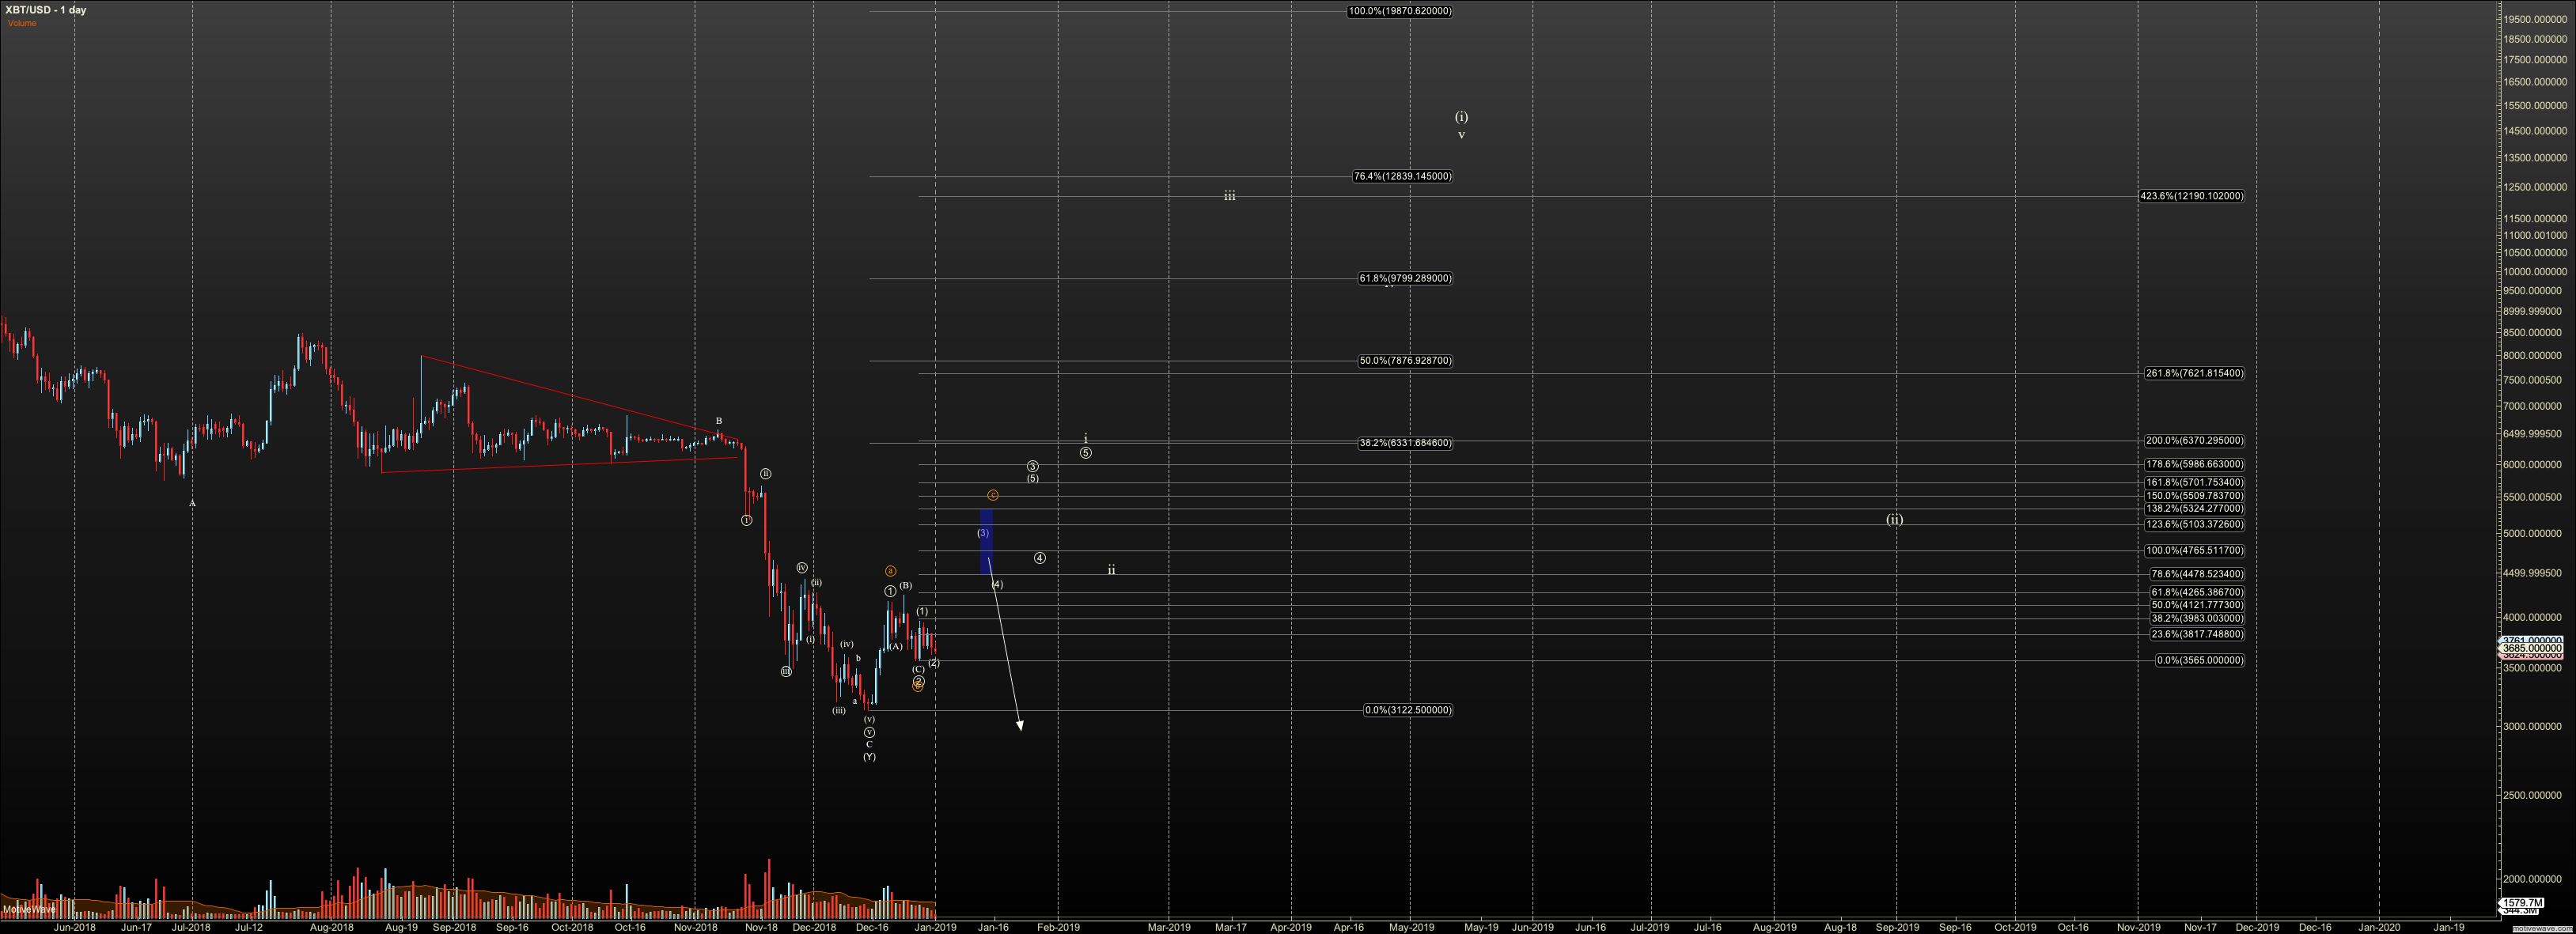
When price was rattling up and down in the triangle, many looked at the trendline that was rising below the price, ignoring the trendline that was falling on top of the price, and called the price action bullish. During late November many commentators on my articles and Tweets bid me turn bullish. But I couldnt, as a triangle is a continuation pattern, in Elliott Wave and all other technical analysis disciplines. I was short. And the breakdown was tremendous.
But in return, if we can breach that area where hope was dashed, we may see a feedback loop that propels the price higher. Often in those places, where sentiment is strong in one direction and price consolidates heavily before going against the crowd, we have a zone that is hard to overtake. But when it does, it doesnt go quietly. I suspect this triangle, highlighted in red trendlines, is one such area.
If we step away from price and look at sentiment, it seems to me that sentiment is quite bearish and the news is quite grim. While in November I was pushed in social media to be bullish, I am now scoffed at for being bullish, even if Im only a cautious bull. We can find many articles and talks from pundits where the authors and speakers pat themselves on the back for calling crypto a bubble. From comments by Nouriel Roubini, to articles in major publications like the Financial Times, to comments by the heads major banks give suggestion that bitcoin will never retake its old highs.
We also see that many crypto businesses are going out of business, or being restructured. Bitmain, STEEM Inc, Consensys, and Bitcoin News, are just a few examples. This is also common near the end of bear markets, as price deflation pushes market participants to the brink.
But news and sentiment are secondary. Price is king. For now, Ill take the strong swing trade weve seen, and build on the trade as long as price progresses over support. Id like to see Bitcoin rally back over $6000 before deploying more long-term money in this space.
As alluded to above, if Bitcoin cannot remain over $3320, my expectation will be that we see a much larger bear market, with confirmation coming with a break of $3120.
Further, if at any point this rally turns corrective in nature, in a B wave rally as we call it in Elliott Wave, Ill expect the market to come down later in a C wave, extending our bear market out in time. Ive marked that potential on my long-term chart attached, in orange. Bitcoin dropping to the $3000 region, while not a break of my key support, opens the door to a higher degree fourth wave.
In conclusion, we have seen a much longer bear market than many expected, including me, though I am not at all surprised by the depths of this bear market. Yet all we can say at this juncture is that we have an attempt by this market to bottom, but that it has much work to do, as price action has been very destructive. Markets dont need a giant influx of buyers to turn bullish. They need only to reach capitulation, where selling slows or ceases because there are few sellers left.
So the question is whether this market has capitulated sufficiently. Id like to think so, after a decline of over 85% in the price of Bitcoin. But this remains to be seen.
The content on this site is protected
by U.S. and international copyright laws and is the property of GoldSeek.com
and/or the providers of the content under license. By "content" we mean any
information, mode of expression, or other materials and services found on GoldSeek.com.
This includes editorials, news, our writings, graphics, and any and all other
features found on the site. Please contact
us for any further information.
Live GoldSeek Visitor Map | Disclaimer
The views contained here may not represent the views of GoldSeek.com, Gold Seek LLC, its affiliates or advertisers. GoldSeek.com, Gold Seek LLC makes no representation, warranty or guarantee as to the accuracy
or completeness of the information (including news, editorials, prices, statistics,
analyses and the like) provided through its service. Any copying, reproduction
and/or redistribution of any of the documents, data, content or materials contained
on or within this website, without the express written consent of GoldSeek.com, Gold Seek LLC,
is strictly prohibited. In no event shall GoldSeek.com, Gold Seek LLC or its affiliates be
liable to any person for any decision made or action taken in reliance upon
the information provided herein.