-- Published: Friday, 4 January 2019 | Print | Disqus
By Marin Katusa
On Wednesday, January 2nd, CEO Tim Cook halted Apple stock and stated that the companys earnings would fall well short of analysts expectations.
A key reason behind the revenue miss was slowing Chinese demand.
Tim Cook made the shortfall about the trade wall but he forgot to mention that iPhones arent even a top 5 phone in China.
Maybe Apples overpriced products arent what the mainland Chinese want?
Anyways, to a bigger theme, slowing Chinese demand
Slowing Chinese demand is becoming a key theme for equity and commodity markets alike. And while a few less iPhone sales wont affect the copper market, global consumer spending habits and economic health certainly will.
Make no mistake, I am very bullish on the long-term prospects for copper.
I believe the world will become more electrified, which means increased copper demand. However, in the short run, macroeconomic signals are telling me that we could see one more wipeout.
Below Ill tell you what the data and my analysis are saying.
51.4 billion pounds of copper was consumed globally in 2018. This represents a 1.08% increase over the same period in 2017. The chart below shows annual copper consumption since 1995.
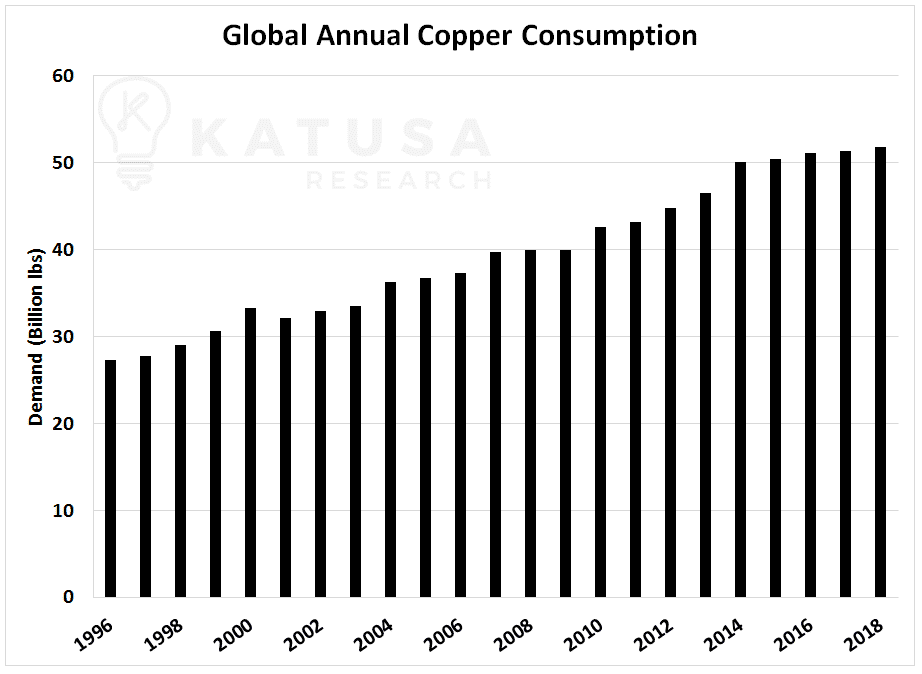
The average annual copper consumption growth rate since 1995 has been 3.16%.
However, over the last few years growth rates have slowed significantly. The average growth rate from 2015 to 2018 is around 0.83%.
The consensus long-term estimates by most analysts is that copper will see a 2.5% annual increase in demand. At this rate, global shortage of copper would occur in the mid-2020s. And that can only be resolved by higher copper prices to bring on higher-cost production.
But, 1% copper growth doesnt cause higher copper prices.
In fact, the copper price would decrease as supply would exceed demand over the next few years.
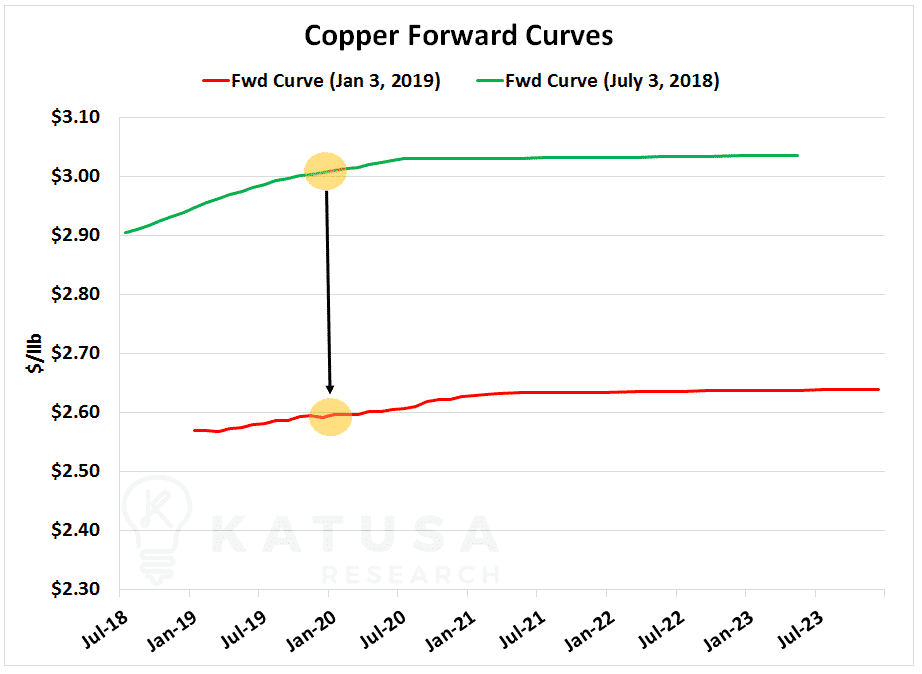
Charts to Watch #1 Copper Forward Curves
I have been paying very close attention to the forward curve (which is what forward hedges are based on). The futures curve are prices expected by buyers and sellers in the months and years ahead. And it has been decreasing a lot over the past six months.
Youll see that the expected prices today are much lower than six months ago.
Heres an example
On July 3rd 2018, copper prices were expected to be around $3.00 per pound in January 2020. Today, copper destined for sale in January 2020 is expected to sell for less than $2.60 per pound.
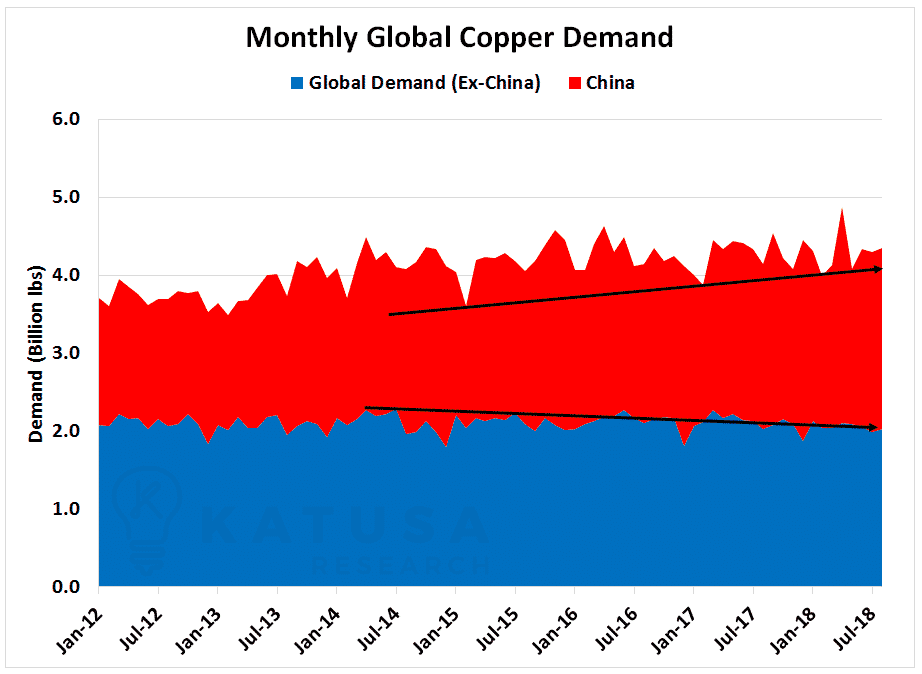
Below is a chart which shows monthly copper demand. The blue line shows global demand excluding China. Its clear that copper consumption is actually slowing down. The question is, will China still consume the red metal as it has in the past? Or will Chinas consumption also cool down?
Charts to Watch #2 Global Copper Inventories
Inventories have declined in recent months, but are nowhere near alarming levels.
Below is a chart which shows copper inventories at both places like the Shanghai and London Metal Exchanges (on exchange), as well as private warehouses (off exchange).
The sum of on and off exchanges equals the global inventory level for copper.

Charts to Watch #3 Copper Days of Supply
Lets take this a step further and divide total global inventory levels by global demand. This ratio generates a number I like to call Days of Supply.
A high number indicates there is no shortage of supply and is bearish for copper prices.
A low number indicates there could be a supply crunch on the horizon and would be bullish for copper prices.
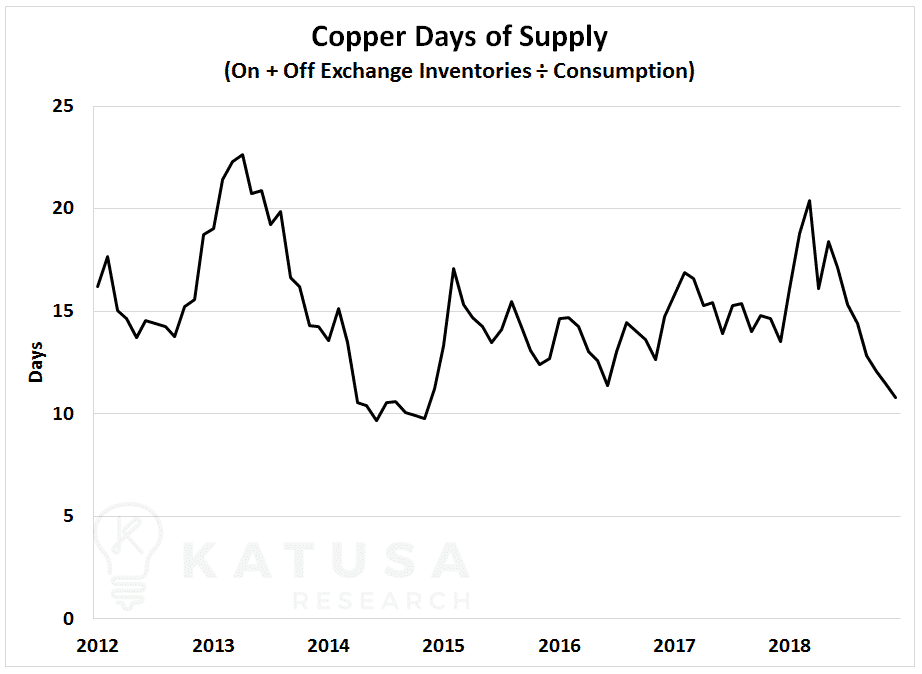
Right now, the copper market is sitting at around 10 days of supply, based on known inventories and consumption levels.
Given that days of supply has dropped from 20 to 10 in the matter of months, we can infer that demand is outpacing supply.
The billion-dollar question is, how are inventory levels going to stop falling?
Is supply going to increase, and match consumption levels? Or will consumption levels fall? I believe that in the short term, it will be the latter.
I think we are going to see weak copper consumption out of China and the emerging markets, which accounts for over 50% of global consumption.
If Im right, copper prices are going to remain under pressure for the short term.
Top Copper Stocks and Their Performance in 2018
Below is the sector performance of copper companies as an index. You can see that being exposed to copper producers has been a tough place to be.
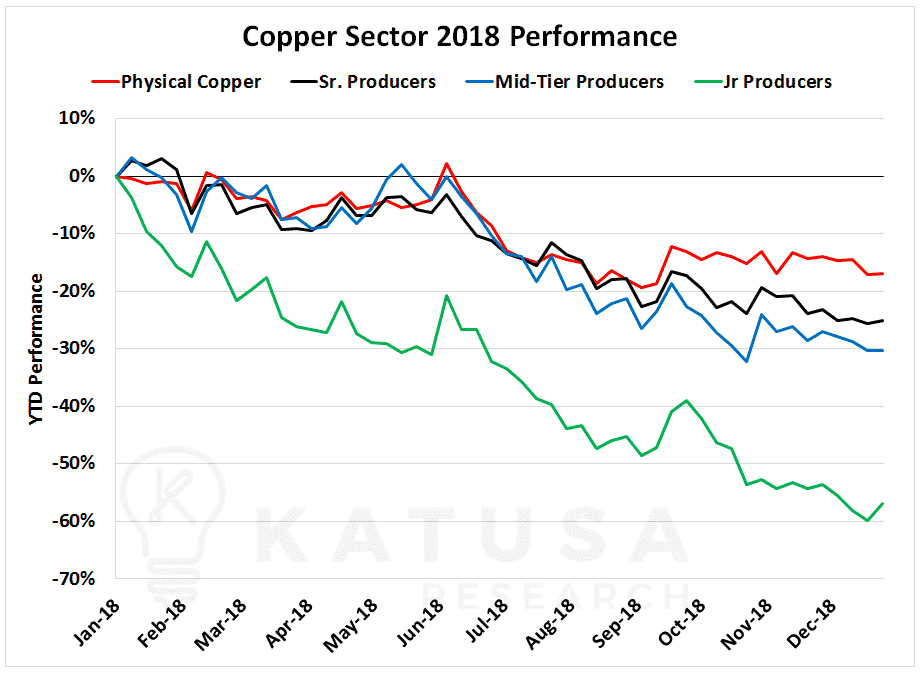
I have been intimately involved in the copper sector for almost 15 years.
Ive been on the board of one of Canadas largest copper producers for 13 years now. I have firsthand experience taking an exploration project to production.
Its been an incredible learning lesson. And one that Ive taken to help improve my investment and speculation moving forward.
I want to increase my exposure to copper, but timing is key.
I have updated the performance of all the copper producers year-to-date.
The universe of copper producers that make up the indexes above are in the chart below. You can see all of the publicly listed copper producers and their year-to-date share price performance.
An interesting mining fact to think about: This time ten years ago, the copper universe would have had 80 companies listed. Today there are 29 companies.
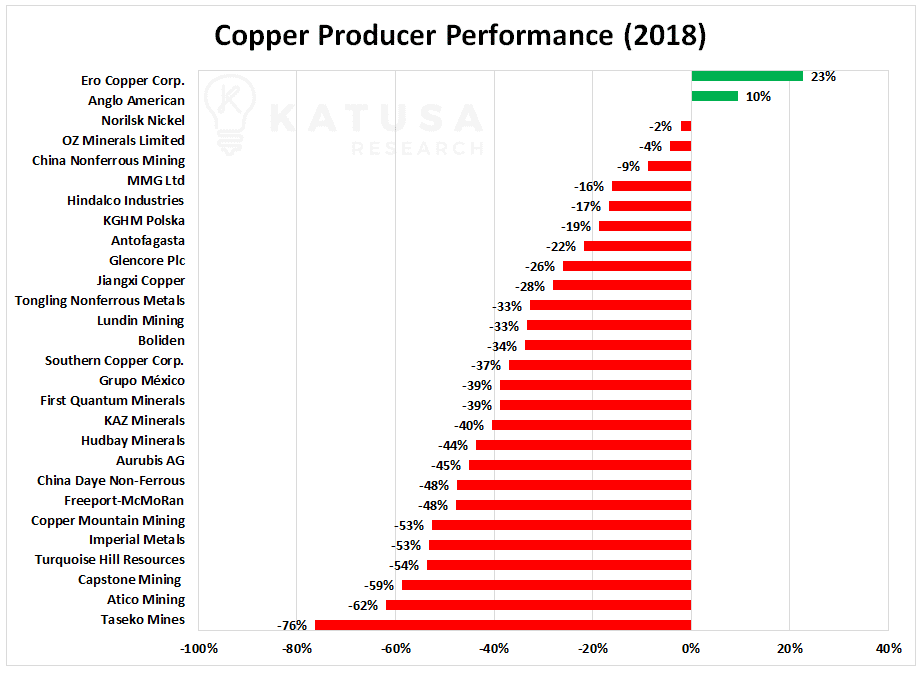
Even though some of the worlds top copper producers have fallen over 20% year-to-date, some will fall a lot more before they have their day in the sun again.
The above price carnage all happened as the price of copper fell from $3.30/lb to the current $2.64/lb.
Lets be totally clear, there is a global economic slowdown happening.
There are many reasons for this, but the stronger U.S. dollar relative to other fiat currencies is a big concern for the emerging market.
A strong U.S. dollar makes commodities (and the debt associated with those projects) more expensive for the emerging markets (especially when the emerging market nations currency is depreciating).
And increasing interest rates means borrowing those U.S. dollars will be even more expensive for companies in the emerging markets. This results in less demand for commodities from the emerging markets and China.
This slowdown will cause copper consumption rates to fall from its 30-year average of 3% to 0-1% growth. Or even negative growth in copper demand within the next 36 months.
Copper production above $2 per pound is quite stable over the next 24 months. Yes, I know all the copper bulls will troll me online because of this statement. Do as you please.
There will be no shortage of copper in the next couple of years, regardless of if copper is $2.50 a pound or $2 per pound.
As prices decline, copper producers and developers will see their share prices fall significantly.
This is what will cause what I am calling the copper wipeout.
And then the cycle will begin again, because the cure for low prices
is low prices.
Again, I have set myself up with a high percentage of cash (in U.S. dollars) for when the coming Copper Wipeout occurs.
I dont know when it will happen, but I believe it will and will prepare accordingly.
I will only be buying the following two kinds of companies:
- World-class, lowest cost quartile operating companies with strong balance sheets at massive discounts
- Drilled out world-class discoveries that will be bought out by larger companies
Those will be the first to rebound post Copper Wipeout.
Then as those stock prices surge, the market will look further down the food chain for the next win.
This means the development and exploration companies will see an influx of buying. But that will be after the wipeout begins to recover.
Everything I write in Katusas Resource Opportunities is what I am doing with my own money in the resource markets.
Companies like Freeport (which was once the copper king) will be crippled by their debt in a rising interest rate environment. Add to that Freeports exposure to AK-47 nations, and the once Best Copper Miner in the World will lose its title. Then itll either merge or sell off its best assets to stay alive.
Commodities are a cyclical business, as are the reigning champion producers.
The entire copper production landscape will change after the next wipeout.
That said, I have my wish list of copper producers I want to buy.
My eyes are laser focused on a few stocks, but until the wipeout occurs, Im waiting to pounce.
I believe the share prices of even the best producers will go lower. Then there will be an incredible opportunity to make a tidy fortune.
Regards,
Marin
https://katusaresearch.com/could-there-be-a-copper-wipeout/
| Digg This Article
-- Published: Friday, 4 January 2019 | E-Mail | Print | Source: GoldSeek.com


