-- Published: Monday, 14 January 2019 | Print | Disqus
TECHNICAL SCOOPCharts and commentary by David Chapman Chief Strategist, Enriched Investing Inc. Phone: 416-523-5454 Email: david@davidchapman.com dchapman@enrichedinvesting.com Twitter: @Davcha12 January 14, 2019 |
If everybody is thinking alike, then somebody isnt thinking.
General George S. Patton, U.S. Army field commander, WW2, 18851945
There are two kinds of people that lose money: those who know nothing and those who know everything.
Henry Kaufman (German-American economist b. 1927) to Robert Lenzner, Forbes magazine 10/19/98; Kaufman added, with two Nobel Prize winners in the house, Long Term Capital Management (LTCM) clearly fits the second case.
We are nowhere near a capitulation point because its at that point where it is despair, not hope, that reigns supreme, and there is scant evidence of any despair at any of the meetings I gave.
David Rosenberg, economist, Merrill Lynch in Barrons, 4/21/08; currently Chief Economist and Strategist, Gluskin Sheff.
Is the verdict in? The Santa Claus rallydefined as the last five days of the year plus the first two in Januarysaw the Dow Jones Industrials (DJI) rise 1.1%, the S&P 500 up 1.3%, and the TSX Composite gaining 0.5%. The first five days of January early warning system (83.7% accuracy) gave us a gain of 1.7% for the DJI, a 0.9% rise for the S&P 500, and a 2.0% jump for the TSX. Not bad. We await the January effect where the accuracy rate is around 75%. And, given it is also a pre-election year, the January effect in a pre-election year has an accuracy rate of 88% over the past 17 pre-election years in January. Not bad. Its going to be a bullish year. Right? But, of course, we have to add the old disclaimer that past performance may not be indicative of future results.
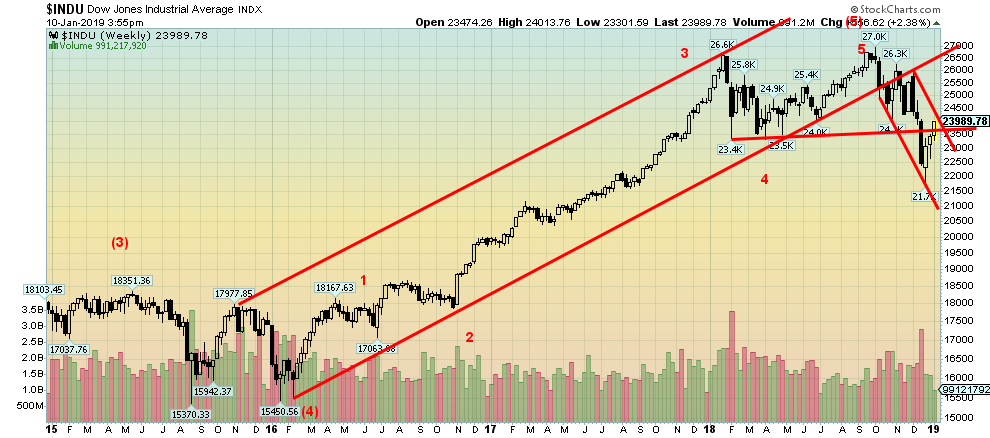
We continue to maintain this is nothing more than a bear market rally. We expect we will see many over the next couple of years. Following nine and half years of a bull market, a bear market should not be a surprise. Except many will believe this is merely a correction similar to what we saw in 2011 and 2015/2016. Those two corrections saw the DJI lose 16.8% and 14.5% respectively. A good definition of a correction. They lasted roughly five months and nine months respectively. That was below the historical 14-month average for a bear market since 1900 and, as well, it was below the 20-month bear market of 20002002 and the 17-month bear market of 20072009. (Note: bear markets are measured from the top to the bottom, bull markets the reverse).
While the final top for the markets was seen in September/October 2018, the nominal top was made in January 2018. Using that as our starting point, we are now in our twelfth month of a bear although one could argue this is only the fourth month. At its low thus far, we were down 19.4%, taking out the drop seen in both 2011 and 2015/2016. Either way, we doubt this bear is finished. We have now crawled back to the February/April 2018 breakdown point. The expectation is that this zone could act as resistance going forward. Wed have to regain above 26,000 on the DJI to suggest to us that we could be in stronger bear market rally or, argumentatively, an emerging bull market.
Otherwise, we could soon be seeing the extent of this current rebound. We call it a bull trap. A bull trap is characterised by a sudden sharp rally. Everyone thinks the bear is over and as the market rises, they come back in and may even help take it higher. But when prices turn down again it usually falls to new lows, thus trapping the bulls as they believe it is just a bull pullback. Except it isnt. The market has been far too volatile with 1,000-point up days, 600-point down days, and more. Not normal. Bull markets are quiet, steady climbers with only shallow setbacks as the period February 2016 to January 2018 shows.
There are looming danger signs for the market. Probably the most prominent is the ongoing dysfunctional dispute in the U.S. that has resulted in a partial shutdown of the U.S. government. Upwards of 800,000 workers are impacted, with many on furlough and the remainder deemed essential not being paid. A key pay date is January 15. If problems arise because people cant pay their bills, mortgages, etc., it would start to show more after that date.
Nonetheless, many have already seen a negative impact: for example, tourism, with the closing of parks, monuments, and many buildings. As well, many TSA screeners have called in sick, resulting in long line-ups at airports for security processing. More essential workers could soon find themselves sick, thus creating even more bottlenecks; for example, at border crossings. In February, funds could dry up for food stamps even as they seek a way to avoid that. The White House has estimated that a continued government shutdown could result in shaving 0.1% off the GDP every week. Some economists estimate it could be as high as 0.2% off the GDP weekly. It has been calculated that another week or so of a shutdown will cost the U.S. economy more than the cost of the wall.
However, we may not know until further on how this shutdown is really affecting the economy. With the shutdown, economic numbers that would have been published daily by various U.S. government departments have not been released. This includes economic numbers that would have been released by the Bureau of Labour Statistics (BLS), the U.S. Treasury, the Department of Commerces Bureau of Economic Analysis, and the Census Bureau. As well, we have not seen a COT report from the CFTC (Commodity Futures Trading Commission) since mid-December. Besides the CFTC, the Securities & Exchange Commission (SEC) is also partially closed, negatively impacting mergers, IPOs, and other securities-related approvals. By Monday, January 14, 2019, the shutdown will have entered its 24rd day, making it the longest shutdown ever.
While the shutdown has become the most visible potential negative impact on the economy, it is not the one that should cause the most worry. Yes, debt is the elephant in the room. Were looking at some $250 trillion in global debt, up almost $100 trillion from 2008 when the financial world went through its last crisis. Since the world was taken off the gold standard in 1971, global debt has exploded. We have also been hit with a financial crisis roughly every five years since (corresponding well with the four and six and half year cycles)1973/1974, 1980/1982, 1987, 1990, 1994, 1998, 2000/2002, and 2007/2008. We are overdue for the next one and the pressure has been building.
One place to watch is junk bonds. The announcement that S&P and Moodys have cut Pacific Gas & Electric Corps (PG&E) credit rating to junk should be of bigger concern. PG&E is the giant Californian utility. It seems the wildfires have not only been a political, personal, and economic calamity but are negatively impacting companies too. PG&Es drop from investment grade forces funds that can only hold investment grade bonds to dump themmost likely at fire sale prices.
Source: www.bloomberg.com
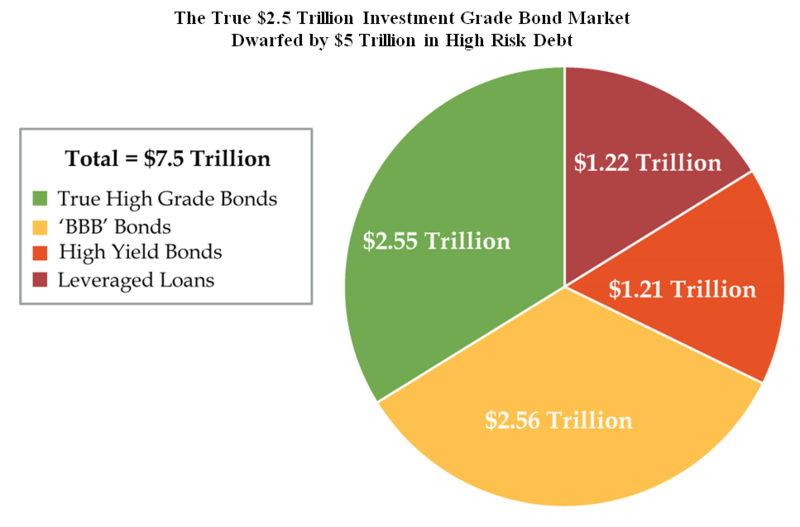
This chart should cause concern. Corporate debt in the U.S. has soared, more than doubling since 2008. Because of ultra-low interest rates, much of the debt was taken on by lower-grade corporations. As the chart shows, the high-grade bond market of $2.55 trillion is dwarfed by high-risk debt totalling almost $5 trillion. It would not take a lot of downgrades from BBB ratings to tip them into the high-yield bonds category (aka junk bonds), forcing the liquidation of potentially billions of bonds currently held by funds. BBB bonds are lowest rated investment grade. Leveraged loans are already high yield and very high-risk debt, as it is where companies go when they cant even get access to the high-yield debt market.
But the corporate bond market of the U.S. is merely one concern. U.S. student loan debt has also more than doubled since 2008 to $1.6 trillion. The delinquency rates are rising. Auto loans that have also almost doubled since 2008 have seen considerable collateralization, similar to the sub-prime mortgage market that collapsed in 2008. Delinquency rates are rising sharply there. Add in the mortgage market in the U.S. as the housing market falters and there is potential for a growing financial crisis.
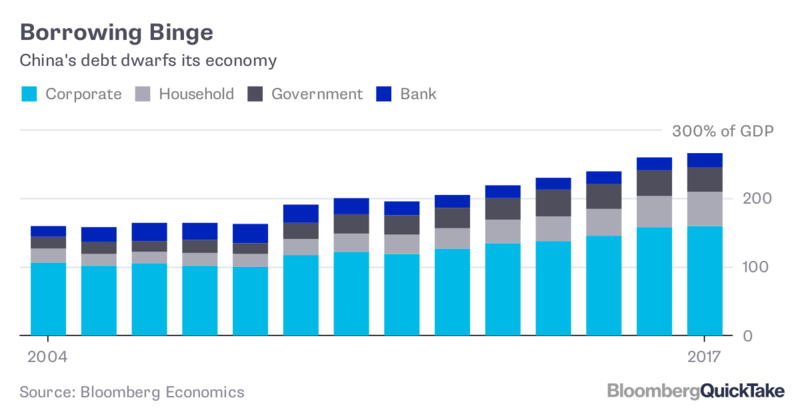
A housing slowdown is not limited to the U.S. Housing prices are faltering globallyin Australia, Canada, the EU, and particularly in Britain where the London housing market is threatening to collapse because of Brexit. And then there is China. China went on a borrowing binge over the past decade and much of it was to real estate companies on a building binge. The trouble is, many of the buildings and even cities that were built sit empty and the Chinese real estate giants and the Shadow Banking system behind them are teetering. It is estimated there are some 65 million empty apartments in China. There are also many empty commercial buildings. Much of the debt was borrowed in U.S. dollars as was emerging market debt. As their currencies weaken and interest rates rise, the debt owed also rises.
But it is Chinas $34 trillion of debt that should cause sleepless nights. Its debt has been called a monster, a horror movie, a bomb, and a treadmill to hell. Chinas borrowings have quadrupled since 2008. Of the $34 trillion, only about $5 trillion is government debt. Chinas government debt, unlike the U.S.s government debt, is not the problem. The chart below shows the growth as a percentage of GDP. As the Chinese economy slows the debt becomes a problem.
Source: www.bloomberg.com
It was a comparable debt binge by Japan in the 1980s that led to the 1990 financial collapse of the Japanese stock market and economy, a collapse that drags on to this day. Could the same thing happen in China? Last year Chinas Shenzhen Composite led stock markets down losing 33.9%. In its favour are a high savings rate and a massive current account surplus. But Japan had that going for it as well in 1990. No matter what, the credit growth cycle is grinding to an end and that spells trouble ahead. China and the U.S. together have total debt of $106 trillion, representing 42% of all global debt outstanding. And the two of them are locked in a trade war that could, if not resolved, have devastating effects on both of them.
And, if potential trouble in North America and China isnt enough, there is the EU. The EU and the Euro zone appear to be headed to a recession. Reporting negative 2018 Q3 growth were Austria, Italy, Sweden, Switzerland, and Germany. Despite Brexit, Britain seemed to holding on. The entire Euro area grew by only about 0.6% in Q3. As Q4 numbers come out, the signs are not good and France and Spain could soon be joining the others. Germany appears poised for an official recession of two consecutive quarters of negative growth. Germany is supposed to be the engine of the Euro zone. Germany has been hit with a massive slowdown in its auto sector (and here in North America as well; i.e., GMs shuttering of plants), while France is being paralyzed by the Yellow Vests riots, resulting in a collapsing tourist industry and shuttered businesses. Italy is at war with the EU itself.
All of this is a big problem for the ECB that was trying to wind down quantitative easing (QE) and normalize interest rates. How can it wind it down when it could be facing another financial crisis? Problems with Italian, Greek, Spanish, and Portuguese banks are well known. And there is Deutsche Bank, whose loan and derivative portfolios are considered by many to be a time bomb waiting to explode. Deutsche Bank is the worlds 15th largest bank. A collapse of Deutsche Bank would make the Lehman Brothers collapse look puny.
Add in Japan who also reported negative Q3 growth and you have the growing potential for a global recession against the backdrop of a monstrous mountain of debt. A Black Swan event like a Lehman Brothers could spiral the world into a financial collapse of considerable proportions. And the central banks, unlike 2008, are in no position to bail the world out again. Thats the prime reason the major economies passed bail-in legislation so that bank debt, including deposits, could be converted to equity in the event of another collapse.
Some events over the next month need to be watched closely. First up is the World Economic Forum in Davos, Switzerland on January 2225. While Trump is due to go, he has indicated he wont because of the shutdown. If he does go, he could wind up being a negative lightning rod. In Britain, the vote for Theresa Mays Brexit deal takes place on January 15. Thats only about 3 months before the U.K. is set to leave the EU. Her deal faces certain defeat and could trigger the collapse of her government and a disorderly exit from the EU.
The Fed FOMC meets January 2830. While no rate hike is expected, everyone will be listening closely for clues as to their intentions at later meetings. Given market gyrations, will they soften their stance towards further interest rate hikes? Expect more attacks from Trump against Fed Chair Jerome Powell. The market finds those attacks disconcerting. Finally, former Trump lawyer Michael Cohen is due to testify to Congresss House Oversight Committee. His testimony could be explosive, a problem for Trump and even Mueller. Muellers report is also expected sometime over the next month. Any of these events could spark market gyrations and volatility.
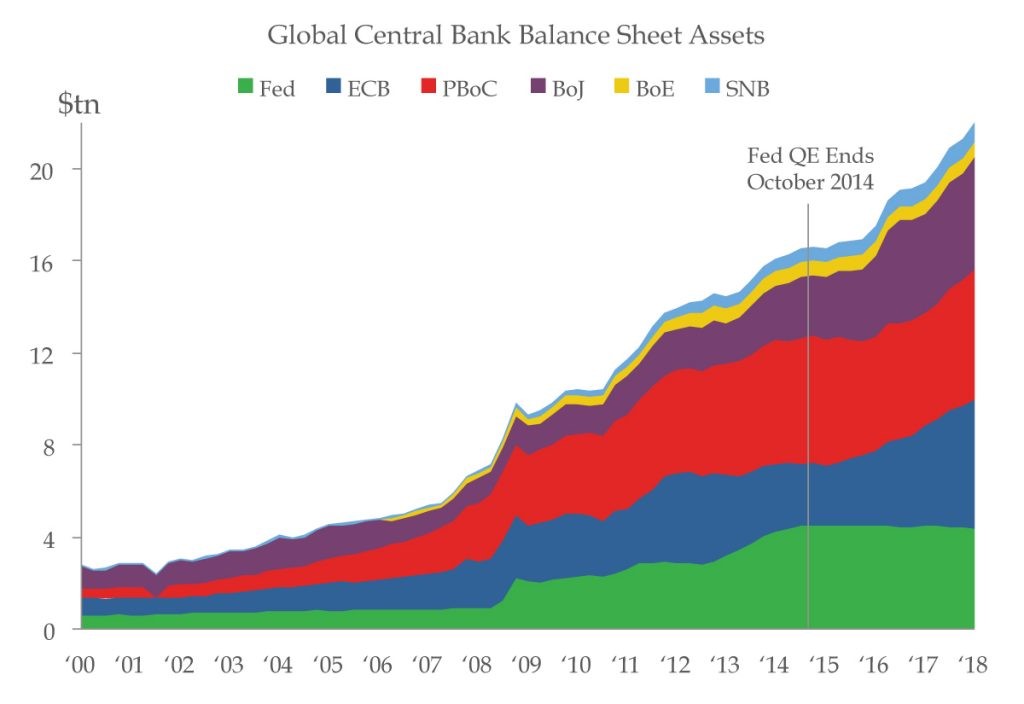
The balance sheets of the major central banks have exploded from roughly $8.5 trillion in 2008 to over $21 trillion today. (See the chart below which includes the Fed, ECB, BOJ, BOE, SNB, and PBOC). While the Fed has largely flatlined and declined since 2014, others led by the ECB, the BOJ, and PBOC have grown further. The Fed is trying to reduce the size of its balance sheet by rolling off through maturities $30 billion of U.S. Treasuries and $20 billion of MBSs every month. It is noted that the Feds SOMA holdings have declined in value because of rising interest rates, causing the Fed to carry a paper loss of $66.5 billion. The Feds capital totals only about $43 billion. The Feds balance sheet is about $4.1 trillion, of which $1.6 trillion is MBSs.
One of Wall Streets biggest bears is predicting that the global economy is headed for a recession later in 2019. David Rosenberg is the Chief Economist of Gluskin Sheff. Mr. Rosenberg has cited the collapsing stock markets as a clue that all is not well. Add in trade wars, rising interest rates, QT, dysfunctional governments, along with the rise of populism and alt-right governments and parties on a level not seen since the 1930s and the potential is there for a recession of considerable proportions. Naturally, there are many who believe it will not happen. And maybe it wont. Just that the odds are not looking good. Under all these circumstances gold, the safe haven of last resort, has only one place to go and that is up.
Source: www.lionscrestcapital.com
MARKETS AND TRENDS
| | | % Gains (Losses) Trends |
| Close Dec 31/18 | Close Jan 11/19 | Week | YTD | Daily (Short Term) | Weekly (Intermediate) | Monthly (Long Term) | |
Stock Market Indices | | | | | | | | |
S&P 500 | 2,506.85 | 2,596.26 | 2.5% | 3.6% | neutral | down | up (weak topping) | |
Dow Jones Industrials | 23,327.46 | 23,995.95 | 2.4% | 2.9% | neutral | down | up (topping) | |
Dow Jones Transports | 9,170.40 | 9,625.25 | 4.3% | 5.0% | down (weak) | down | neutral | |
NASDAQ | 6,635.28 | 6,971.48 | 3.5% | 5.1% | neutral | down | up (weak topping) | |
S&P/TSX Composite | 14,322.86 | 14,939.18 | 3.6% | 4.3% | up (weak) | down | down (weak) | |
S&P/TSX Venture (CDNX) | 557.20 | 601.77 | 2.4% | 8.0% | up | down | down | |
Russell 2000 | 1,348.56 | 1,447.38 | 4.8% | 7.3% | neutral | down | neutral | |
MSCI World Index | 1,710.88 | 1,782.12 | 3.0% | 4.2% | up (weak) | down | down (weak) | |
NYSE Bitcoin Index | 3,769.99 | 3,746.61 | (2.8)% | (3.4)% | down | down | down | |
| | | | | | | | |
Gold Mining Stock Indices | | | | | | | | |
Gold Bugs Index (HUI) | 160.58 | 159.40 | (1.8)% | (0.7)% | up | neutral | down | |
TSX Gold Index (TGD) | 186.74 | 179.33 | (2.2)% | (4.0)% | up | up (weak) | down (weak) | |
| | | | | | | | |
Fixed Income Yields/Spreads | | | | | | | | |
U.S. 10-Year Treasury yield | 2.69 | 2.71 | 1.5% | 0.7% | | | | |
Cdn. 10-Year Bond yield | 1.96 | 1.96 | 2.6% | flat | | | | |
Recession Watch Spreads | | | | | | | | |
U.S. 2-year 10-year Treasury spread | 0.21 | 0.16 | (5.9)% | (23.8)% | | | | |
Cdn 2-year 10-year CGB spread | 0.10 | 0.07 | flat | (30.0)% | | | | |
| | | | | | | | |
Currencies | | | | | | | | |
US$ Index | 95.73 | 95.27 | (0.5)% | (0.5)% | down | neutral | neutral | |
Canadian $ | 0.7350 | 0.7550 | 0.9% | 2.7% | up | down | down | |
Euro | 114.58 | 114.66 | 0.6% | 0.1% | up | down | neutral | |
British Pound | 127.50 | 128.46 | 0.9% | 0.8% | up | down | down | |
Japanese Yen | 91.24 | 92.14 | (0.1)% | 1.0% | up | up | up | |
| | | | | | | | |
Precious Metals | | | | | | | | |
Gold | 1,281.30 | 1,289.50 | 0.3% | 0.6% | up | up | up (weak) | |
Silver | 15.54 | 15.66 | (0.8)% | 0.8% | up | neutral | down (weak) | |
Platinum | 795.90 | 818.00 | (0.5)% | 2.8% | neutral | down (weak) | down | |
| | | | | | | | |
Base Metals | | | | | | | | |
Palladium | 1,197.20 | 1,278.70 (new highs) | 3.6% | 6.8% | up | up | up | |
Copper | 2.63 | 2.66 | 0.4% | 1.1% | down | down | neutral | |
| | | | | | | | |
Energy | | | | | | | | |
WTI Oil | 45.41 | 51.59 | 7.6% | 13.6% | up (weak) | down | down (weak) | |
Natural Gas | 2.94 | 3.10 | 2.0% | 5.4% | down | neutral | up (weak) | |
Source: www.stockcharts.com, David Chapman
Note: For an explanation of the trends, see the glossary at the end of this article.
New highs/lows refer to new 52-week highs/lows.
Source: www.stockcharts.com
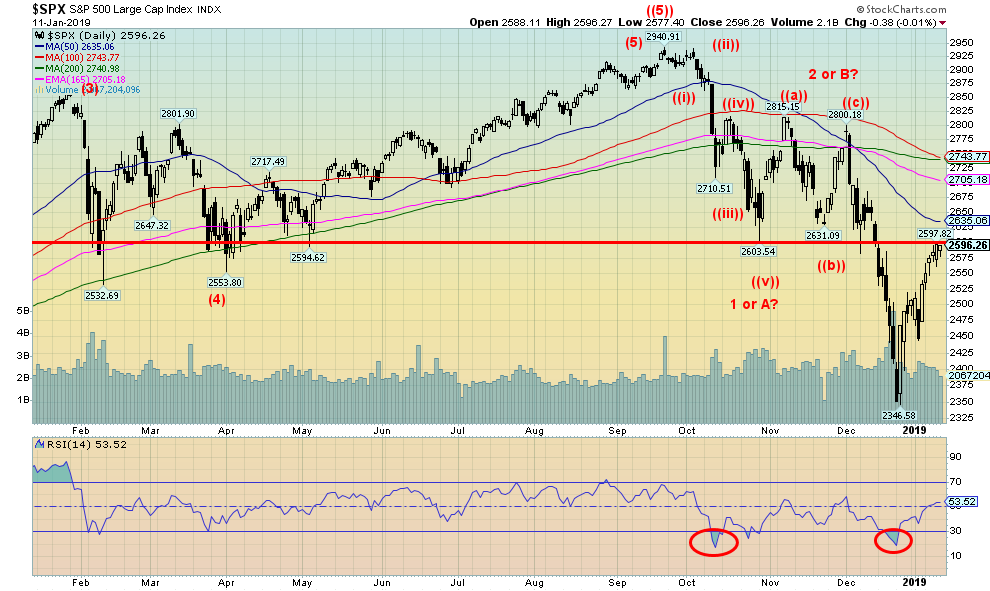
The rebound rally that got underway on Boxing Day December 26 is losing momentum. Volumes, which have been below average are weakening as the index moves higher. The daily ranges are also getting smaller. The S&P 500 is into the range of the breakdown zone from the February/April 2018 lows. The 50-day MA is just above at 2,635. Unlike some of the other indices, not all of the key MAs have broken under the 200-day MA. The 100-day MA is still above, but barely. If the S&P 500 is to push higher, not only do we need to take out 2,650 but we need to break out above 2,750. At that level further advances could be seen. We cant help but notice widening credit spreads in the corporate bond market (we discuss further below with junk bonds). That usually spells trouble and if there is trouble in the credit markets then the equity markets are unlikely to rally. Still, there might still be more upward thrust before this market fully runs out of steam. The RSI is still only at 63.50 so it could rise further before it is into overbought territory (above 70). We suspect there has been selling into this rally. It is not unusual for the market to rebound back to its previous breakdown zone or slightly higher before it turns tail and resumes the bear. A break below 2,450 would most likely signal new lows ahead.
Bear markets are, however, twists and turns. With the Fed softening its stance we could see this rally extend further. We are reminded that in 2007 we saw a top in October followed by a sharp decline into January. The Fed at the time softened its stance and provided liquidity to the market. The result was a market that almost got back to the previous highs before topping in May 2008. A softening Fed now coupled with seeming peace on the trade front and no major bombshells from Cohen or Mueller followed by a resolution over the wall and we could easily see a rally that takes us back towards the September/October highs. If that were to happen then we might be able to say that the December low was our four-year cycle low (range 3-5 years the last one being in August 2015). What then would follow is the 6.5-year cycle low that isnt due until around 2020. A move above 2,750 would help the bullish case. A further run now to the upside would help set the bull trap.
Source: www.stockcharts.com
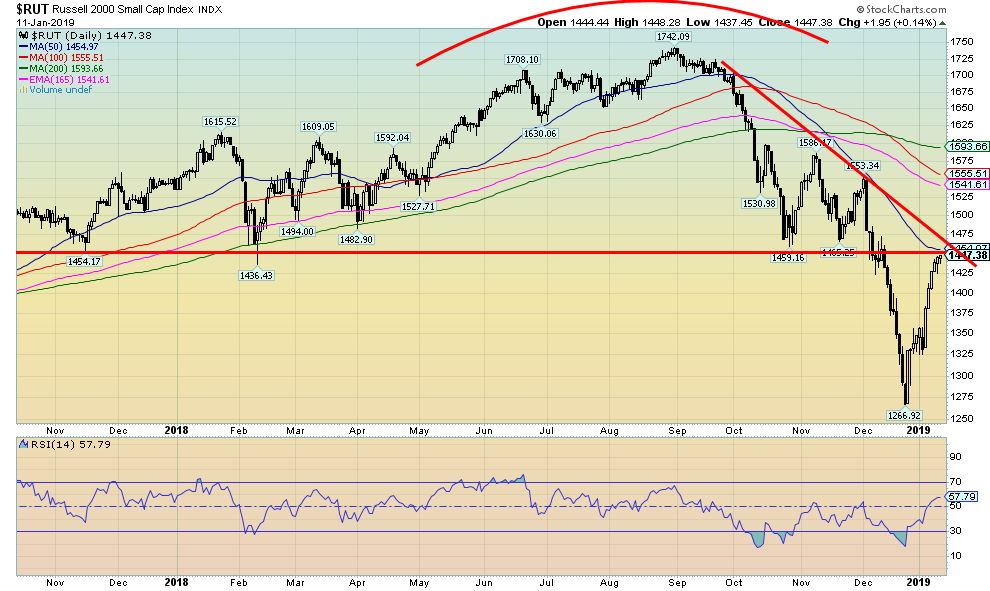
The Russell 2000 small cap Index has recovered to the February 2018 breakdown zone and the 50-day MA. As with the large cap stocks, the rebound has been almost straight up with little or no break and volumes have been below par. But it has successfully worked off oversold levels. The key MAs 50, 100 and the 165 EMA have all broken down under the 200-day MA. It is the classic death cross. The key is on any rebound can it pull the MAs back over the 200-day MA? In 2008 they tested the 200-day MA but did not cross back to the upside. In both 2011 and 2016 the MAs crossed back over to the upside. The current rebound has been impressive. But it is already losing momentum and nothing goes straight up.
Source: www.stockcharts.com
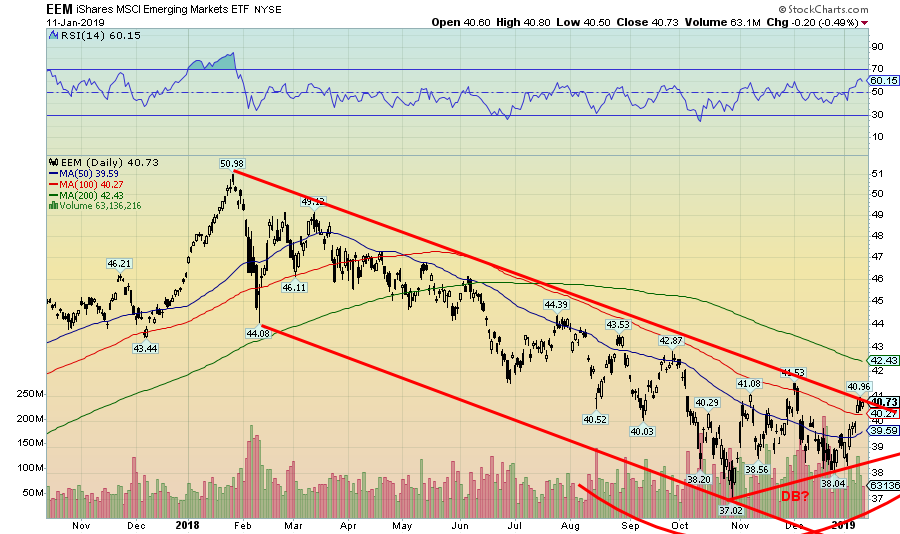
Is there some hope here? Thanks to Bob and Joseph for sending this along. Could the emerging markets be sending us a signal that a better rebound lies ahead? The iShares MSCI Emerging Market ETF (EEM) appears to be making a double bottom. It breaks out above $41, a level it is very close to. Technically, a breakout could project up to around $47. Well keep an eye on this one as it may be an early clue to potential rebound in North American markets as wellsurprising, as emerging market shares would be considered highly speculative compared to, say, the S&P 500 stocks. Note the EEM never recovered from the January/February breakdown. It was leading the market at that time as well.
Source: www.stockcharts.com
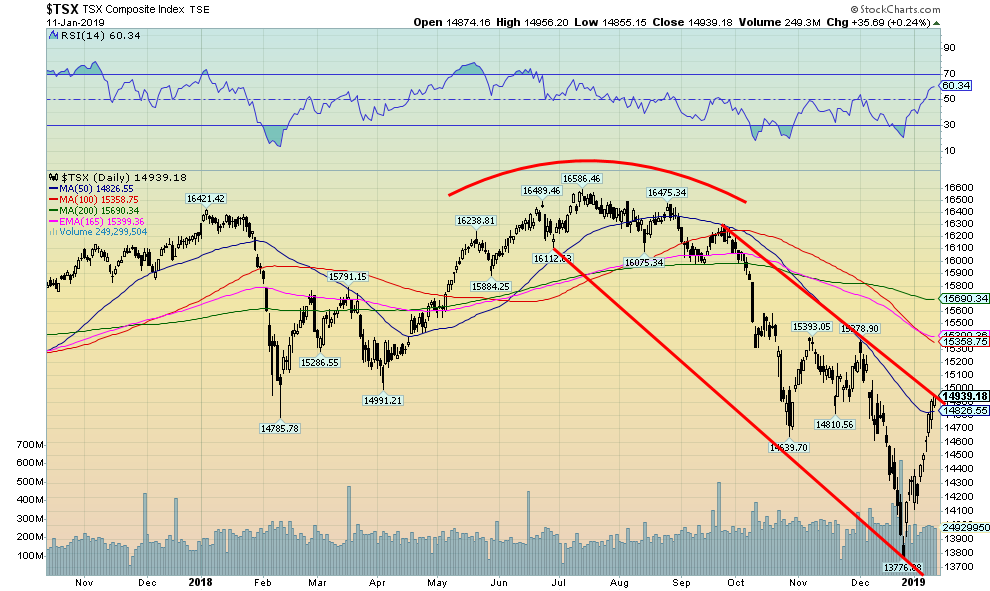
The TSX Composite is at important resistance here, meeting the downtrend line from the September high. It is also at the 50-day MA. Given the below-average volume on this rebound, we would not be surprised to see the TSX fail here. All the key MAs have broken below the 200-day MA. This is known as the death cross. Usually when it crosses it takes quite a while for it start to turn up again. The current rebound has barely made these MAs budge from their downtrend. Expect failure, although individual sub-indices could outperform. As a side note, the TSX Venture Exchange (CDNX) has rallied hard since the beginning of the year on increased volume. This is a positive development as the junior small cap index has been under considerable downward pressure over the past year. Over 50% of the index is made up of junior mining stocks, mostly gold. We have noted a number of junior gold miner exploration stocks that have already doubled off their lows.
Source: www.stockcharts.com
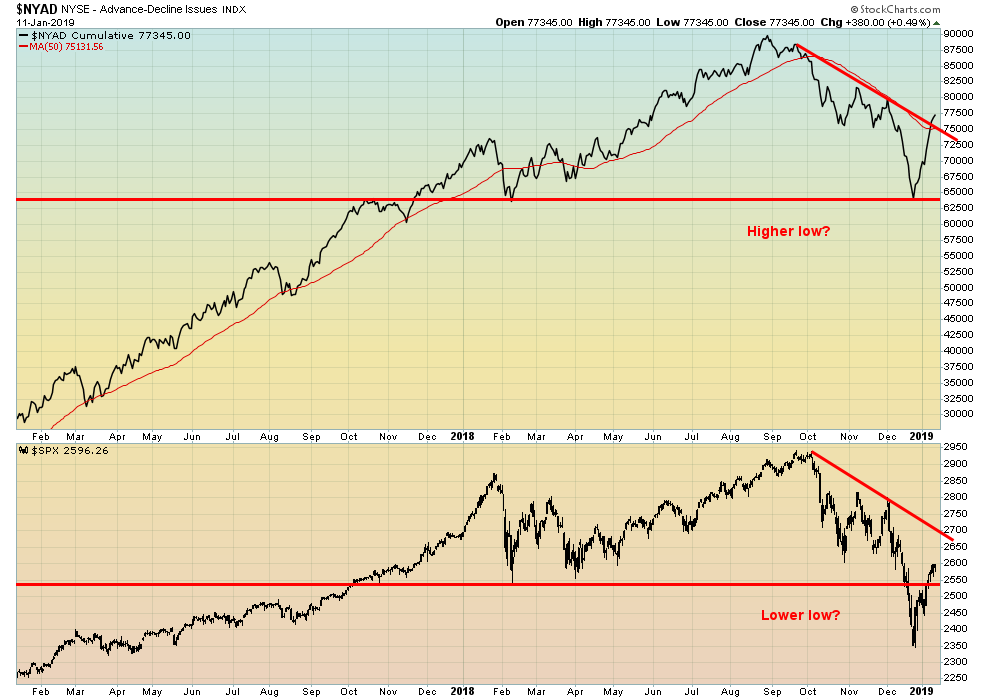
The NYSE advance decline line did not make a new low with the S&P 500. This was a divergence worth noting. The result has been both the S&P 500 and the NYSE advance decline line have rebounded back from their lows. Both are now at resistance levels although the NYSE advance decline line appears to have broken out. If the S&P 500 can continue its rally the breakout would be legitimate. The S&P 500 has resistance up around 2,700.
Source: www.stockcharts.com
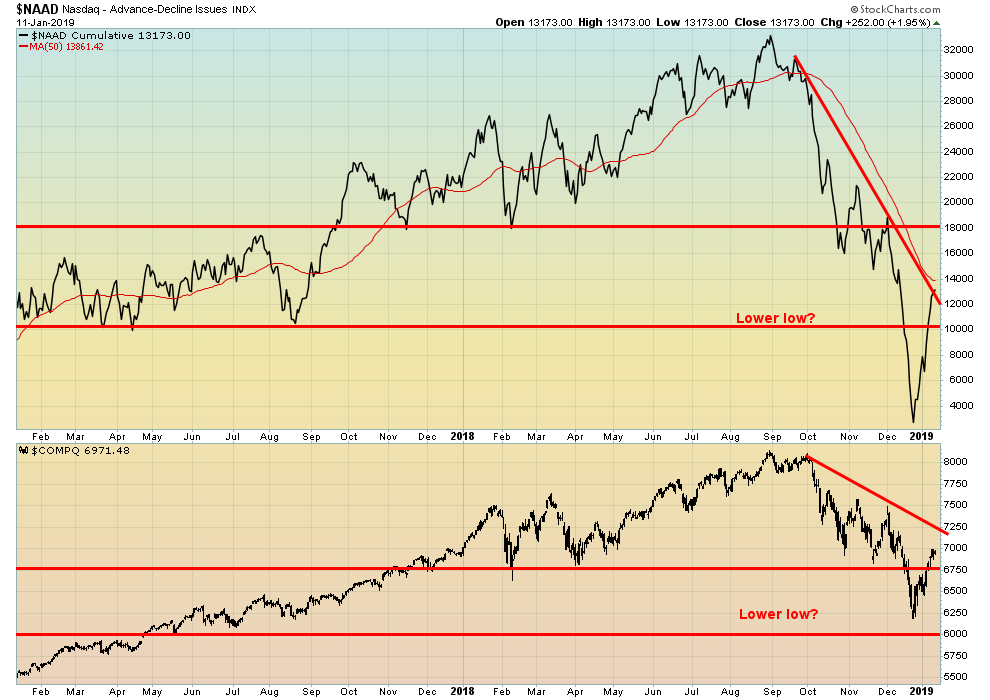
While the NYSE advance decline line diverged with the S&P 500 the NASDAQ advance decline line did not diverge with the NASDAQ. Well, it did, but this time it was the advance decline that made considerably lower lowsnot only below lows seen in February 2018 but also under lows seen in August 2017. The NASDAQ broke under the February 2018 lows but never broke under the August 2017 lows, a low that was actually a higher low the one in June 2017. No divergence here. If anything, the NASDAQ advance decline diverged with the NYSE advance decline line. One of them is wrong. The question is: which one? We give more credence to the NASDAQ advance decline line telling us the real state of affairs. Following a rebound, this market is likely to go lower again.
Source: www.stockcharts.com
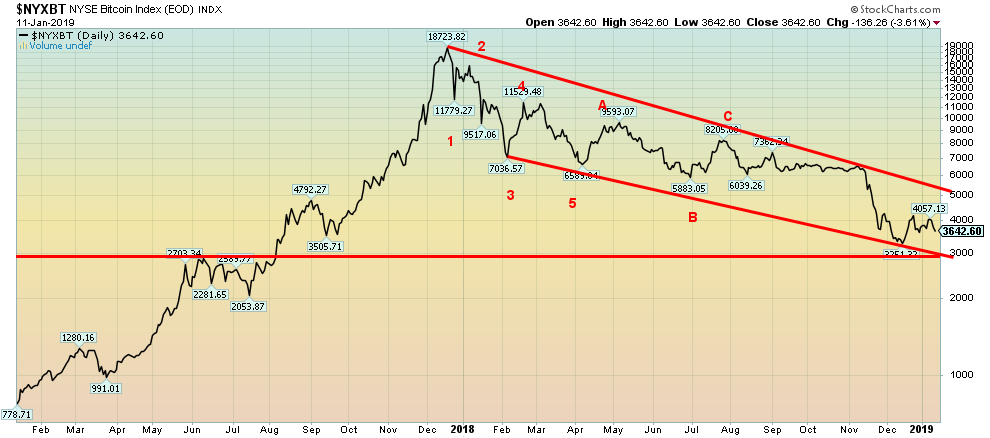
No, no we havent forgotten about Bitcoin. We are just not going to feature it any longer. Bitcoin remains firmly locked in a downtrend that shows no sign of ending. There is channel support down to $3,000, but a breakdown under that level could soon send Bitcoin to $2,500 and even down to $2,000. For now, the bear channel looks good. Note Bitcoin has been descending in a series of lower highs and ultimately lower lowsthe very definition of a downtrend. Bitcoin is down over 80% from its bubble high back in December 2017. Many other cryptos are down 90% or more from their highs. The market cap of all cryptos is now only $122.1 billion. At its peak Bitcoins market cap was at least $324 billion. There remain only 11 cryptos with a market cap over $1 billion. Bitcoin makes up 52% of the market cap of all the cryptos. We wonder why so many exist. Maybe this market will revive itself some day in the future. But not right now. Cryptos are yesterdays news. As a percentage of all assets, cryptos barely even rate now.
Source: www.stockcharts.com
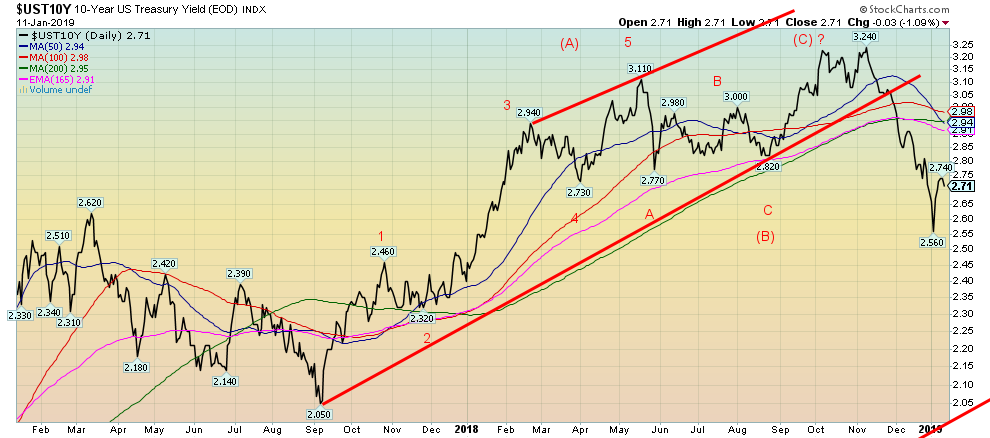
The U.S. 10-year Treasury note appears to have hit at least a temporary low at 2.56%, rebounding back up to 2.71%. Fed Chair Jerome Powell spoke this past week and he appears to be softening his stance somewhat. Could it be that Trumps rants are getting to him? The wording is now further gradual increases. In trying to interpret Fed-speak, one is led to believe that they are at or very near the end of their hiking. Traders are expecting maybe one or two more hikes this year as opposed to the three that were indicated last year. Powell noted the volatility in financial markets and the increased concerns about global growth. In conclusion, the Committee (the FOMC) could afford to be patient about further policy firming. Rates, it seems, are already close to neutral. The latest inflation numbers (core) have slipped back under 2%. All of the Fed Presidents appear to be singing from the same hymn book. The question now is: has the Fed hiked too much too fast (they started in December 2015)? The 10-year appears to have topped at 3.24%. It has been a firm breakdown. The yield curve is narrowing but remains above zerofor now, anyway.
Recession Watch Spread
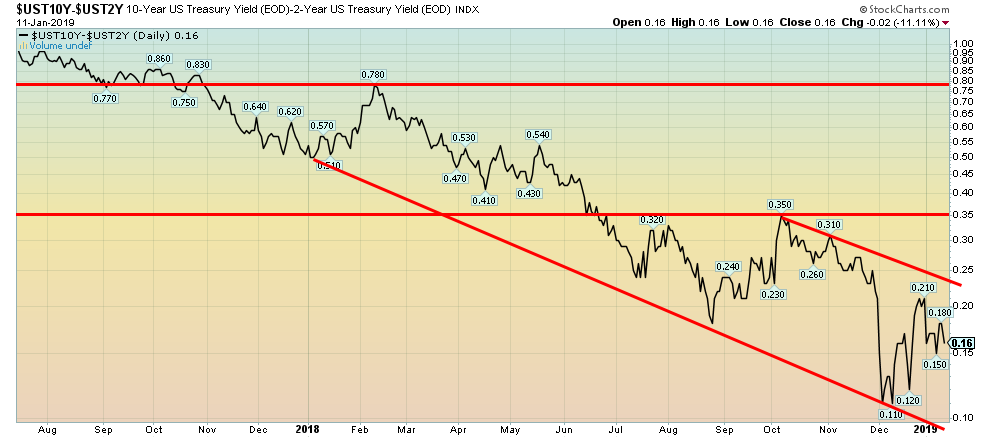
Source: www.stockcharts.com
The recession watch spread 10-year U.S. Treasury note less the 2-year U.S. Treasury note (known as the 210 spread) is currently at 16 bp. It is above the recent low at 11 bp but below levels seen a week earlier at 21 bp. The 210 spread is not yet reflecting the potential for a recession but it continues to work its way down. Past recessions have been preceded by the 2 10 spread turning negative and holding negative for upwards of six months. The spread was as high as 78 bp only about a year ago.
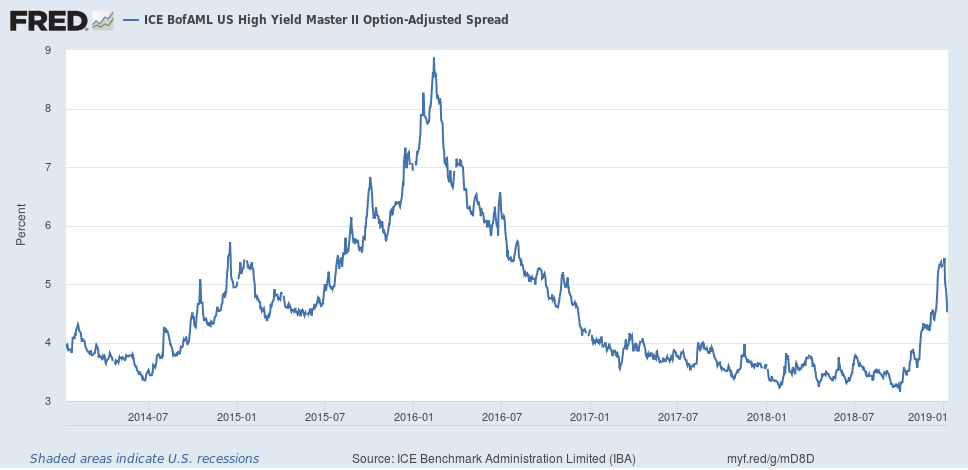
Source: www.stlouisfed.org
This is a spread that bears watching. Despite the name, it is really the spread between U.S. Treasuries and high-yield bonds (aka junk bonds). The spread has recently widened out to its highest level since 2016. At that time the spread jumped to almost 800 bp over U.S. Treasuries. The peak was seen in 2008 at the height of the financial crisis when the spread leaped to almost 2,000 bp over U.S. Treasuries. Currently, at 454 bp over, the spread has widened from the lows that persisted through 2017 and 2018. No more. Junk bonds are becoming more dangerous and the widening spread reflects that concern. It has pulled back recently with the easing of tensions over the past few weeks, but we dont expect it to last.
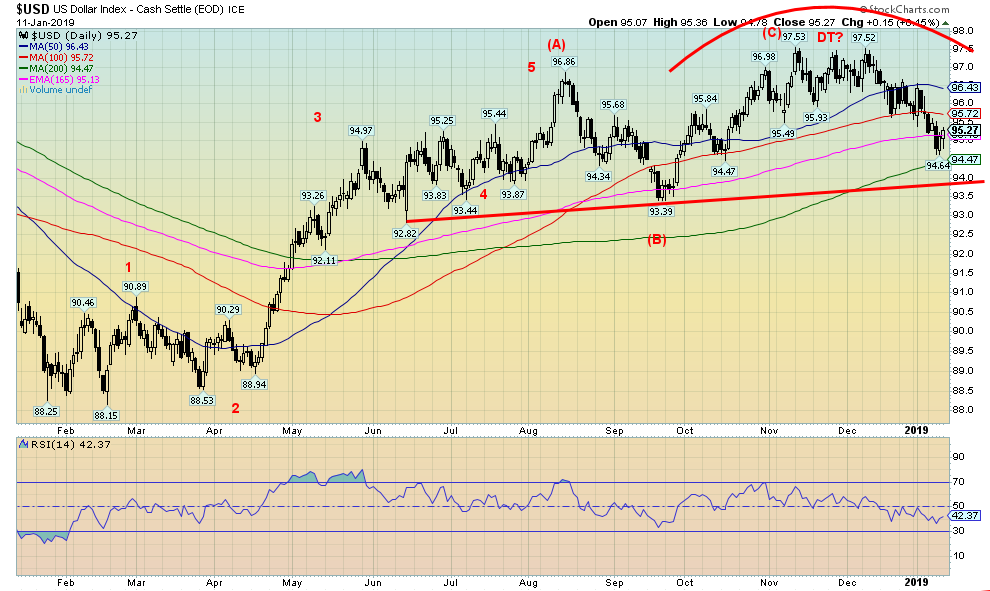
Source: www.stockcharts.com
The US$ Index appears to now have made its top. With the Fed talking concern for the economy and thoughts that they might not hike rates more than twice in 2019, the U.S. dollar has weakened against major currencies. This past week the US$ Index lost 0.5% while the euro was up 0.6%. The Canadian dollar was up 0.9% and the British pound, despite Brexit woes, was up 0.9%. Only the yen was off and that was for less than 0.1%. Trumps shutdown of the government is also not helping the U.S. dollar. The US$ index has support down to around 94, but below that level a significant breakdown could get underway. Initial objectives would be down to around 90. Only a break above 96.50 would give us cause for concern. Above 97 new highs would be possible.
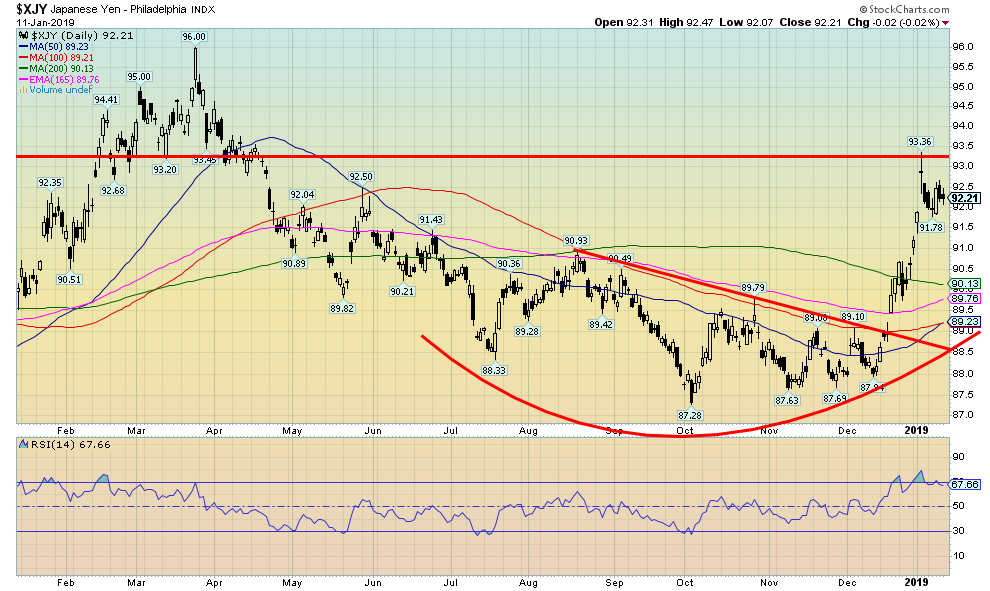
Source: www.stockcharts.com
A stronger Japanese yen of late suggests to us that Japanese investors (read funds) are becoming nervous about the North American stock markets and are pulling funds out to repatriate to Japan. If this is correct that is one of the prime reasons that the yen has exhibited strength of late. The yen appears to have broken out of a wedge pattern and projects up to 93.65. The recent high was at 93.36 so it may have fulfilled that objective. If the yen is to remain bullish it should now form a bull flag or pennant before moving higher once again. Only below 90 would we consider this rally over.
Source: www.stockcharts.com
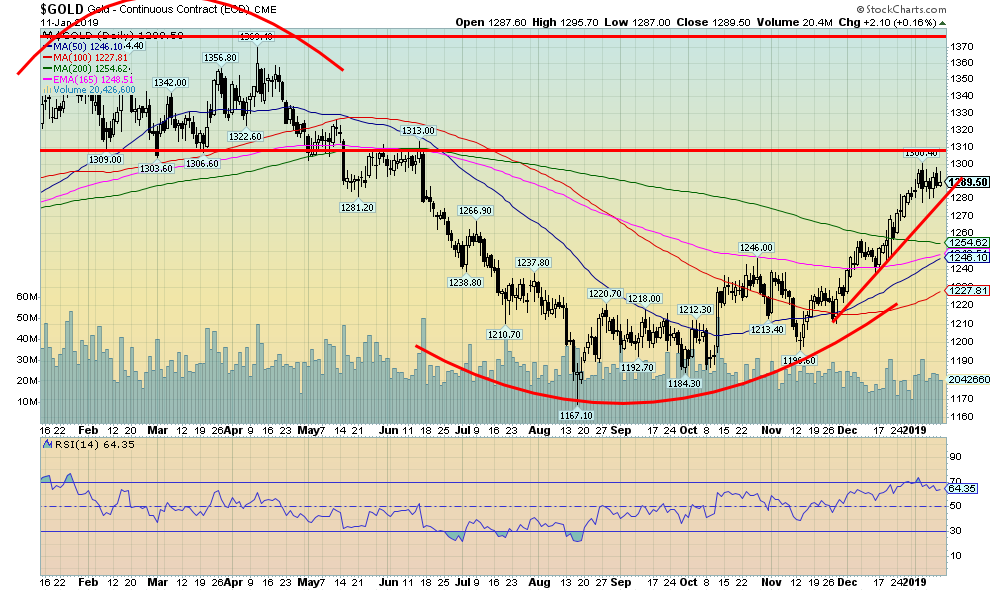
Gold prices eked out a 0.3% gain this past week continuing their run of up moves. Silver lost 0.8% and platinum continues to struggle as it was down 0.5%. Palladium, on the other hand, continues to soar up a solid 3.6% on the week and now up 6.8% since the beginning of the year. Palladium prices have been making new all-time highs. Those interested in holding a palladium-based stock can look at North American Palladium (PDL-TSX), North Americas primary Platinum Group Metals stock. PDL is noted as the only pure palladium producer in mining.
For gold, there was a barrier at $1,300 so it was no surprise that it pulled back at that level. The consolidation appears to be positive and is forming what appears a bull flag. Support is seen down to $1,280 and even stronger support down to $1,260. A break above $1,300 could send gold into the next level with a run towards $1,350. At that level and up to $1,370 one would expect another pullback/correction. Ultimately, we believe we will plow through resistance at $1,370 and move above $1,400 towards $1,500. Conditions are perfect for gold with signs of slowing in the euro zone, Japan, and ultimately North America too. Dysfunctional politics also help. There are also signs that the Fed may be wavering on further interest rate hikes. All of this would be positive for gold as a traditional safe haven and an asset with no liability.
Source: www.stockcharts.com
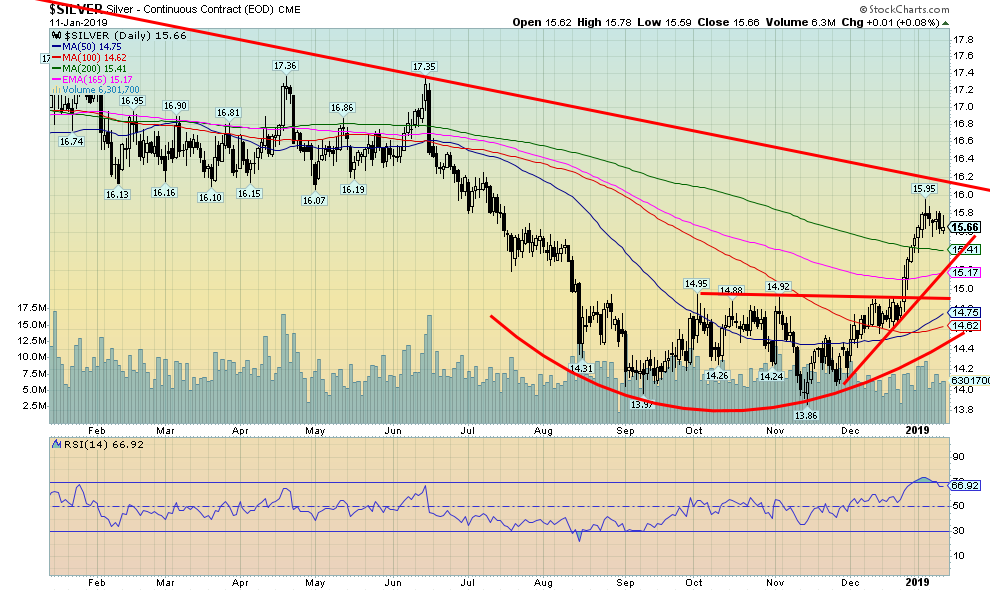
Silver has successfully broken out above its 200-day MA. The key now is it must hold this level to tell us we are going to move higher above $16. We appear to have successfully broken out of a bottom pattern. We are now up 16.5% from the November low. The November low was itself a possible double bottom on the silver charts. The big breakout comes above $16.50. A break above $16/$16.10 would break the down trend line from the 2011 top. The potential double bottom on the charts projects up to around $24. We have support at $15.40 and then down to $15.10/$15.20. The chart continues to look bullish and once this pullback is complete, we should soon break above $16.
Source: www.stockcharts.com
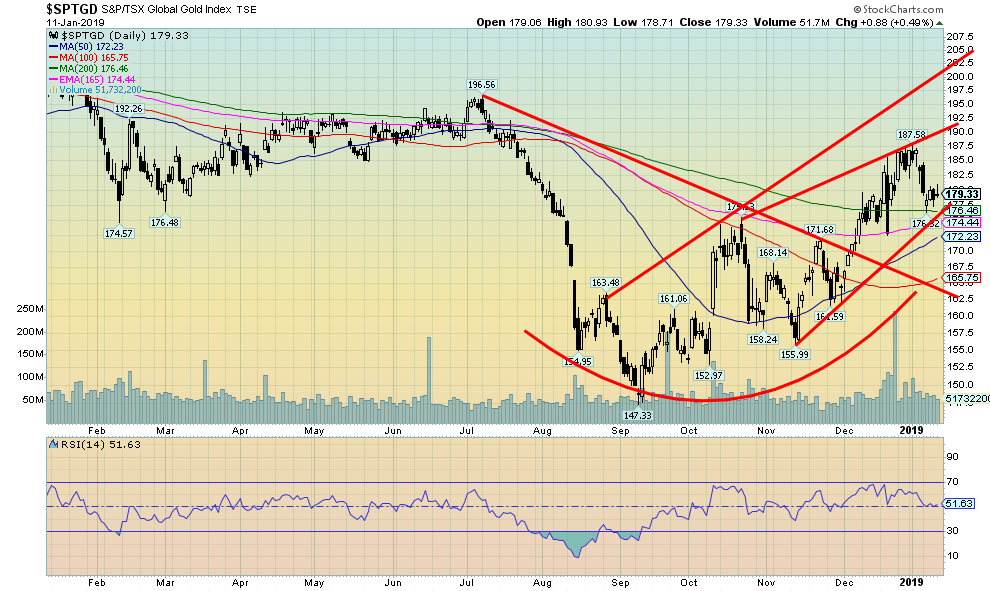
The TSX Gold Index (TGD) pulled back this past week, continuing a correction that started with the New Year. The TGD was down 2.2% on the week while the Gold Bugs Index (HUI) lost 1.8%. Nonetheless, the TGD is up 21.8% from its lows seen in September 2018. Thats the good news. The bad news is the TGD remains down 37% from peaks seen in July 2016 and down 61% from its all-time high set back in September 2011. Well look at the positive side of this. The TGD has broken out above its 200-day MA and the recent pullback appears to be holding that level. A breakout over 190 would send the index up to 200 next. The TGD appears to be forming a good uptrend, punctuated with a rise followed by a pullback then a rise again to new highs. This type of choppy action is actually quite positive. As long as we dont break any prior low on the downside. Under 174 might be of concern. Under 165 the TGD would be returning to a bear.
Source: www.stockcharts.com
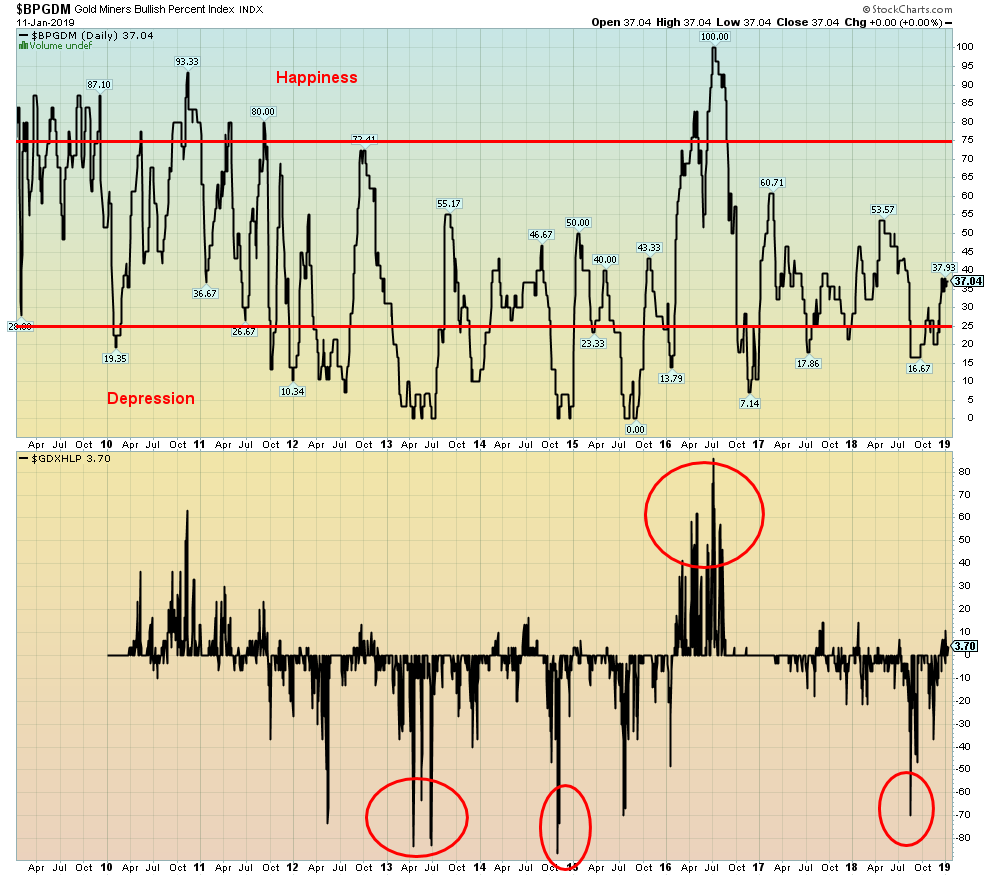
The chart shows two sentiment indicators for the gold stocks. The top chart is the Gold Miners Bullish Percentage Index. We have divided it into a zone of happiness and a zone of depression. In between is the bliss zone. When the index is in the happiness zone a top may be forming. Conversely, when the index is in the depression zone a buying opportunity is most likely at hand. The recent improvement for the gold stocks has moved the index into the bliss zone. The index is still pretty low so it has considerable room to move higher before entering the happiness zone. Two earlier attempts failed before entering the happiness zone. If the current up move takes out those two previous highs than odds favour a run into the happiness zone.
The lower chart shows the Gold Miners New Highs New Lows Percent index. Again, this index has improved and is now over zero. But it is nowhere near levels seen in 2016 when gold and the gold stocks put in quite a run to the upside. Again, this index has room to move higher. Both are supportive of higher prices for the gold stocks.
Source: www.stockcharts.com
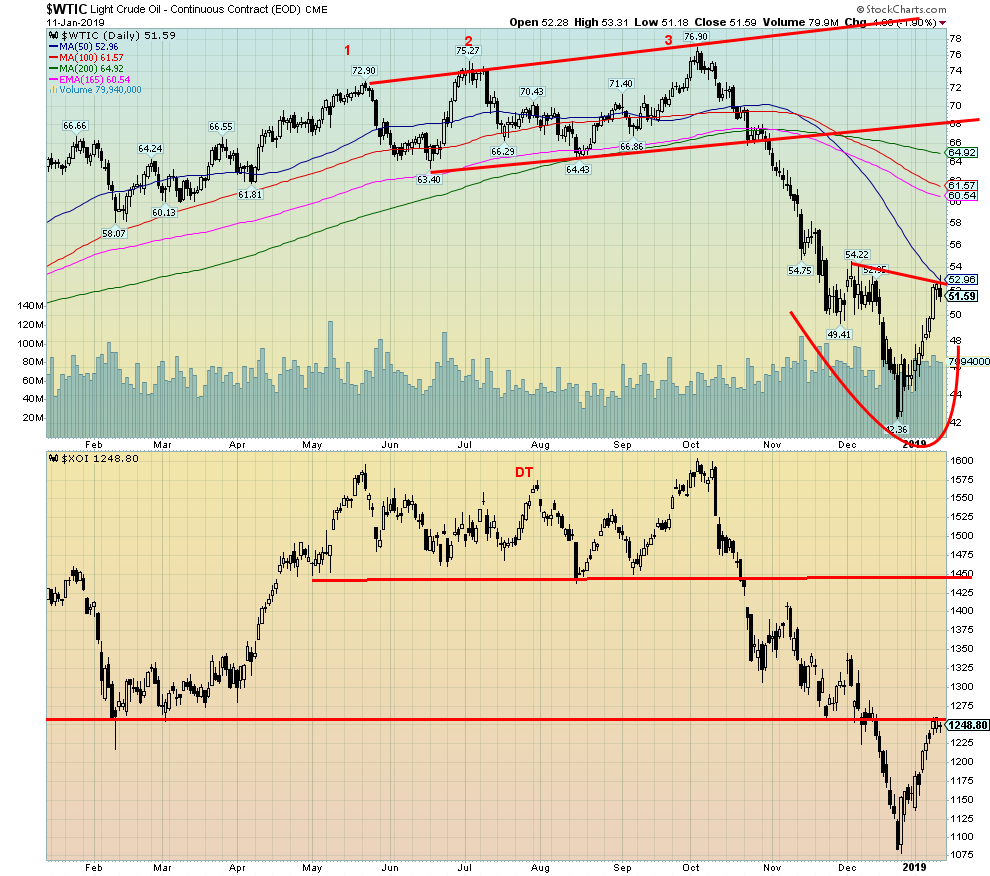
Both oil and the energy stocks have had a nice run over the past few weeks. Oil prices have been helped with positive talk on the trade front between the U.S. and China as well as production cuts. Funny how these things happen just in time for the positive seasonals to kick in. Oil and the energy stocks seasonals are positive from roughly December to July. Note even on the chart above that oil and the Philadelphia Oil & Gas Index (XOI) both had a peak in July, followed by a pullback and then a run to a slightly higher high in October. It was then lights out as oil prices (and the stocks) fell sharply. The rally began in the latter part of December. WTI oil has run up to the falling 50-day MA. As well, indicators have quickly become overbought. So, expect a pullback. If the seasonal play continues, the pullback should be relatively shallow and present a buying opportunity. Wed prefer that WTI oil stay above $49. If it does and we move sideways for a week or so, we could form a head and shoulders bottom pattern. If, on the other hand, WTI oil keeps ploughing ahead and takes out $54, then odds favour a run to $58 to $60 where stronger resistance might develop.
Copyright David Chapman, 2019
GLOSSARY Trends Daily Short-term trend (For swing traders) Weekly Intermediate-term trend (For long-term trend followers) Monthly Long-term secular trend (For long-term trend followers) Up The trend is up. Down The trend is down Neutral Indicators are mostly neutral. A trend change might be in the offing. Weak The trend is still up or down but it is weakening. It is also a sign that the trend might change. Topping Indicators are suggesting that while the trend remains up there are considerable signs that suggest that the market is topping. Bottoming Indicators are suggesting that while the trend is down there are considerable signs that suggest that the market is bottoming. |
Disclaimer
David Chapman is not a registered advisory service and is not an exempt market dealer (EMD) nor a licensed financial advisor. We do not and cannot give individualised market advice. David Chapman has worked in the financial industry for over 40 years including large financial corporations, banks, and investment dealers. The information in this newsletter is intended only for informational and educational purposes. It should not be considered a solicitation of an offer or sale of any security. The reader assumes all risk when trading in securities and David Chapman advises consulting a licensed professional financial advisor before proceeding with any trade or idea presented in this newsletter. We share our ideas and opinions for informational and educational purposes only and expect the reader to perform due diligence before considering a position in any security. That includes consulting with your own licensed professional financial advisor.


