-- Published: Monday, 28 January 2019 | Print | Disqus
By: Daniel R. Amerman, CFA
Many people view the seven years of zero percent interest rates experienced in the United States between 2008 and 2015 as being safely in the past, with normal times having returned.
As explored in this analysis, so long as the business cycle of expansions and recessions has not been repealed - then we are highly likely to see a swift return to a potentially protracted bout of zero percent interest rates with the next major downturn in the economy.
Indeed, even the staff of the Federal Reserve itself expects more frequent episodes of zero percent interest rates in the future, and for those episodes to be on a more protracted basis.
This just may change everything when it comes to the financial plans of retirement and other long term investors. Zero percent interest rates don't just eviscerate the ability of retirees to earn interest income, but they also fundamentally change stock, bond, housing and precious metals prices, moving them to places that are outside of the historical averages.
This analysis is part of a series of related analyses, an overview of the rest of the series is linked here.
A Change In The Cycles
As reviewed in the previous analysis in this series, which is linked here, the United States has experienced 34 cycles of expansion and recession since 1854. As explored in that analysis, the business cycle is an extremely reliable night and day cycle.
The sun has gone down 34 times, with those sunsets being the onsets of recessions. The sun has come up 34 times, with those sunrises being the beginnings of the expansions.
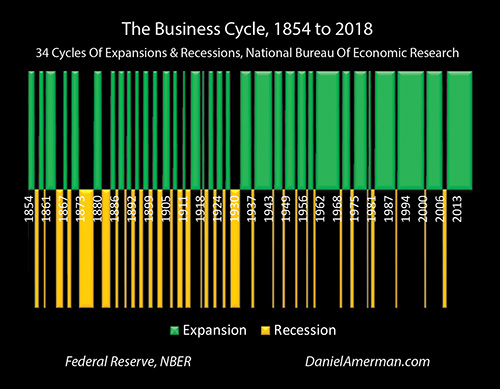
However, as can easily be seen - the left side of the graph is very different from the right side. There was a major change after the Great Depression and the end of World War Two: the recessions grew less frequent and less severe, and the expansions became longer.
What happened was not random, but has been the result of an ongoing series of Federal Reserve interventions, which have transformed the business cycle relative to what it was before the Great Depression and World War II.
The 100% Reliable Way In Which The Fed Responds To Recession
The business cycle has changed because the Fed uses modern monetary policy to actively intervene in the business cycle, with the attempt to shorten recessions and to extend the economic expansions. There's some different aspects to it but the core for how the Federal Reserve has been containing recessions in the modern era and how they change the cycle can be seen in the graph below.
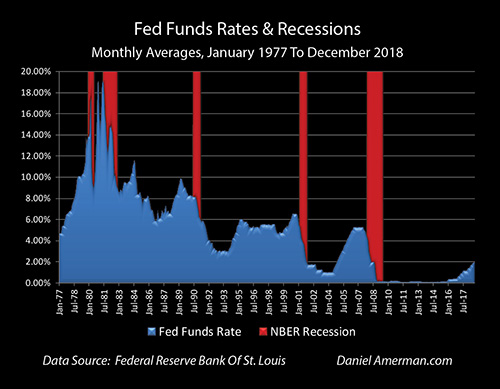
The graph shows Fed Funds rates and recessions from 1977 to 2018, a period of a little over 40 years. There's a pattern that can be very easily seen: every single time that there is a recession, the Federal Reserve slashes interest rates.
The core of the policy is for the Federal Reserve to very rapidly force short term interest rates downwards in the attempt to jolt the economy out of recession. Now, the timing can be a little bit different because sometimes the Federal Reserve acts preemptively when they think a recession coming, but they turn out to be unable to prevent it. Sometimes they are a little bit late in the recognition that a recession has occurred - the starting dates of recessions are not known in real time, but are assigned afterwards when all the data is available for study.
The Federal Reserve often continues the cycle of reducing interest rates well after the official end of the recession, first because they are not sure the recession has ended yet, and then more importantly, because they are trying to make sure the economy has reliably and robustly moved into the next expansion, so that there is no backsliding into recession.
When we review each one of these cycles of recession and the modern monetary response of Federal Reserve - which is to slash interest rates - then we can see how this has worked in process over the last four or so decades.
For the recession of 1980, the decline started a little bit late as the Fed tried to overcome the persistent stagflation of the late 1970s, but Fed Funds rates were eventually forced down from a peak of about 17.5% (rounded monthly averages) to about 9%, which was a decline of about 8.5% in three months. Now that's a major reduction in interest rates!
When we look at the 1981 recession, there was an even bigger reduction, as the Fed dropped rates from the approximately 19% level - which they had raised them to in the attempt to break the back of inflation - down to about 8.5%, which was a decline of about 10.5%.
For the 1990 recession, the peak had reached about 9.8% before the Fed paused the increasing interest rate cycle then in process, because it appeared that the economy was in trouble. The trough after the end of the official recession was about 2.9%, so the total reduction in interest rates was just a little less than 7%.
When we look at the 2001 recession, rates had reached about 6.5% before the Fed paused. The Fed then forced rates down to just below 1% by the end of the cycle in the attempt to jolt the economy out of recession, so that was a reduction in interest rates of about 5.5%.
The Great Recession began at the end of 2007. Rates had reached about 5.25% the last time that the Fed had to pause a cycle of increasing interest rates. Because rates started so low, not yet having recovered from the reduction needed to overcome the 2001 recession, the Fed had to slam interest rates down to about zero percent, so the reduction was about 5.25% (and that was not nearly enough by itself, as we will be covering in the next analysis in this series).
Over the last forty years and five recessions, the Federal Reserve has forced short-term interest rates down by an average of about 7.25% per recession.
This response to recession of rapidly decreasing interest rates has been 100% reliable in the modern era for a simple reason - that this is the policy. Slamming interest rates downwards is the very heart of what the Federal Reserve does when it recognizes a recession or the imminent danger of a recession. It does it every time, without exception.
The Coming Return To Zero Percent Interest Rates
In the last approximately 20 years the Fed has moved to a very different place than where they were for most of the post-World War II era. The last two recessions have been different, they have been worse than most, and they were each at least partially precipitated by asset bubble collapses. Having an asset bubble collapse which leads to major investment losses and reductions in household net worth that create persistent spending issues is not a normal feature of the typical business cycle recessions seen between the 1940s and the 1990s.
The tech stock asset bubble collapse precipitated the 2001 recession and because interest rates started from such a low point, the Fed had to knock rates all the way down to a 50 year low, as can be seen below.
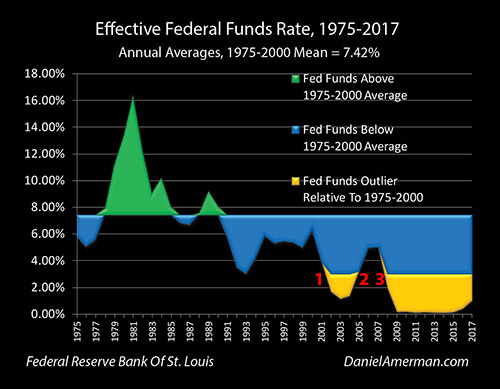
The graph above shows Fed Funds rates that fall in the range experienced between 1975 and 2000 in green and blue, and interest rate outliers - Fed Funds rates that are entirely outside of that range - in gold. As can be seen by the red numeral 1, in response to the 2001 recession the Federal Reserve knocked interest rates far down into the outlier range.
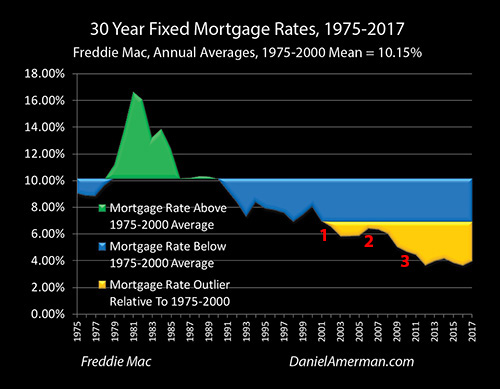
When the Fed slammed Fed Funds rates down to a 50 year low, it also brought mortgage rates down into an outlier range, as can be seen by the red numeral 1 in the graph of 30 year mortgage rates above. Indeed, as explored in the analysis linked here, one of the primary reasons that the real estate bubble formed was the extraordinary low interest rates created by the Fed's response to the 2001 recession.
When that real estate bubble collapsed, it helped to precipitate the Great Recession. Unfortunately, Federal Funds rates started at an even lower level than they had been before 2001, and the Fed knocked interest rates down to zero percent in order to exit that recession, as can be seen below.

Now, let's take another look at our graph of recessions and Fed Funds rates, and compare the right side graph - which is where we are right now - to the rest of the graph. Look at how low interest rates are right now, before a potential recession hits, and how different this is from where rates were before any prior recession.
We're starting at a less than a 2.5% Fed Funds rate, and it's a little uncertain what the Fed will do between now and a possible recession in the next 1-2 years. There is now quite a bit of discussion that the Fed will indeed "pause" in 2019, with no further rate increases. If rates do go up - the chances currently look very high that they will not go up by more than 0.5% or so, perhaps 1% at the maximum. Anywhere within that range, from no increase up to a 1% increase, would mean going into the next recession with much lower starting interest rates than with any prior recession in the last four decades.
It is very difficult to make definitive statements with regard to the economic future, but if there is one statement that can be made with close to 100% confidence, it is that if there is another recession, then the Fed will quickly slam interest rates right back down to zero percent (or less).
Many investors view zero percent interest rates as a bizarre anomaly which never should have happened, but are now safely in the past. However, if we look at history, and we then look not just history but we look at the source of that history which is what Federal Reserve policy is, then given that the average reduction in interest rates over the previous 5 recessions is about 7.25%, with a minimum of about 5.25%, and given that we are likely to start with a Fed Funds rate in the 2.25% to 3% range, perhaps 3.5% at the outside - those Fed Funds rates are almost certainly going straight back to zero percent.
What Federal Reserve history and policy shows us is that so long as the cycle is not broken, so long as there is a 35th iteration of recession, so long as we have night following day yet again, then interest rates will immediately move right back to zero percent (if not lower).
This cycle has radical consequences for investment prices, as well as profits and losses. Indeed there's extraordinary information value there because if there is a 35th iteration of recession followed by 35th iteration of expansion, then we're going to see a series of some of the biggest investment price changes that we have seen since 2006, and these changes are likely to impact every investment category.
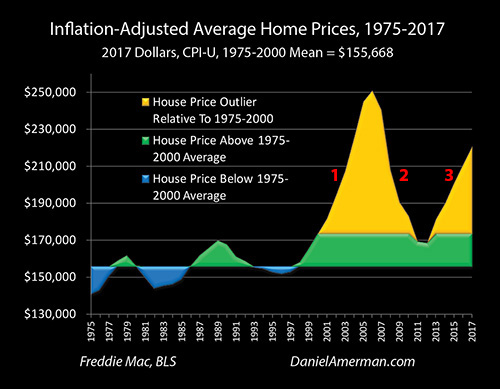
One example is housing prices as explored in the analysis linked here. When we had the golden outliers in terms of Fed Funds rate changes and mortgage rate changes, those in turn created the gold outliers above for housing price ranges - including those seen today, in the second "golden spike".
The real world investment side effects of the Fed's monetary policies has been to create an entirely different price range for housing, where almost every price has been a historical outlier, relative to the markets before the Fed's heavy-handed interventions. Rephrased, while "monetary policy" might sound hopelessly abstract, every house on every street in every neighborhood might have a value that is 20% to 40% different today than it would have been in the past (in inflation-adjusted terms), specifically because of extraordinary monetary policy interventions.
This then means that home prices are far more subject to rapid change with recessions and changes in monetary policy than they used to be. Volatility is up sharply: housing prices used to fluctuate in a band of about +10%/-10% relative to the inflation-adjusted mean, but now the volatility in housing prices is 4X to 5X as great.
So, just using the example of housing, if there is a 35th recession, and the Fed continues with the policies it has used every time since World War II, and Fed Funds rates do go right back down to zero percent - that is likely to again translate to outsized housing losses - and housing gains - in a way that can't be seen by studying the long term historical averages.
These same principles also hold true - with widely varying specifics - for bond prices, stock prices and precious metals prices. When the recession hits, all prices move, and when the Fed slams rates back down to zero percent in response - all prices move, and in a manner that is different than what we have seen in the past. This means that the common practice of expecting the investment statistics of the 20th century to endlessly repeat themselves could potentially lead to some dangerous mistakes.
The graphic below is something that I've been using in my analyses to help communicate the framework for what can happen to prices and returns in all categories, with each turn in the long established night and day historical cycles of recession and expansion, that are now being amplified by our modern heavy-handed Federal Reserve interventions.
The essence is that every time we have a change in the economic cycles (the columns), we also have potentially radical changes in each of the investment categories (the rows). Using a logical framework and an understanding of how the Fed's interventions have changed the markets, we can better identify where the risks are in each investment category, and where unusual opportunities may be available on a cyclical basis as well.
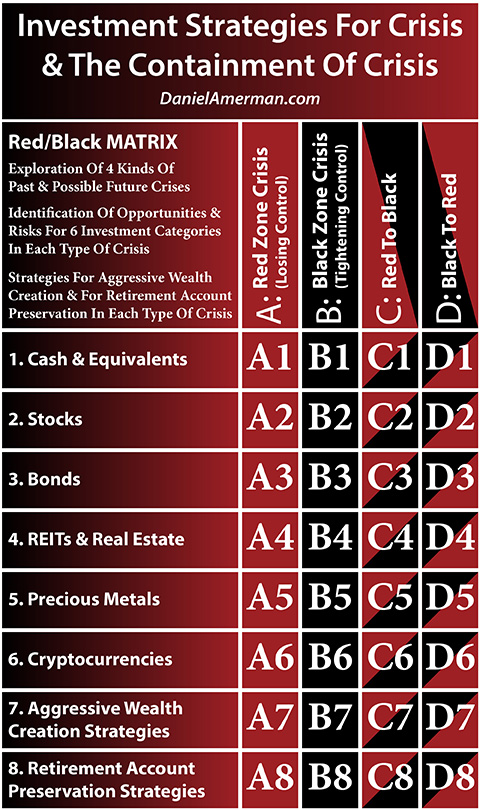
An explanatory analysis for the matrix is linked here.
While parts of this analysis may sound negative - and there are indeed some major issues to be concerned about - there will also be many opportunities in these exaggerated cycles. As covered in the previous analysis, over the last 164 years we have seen 34 iterations of the sun going down and nighttime, and 34 iterations of sunrises and the daytimes that have followed. In both cases there can be extraordinary opportunities from an investment perspective for people who are aware of what is happening.
There is another source when it comes to the likelihood of future rounds of zero percent interest rates. Consider this excerpt from the August 2018 minutes for the Federal Open Market Committee (there is a much more in-depth discussion in my 2019 Cycles Overview):
"...spells at the ELB could become more frequent and protracted than in the past, consistent with the staff’s analysis."
The ELB in this case is Fed-speak for the Effective Lower Boundary for interest rates, which is zero percent. When the Fed staff looks at the future, the current low levels of interest rates, and the ongoing iterations of the business cycle - it doesn't only see zero percent rates in the past. It also sees them in the future, on a more frequent basis than in the past, and possibly on a more protracted basis with each iteration as well.
This may sound radical - but it is the opposite. This is very center of the current conventional wisdom when it comes to monetary policy. If anyone understands the dilemma posed by the business cycle and the current very low level of interest rates, it is the Fed themselves, and they know exactly what is likely to happen when it comes to running up against the boundary in the event of recessions, over and over again.
When we carry through to the investment implications - the cycles will still be with us, but many of the other aspects of investment performance are likely to be transformed. The key is to understand what is coming right now - rather than waiting to be blindsided by it - and hopefully this analysis has been helpful for you in that regard.
*******************************
Read the 2019 Cycles Overview brochure.
Read the investment strategies for crisis and the containment of crisis DVD course brochure.
Read the Spring 2019 workshop brochure.
This analysis contains the ideas and opinions of the author. It is a conceptual and educational exploration of financial and general economic principles. As with any financial discussion of the future, there cannot be any absolute certainty. While the sources of information and the calculations are believed to be accurate, this is not guaranteed to be true. This educational overview is not intended to be used for trading purposes, those making investment decisions should do their own research and come to their own independent conclusions. This analysis does not constitute specific investment, legal, tax or any other form of professional advice. If specific advice is needed, it should be sought from an appropriate professional. Any liability, responsibility or warranty for the results of the application of the information contained in the analysis, either directly or indirectly, are expressly disclaimed by the author.
Copyright 2006-2019 Daniel R. Amerman, CFA
| Digg This Article
-- Published: Monday, 28 January 2019 | E-Mail | Print | Source: GoldSeek.com

