-- Published: Monday, 11 February 2019 | Print | Disqus
By: Keith Weiner, Monetary Metals
Last week, in part I of this essay, we discussed why a central planner cannot know the right interest rate. Central planner’s macroeconomic aggregate measures like GDP are blind to the problem of capital consumption, including especially capital consumption caused by the central plan itself. GDP has an intrinsic bias towards consumption, and makes no distinction between consumption of the yield on capital, and consumption of the capital per se. Between selling the golden egg, and cooking the goose that lays golden eggs.
One could quibble with this and say that, well, really, the central planners should use a different metric. This is not satisfying. It demands the retort, “if there is a better metric than GDP, then why aren’t they using it now?” GDP is, itself, supposed to be that better metric! Nominal GDP targeting is the darling central plan proposal of the Right, supposedly better than consumer price index and unemployment (as Modern Monetary Theory is the darling of the Left).
There is No Way A Central Planner Could Set the Rate
Anyways, last week we said we would look at the other premise (from the Surest Way to Overthrow Capitalism):
“there is no way a central planner could set the right rate, even if he knew”.
It’s one thing to argue that the central planners haven’t got a metric to help them know the right rate. It’s another to argue that no such metric exists. But let’s go beyond that and concede for a moment that the central planner somehow does know the right rate. How is he supposed to set it?
One problem in setting the right rate is that the very question presumes that the right rate is static. Or at least that it does not move in realtime. But of course, in a real market prices are moving constantly. Here is a graph of the Federal Funds Rate, which is dictated directly by our central planners.
There is one glitch, because this graph shows the effective rate (which may sometimes deviate from the number dictated by the Fed), but this square stair-step pattern looks nothing like any real market price.
Another flaw in the very idea of centrally planning interest, is to think of the economy in low-resolution terms. For example, many might say that, “inflation is moderate, unemployment is low, and GDP is growing.” At best, this is like looking at a duck gliding in the water. Above the surface, the duck appears calm. Below the waterline, the bird is paddling like mad.
Let’s put this view into explicit words. We realize that few would do this (clear and explicit statements are practically taboo in certain topics). But here goes:
“There are only a few variables. And each variable can be described in the language you see on paintbrushes at the home improvement store: good, better, best.”
This view oversimplifies the economy, the way a low-resolution FAX (remember FAX machines?) of a picture of the Grand Canyon oversimplifies the experience of hiking down to the bottom, camping there, and then rafting down the river.
This view may be sufficient for the evening news, but you will never get anywhere in understanding economics by looking at GDP, CPI, and unemployment in paintbrush terms. Suppose someone proposes raising the tax on the rich, and not just taxing their income but also taxing their wealth. And you say it won’t be good. That person retorts that we had higher taxes in the 1950’s, and GDP was growing faster.
How would you answer that?
Not with the paintbrush model of macroeconomic metrics!
Change Occurs at the Margin
If Carl Menger taught us anything, it’s that change occurs at the margin. If you hike the minimum wage by one penny, someone is laid off. The marginal worker. The very definition of marginal worker is the one who will lose his job if the profit earned by his employer declines.
It is not only oversimplifying, but it misses the point entirely, if you say that “the economy is fine” after raising the minimum wage. The resolution of GDP may be too low to see it (like the FAX of the Grand Canyon picture), but someone lost his job when the new law took effect. A business somewhere was put under.
Every change in the economy ripples through countless variables. The central planner does not even know what those variables are. As the person looking at the FAX can’t tell the color of your raft. And the planner wouldn’t know what to do with all those changes to all those margins, even if the data was pouring into his computer system.
The price of latte rose 10 cents in Portland, the price of espresso dropped a penny in Portland, the price of cement went up $5 in Phoenix, the wage in Boston (median or mean?) fell 25 cents, the price of roofing shingles went down $10 in Phoenix, the price of sand fell 13 cents in New Orleans, the price of 2X4 lumber went up $1 in Baton Rouge, the price of … You get the idea.
Each of the sellers and buyers involved in all of those markets cares a great deal about those price changes. And each has some power to alter the price. For example, the marginal coffee consumer in Portland can switch from latte to espresso. The marginal driveway paver in Phoenix can switch from concrete to asphalt. And the marginal sawmill can send more lumber to Louisiana.
This brings us to a theory of prices based on the individual economic actor. There is not one right price of cement. Not even one right price of cement in Phoenix. Each producer has a price, below which he will not produce. This is based partly on cost, of course (including cost of capital). And also his minimum acceptable profit. Which may, in turn, depend on what other things he could produce and sell and what profits he could make doing those things.
At the same time, each buyer of concrete also has a price above which he finds a substitute or walks away. He may substitute asphalt for concrete. Or he may walk away, because he can make more money doing something else altogether.
A Simple Market
You can think of three concrete producers, one with a walkaway point of $80, one at $75, and one at $70. And four concrete consumers, whose walkaway points are $65, $64, $62.50, and $61. Mr. 65 could sell it in Tucson for $70, but it will cost him $2 to truck it down, and he’s not willing to work for less than $3. The 64 guy can sell concrete pavers, but it’s not worth the effort at any price above $64. The 62.5 bid comes from a maker of concrete curbing. And so on.
$70 is the marginal offer price, or just simply “the offer”. $65 is the marginal bid price, or simply “the bid”. If this is a snapshot of our market at 9:01am Monday morning, then there is no purchase or sale of concrete. Then at 10:04am, a building contractor comes to the market. He has a contract to build a million-dollar home. He is not so sensitive to the price of concrete; he needs concrete to deliver the house he is obligated to deliver. So he goes to the $70 producer and orders 50 cubic yards.
This contractor takes the offer price.
It’s a busy day, as another contractor orders some concrete. And another. Now the $70 producer has sold his full production capacity for the week. So he withdraws his offer to sell. We say that “the marginal offer has been lifted”, or simply the offer has been pushed up. The last concrete order for the day is at $75, $5 higher than the day before.
In our example, we have three potential producers who ask $80, $75, and $70. We have four potential consumers, who bid $65, $64, $62.50, and $61. And we have three building contractors who take the best offer of $70. Which of these is the right price?
Now the problem is not merely that macro statistics are low resolution, like that FAX of the picture of the Grand Canyon tour. It is that we cannot even agree whether we mean 1000 feet into the Bright Angel Trail looking down, or whether we mean base camp looking up, or whether we’re rafting on the Colorado River looking at the rapids ahead.
In high resolution, we can see that each participant has his own right price, and is not willing to move above or below it, respectively. And each participant who takes the offer or bid does so, because it’s right for him at that time.
The low-res monochrome FAX simply indicates that the price of concrete went up $5, as we started our discussion above.
Concrete is simple. Whereas interest is the most complex phenomenon of all the phenomena in the markets. There are many more participants in the market, as every wage earner is a saver (or would be, if we didn’t have central banking and Ponzi retirement schemes). And every business is a potential borrower. The price of every productive capital asset, including stocks and real estate, depends on the interest rate.
Even the simple concrete market scenario, of 9 participants one morning in Phoenix shows that there is not one right price, and the closing price tells us nothing about them or their needs or the drivers of those needs. It should be clear that the right price of concrete cannot be described. And if that’s so, then the same applies a thousandfold to the right price of interest (as we are demonstrating for investors).
Interest Is Not a Simple Market
Only a free market can know the right interest rate, and there is there is no way a central planner could set the right rate, even if he knew.
In the end, these statements are saying the same thing. That’s because the mechanism for setting the right price is the same mechanism as for knowing the right price in the first place. Even to arrive at the low-resolution answer that concrete goes from $70 yesterday to $75 today, those 9 market participants have to do business. Or refrain from doing business, respectively.
So price incentivizes some of them to act, and some of them not to act. And their action or inaction, in turn, affects prices.
How could you separate these two phenomena? How could you dictate the price of $75? To whom would you dictate it? The makers of pavers and curbing won’t accept even $70, much less $75. Will you also dictate what their customers are willing to pay for pavers and curbs? Will you dictate to their customer’s customers, in turn, landscapers and commercial property owners, what pavers and curbing ought to be worth to them?
This would never work. You either have to dictate to everyone what they will get, and in what quantities. Or else you let them pursue their interests.
The middle of the road, the idea that the central planner can dictate one price, leaving the rest to the free market, is unstable and unsustainable. It offers some participants a too-low price, so they demand more and more of the good. And others a too-high price, so they go under.
If the price they’re fixing is interest, then you get wholesale capital destruction. Which we write a lot about.
Supply and Demand Fundamentals
The prices of the metals fell slightly.
We are continually amazed at how many commentators, both mainstream and alternative are invested (literally, and figuratively) in the everything-is-cured story. Mainstreamers are comfortable that the Fed is listening, the Fed is responsive, etc. And of course, the spread between junk and Treasury bonds has been narrowing a bit since the start of the year. Well, at least the first half of January. And oil has been rallying, as one would expect in a case of robust demand. Well, it looks to be rolling over in February.
And the alternative finance people point to the technicals of copper, which has been rallying since January (though not last week). Though this is not a sign of everything being fixed, but of the inflation-is-coming story.
Both mistake the (temporary) rise of other currencies as a drop in the dollar. But think about it. This is what is supposed to happen, if the economy is good. Everyone worldwide borrows more dollars (it’s the reserve currency) which they use to finance everything from commodities to bonds in other currencies. This is not dollar repudiation, but when the system is working as intended.
As we write this Sunday evening, we see red in most currencies, including the yuan. Watch this carefully. As Keith discussed with Brent Johnson and Zach Abraham on Know Your Risk Radio, we likely have a period of strong dollar and strong gold ahead of us. It remains to be seen if silver will be included with gold.
If currencies are to begin falling again, and if the junk bond spread keeps widening, watch out.
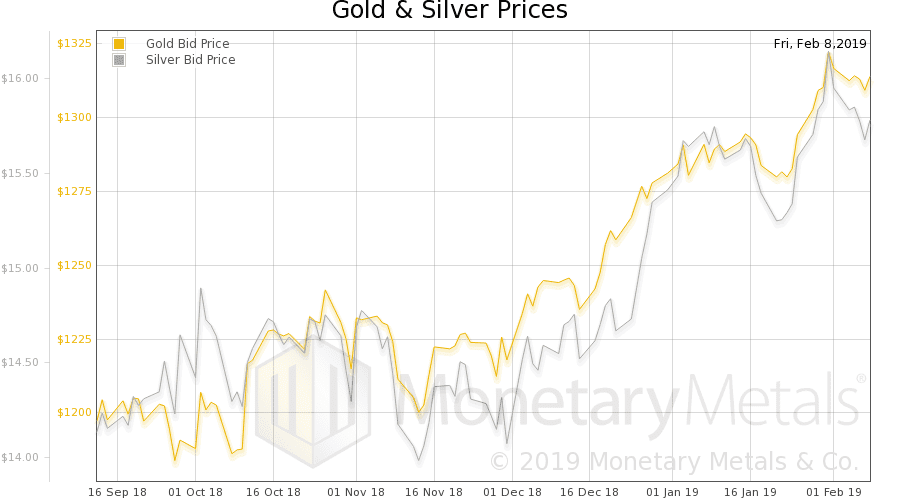
Let’s look at the only true picture of the supply and demand fundamentals of gold and silver. But, first, here is the chart of the prices of gold and silver.

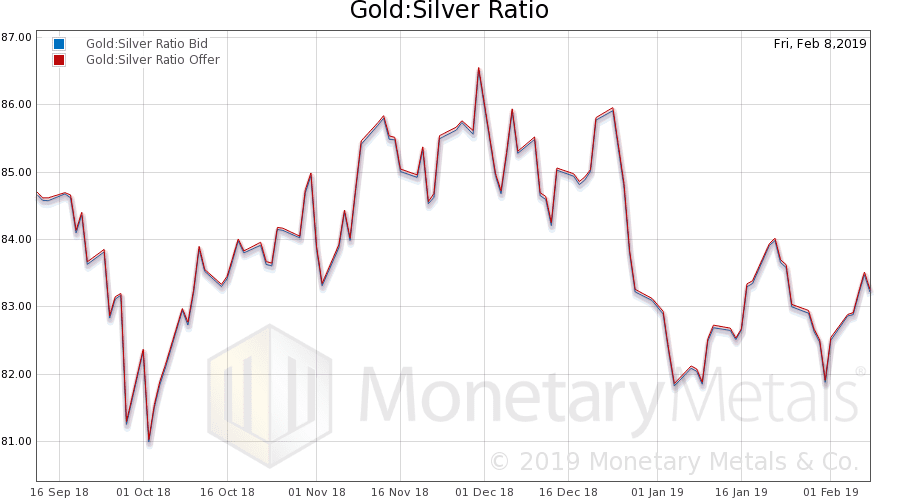
Next, this is a graph of the gold price measured in silver, otherwise known as the gold to silver ratio (see here for an explanation of bid and offer prices for the ratio). It was flat this week.

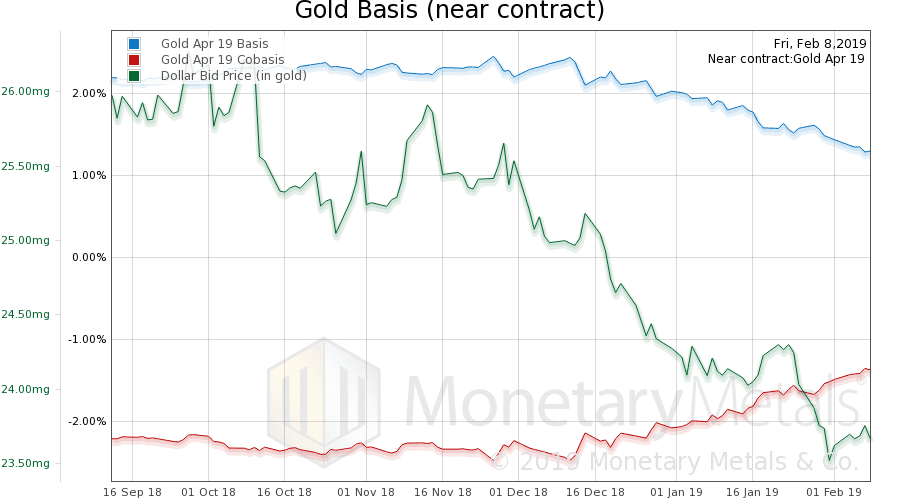
Here is the gold graph showing gold basis, cobasis and the price of the dollar in terms of gold price.

Gold appears slightly scarcer, at least in the near contract. Not really in the gold continuous basis.
The Monetary Metals Gold Fundamental Price was unchanged this week, still $1,391.
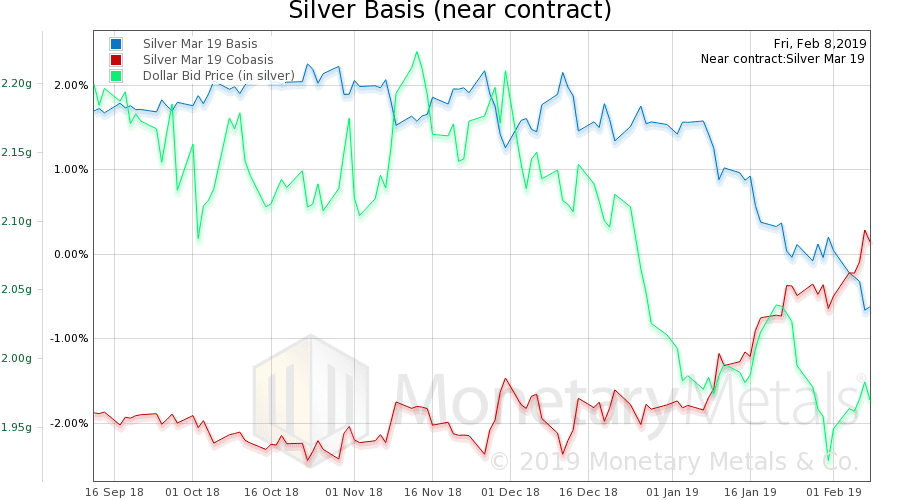
Now let’s look at silver.

The scarcity of silver (i.e. cobasis, the red line) rose, but keep in mind this is the March contract which is rapidly moving towards First Notice Day, and hence under selling pressure (which pushes down the basis, and pushes up the cobasis—key to our response to Ted Butler). The silver continuous basis fell a bit.
The Monetary Metals Silver Fundamental Price fell over half a buck to $16.09
| Digg This Article
-- Published: Monday, 11 February 2019 | E-Mail | Print | Source: GoldSeek.com

