-- Published: Thursday, 7 March 2019 | Print | Disqus
By: Rambus
I know it may have come as a shock to some of you on why I raised some capital by selling a few PM stocks today. Whenever you see a false breakout of any chart pattern and the price action trades below the bottom rail of the original pattern that can setup a bearish situation. Its like a head fake. The stock forms what looks like a great breakout and maybe even accompanied by a breakout gap. Everything looks fine. Then you get the backtest to confirm the breakout. Sometimes we can see several days of backtesting waiting for the breakout move to begin.
The first sign of trouble is when you see the price action trade below the breakout point or below the top rail in this case the bullish rising wedge. Many times the trade can still be saved if the bottom rail of the rising wedge ends up holding support. Once the bottom rail gives way then red flags start flying that something is amise. Many times when you see a false breakout of a chart pattern you can see a strong move in the opposite direction. Again, its like a head fake that gets you moving in the wrong direction before the real move takes place.
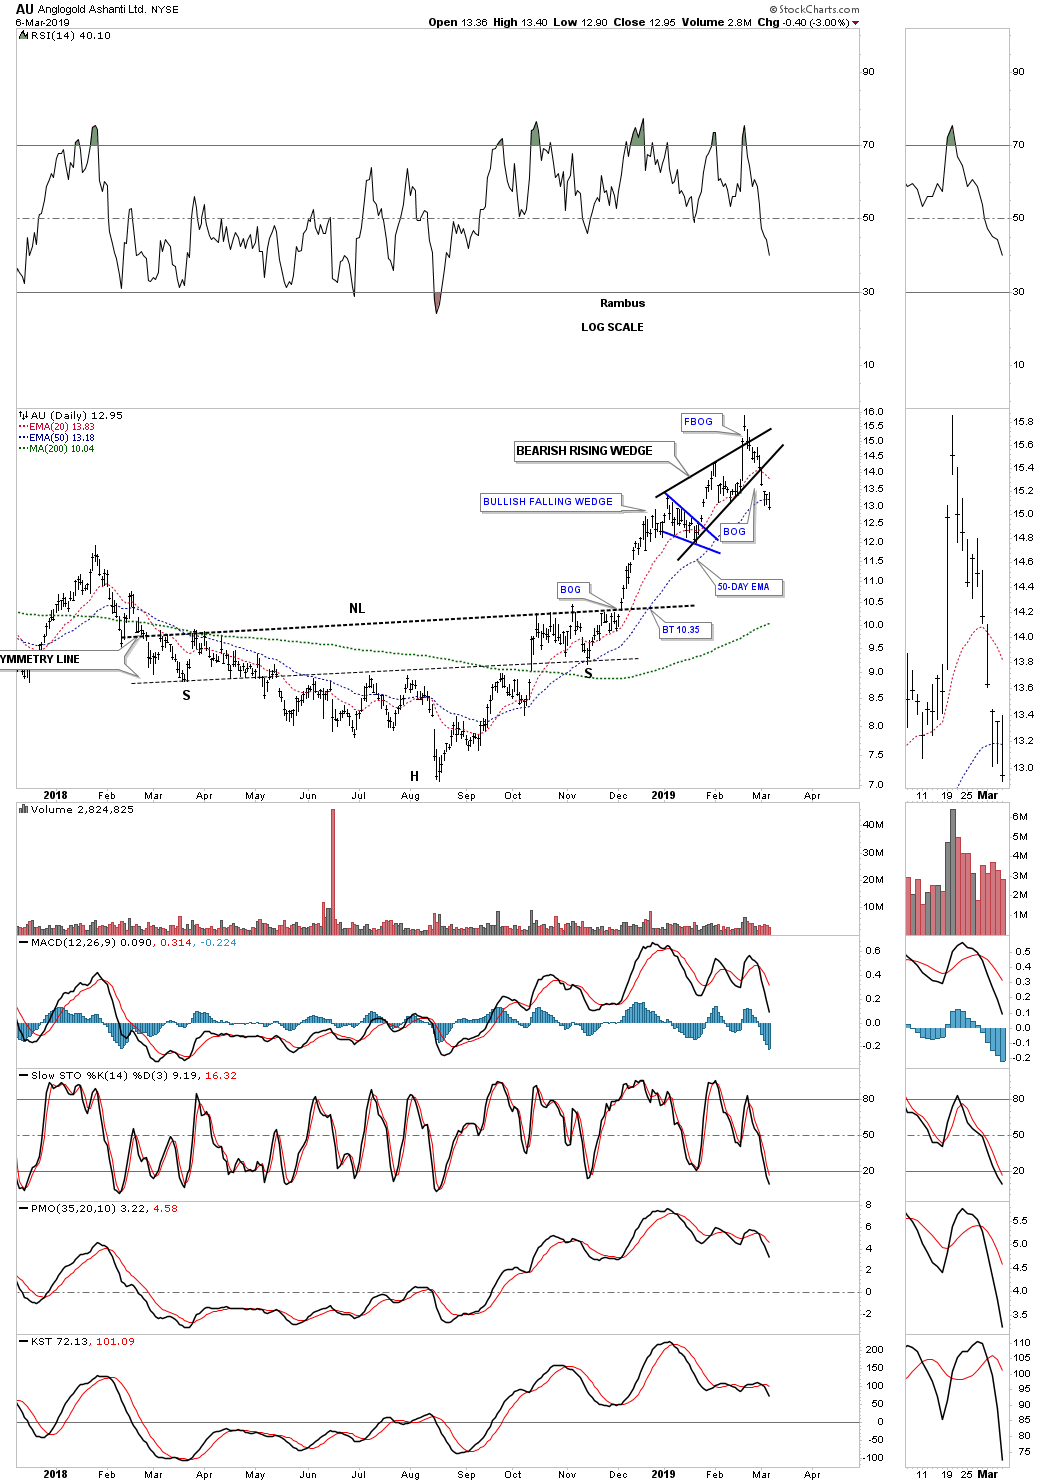
Lets start by looking at a daily chart for AU which built out a very nice looking rising wedge formation complete with a breakout gap above the top rail. AU was one of the leaders and it looked like it was showing the way higher for the PM stocks but after the reversal bar at the top of the chart AU declined back into the rising wedge negating the breakout. All was not lost yet as the bottom rail of the falling wedge could still provide support and save the pattern. Once the bottom rail was lost that put me on high alert to watch the price action very carefully for more deterioration. Monday morning AU opened with a downside gap and today the price action closed below the 50 day ema which strongly suggested to me it was time to get out of this trade.
All is not lost yet however as AU could be in the process of building out some type of consolidation pattern with the first reversal point being the false breakout high. What we need to see next is for a low that would create the second reversal point, another rally followed by one more reversal to the downside to create some type of four point consolidation pattern. Right now there is no way to know what kind of consolidation pattern may form. One important aspect of this daily chart is the one year H&S bottom which should support a much bigger rally than what weve seen so far. As you can see the rally out of the August low was very strong so now is as good a time as any to see AU consolidate those gains.
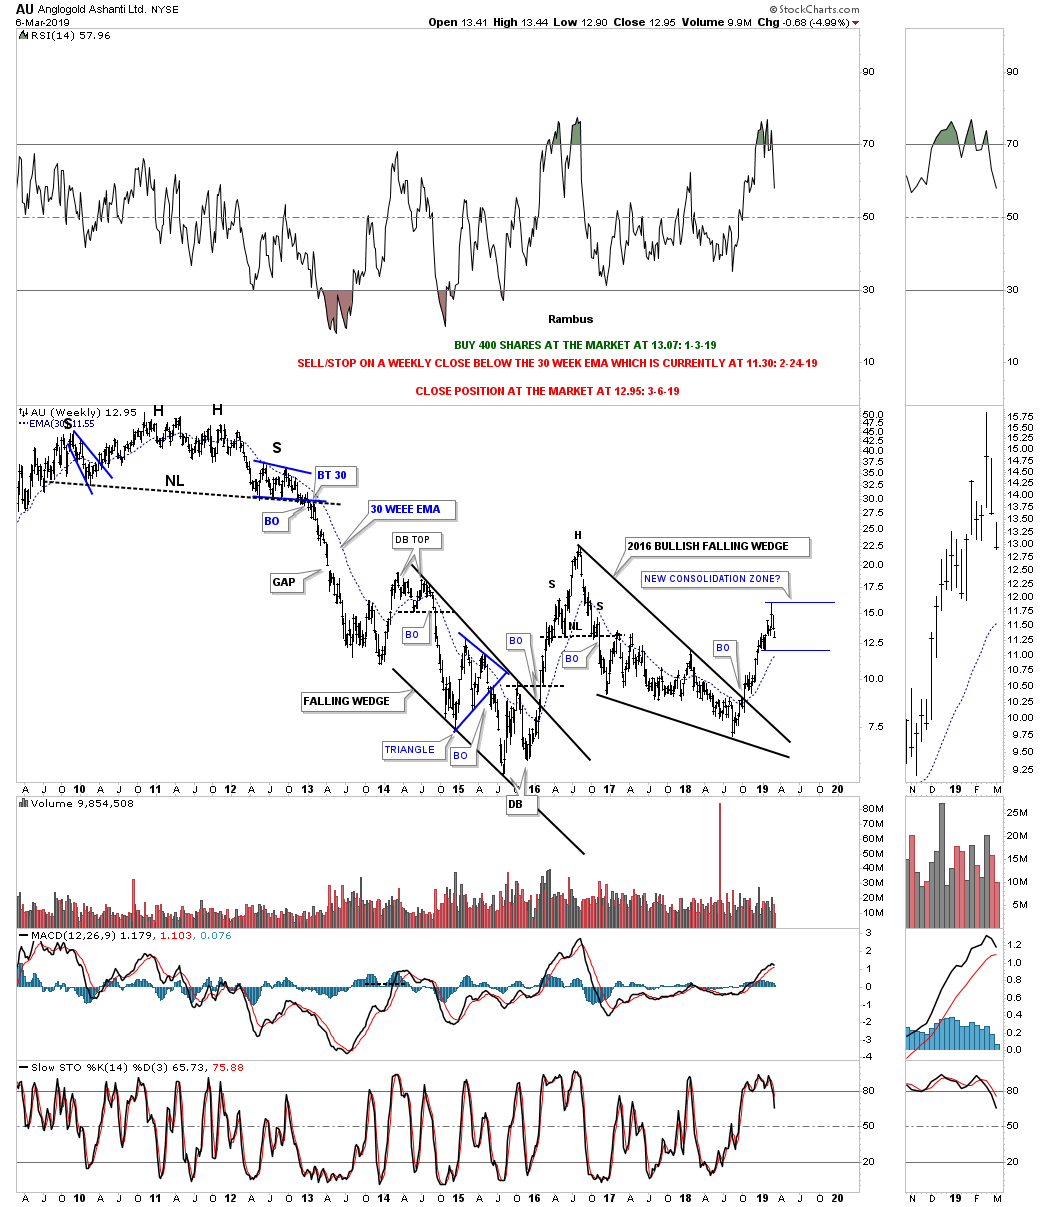
Below is a weekly chart for AU which shows its strong impulse move out of its 2016 bullish falling wedge. Note the blue triangle that formed in the middle of the 2015 bearish falling wedge as a halfway pattern to the downside. As AU was in a strong decline one would have expected the triangle to breakout to the downside. AU is now moving higher so we should expect to see whatever consolidation pattern builds out should breakout to the upside.
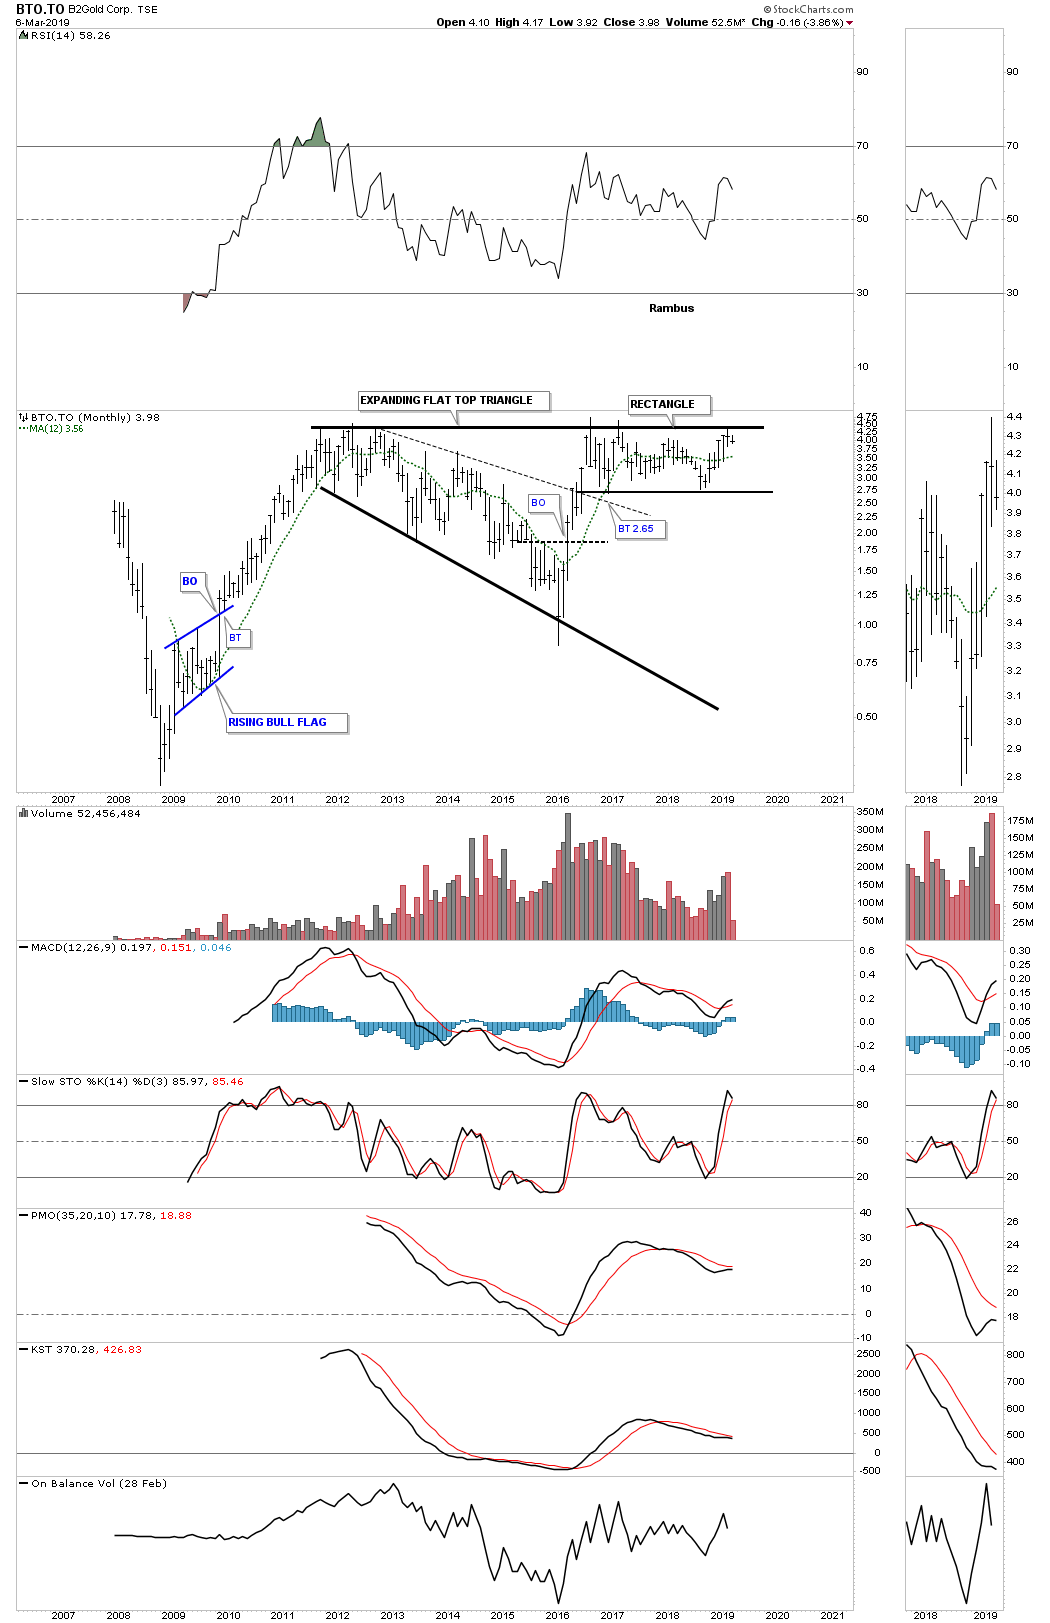
BTO.TO also built out a nice looking rising wedge formation but it too failed to take off and should now be forming some type of consolidation pattern on top of its H&S neckline.

I was hoping that the rising wedge was the consolidation pattern that was going to give BTO.TO the energy it needed to finally takeout that massive overhead resistance line that goes all the way back to the 2011 high. There is already the 2016 rectangle that has been forming below the 2011 high. That will be a big deal when BTO.TO finally moves above that massive line in the sand. There are just a few PM stocks that are trading near their all time highs.
XGD.TO is another PM stock that had a false breakout above the top rail of its rising wedge but failed to follow through to the upside.
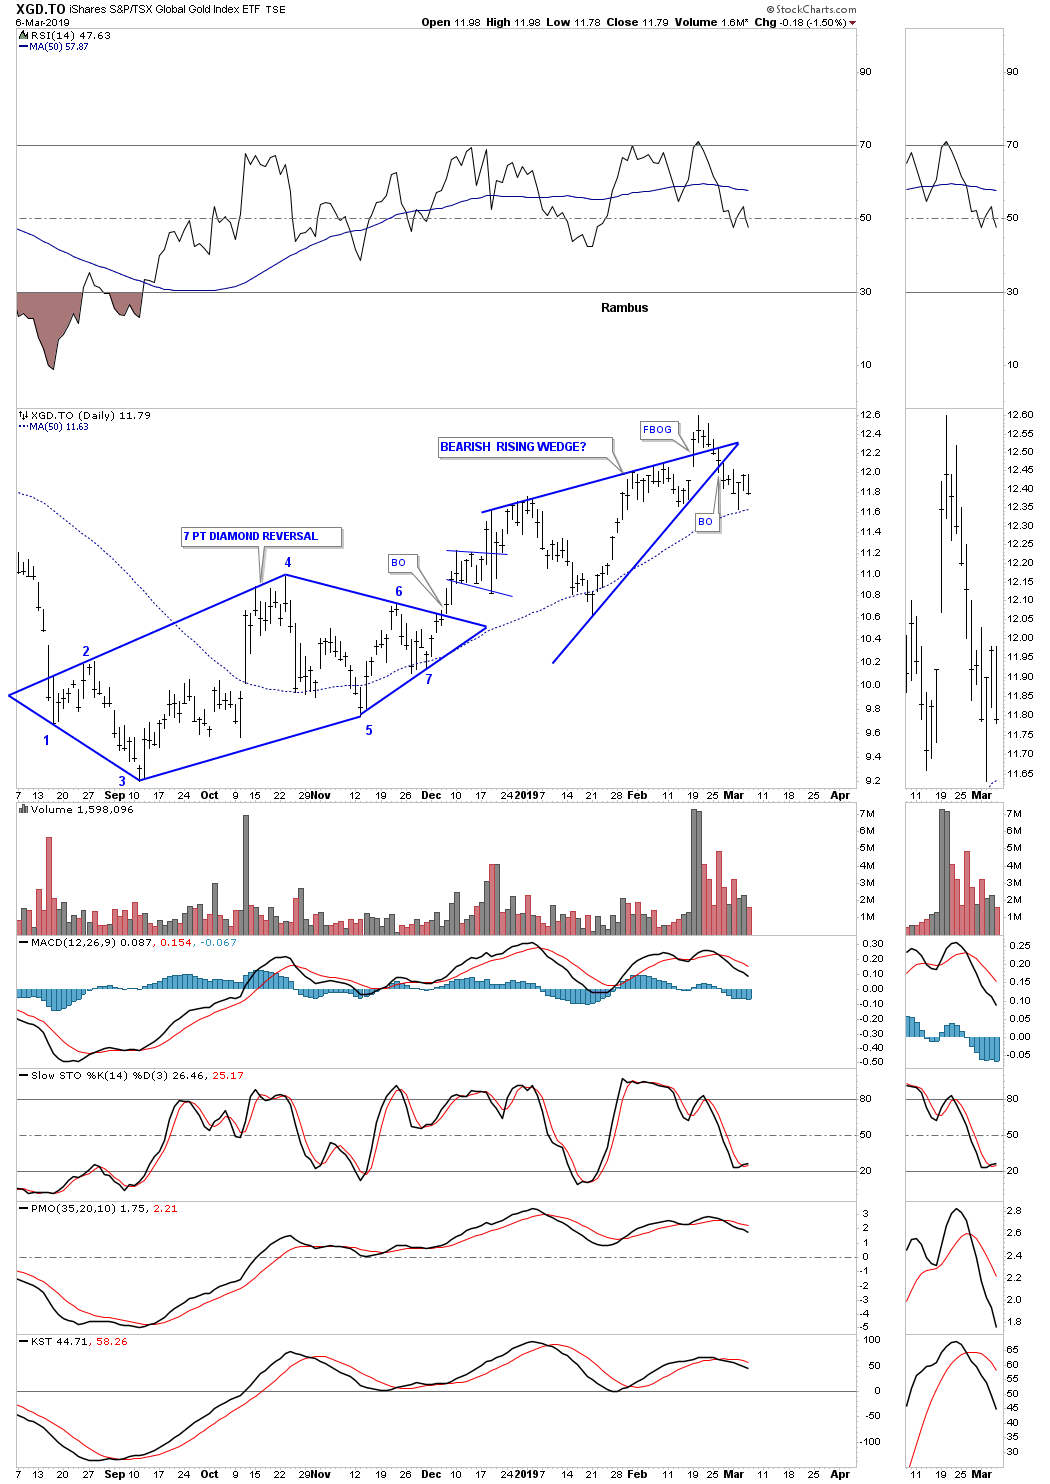
This long term weekly chart still looks good with the top rail of its 2016 falling wedge and the 30 week ema coming in at 11.25.
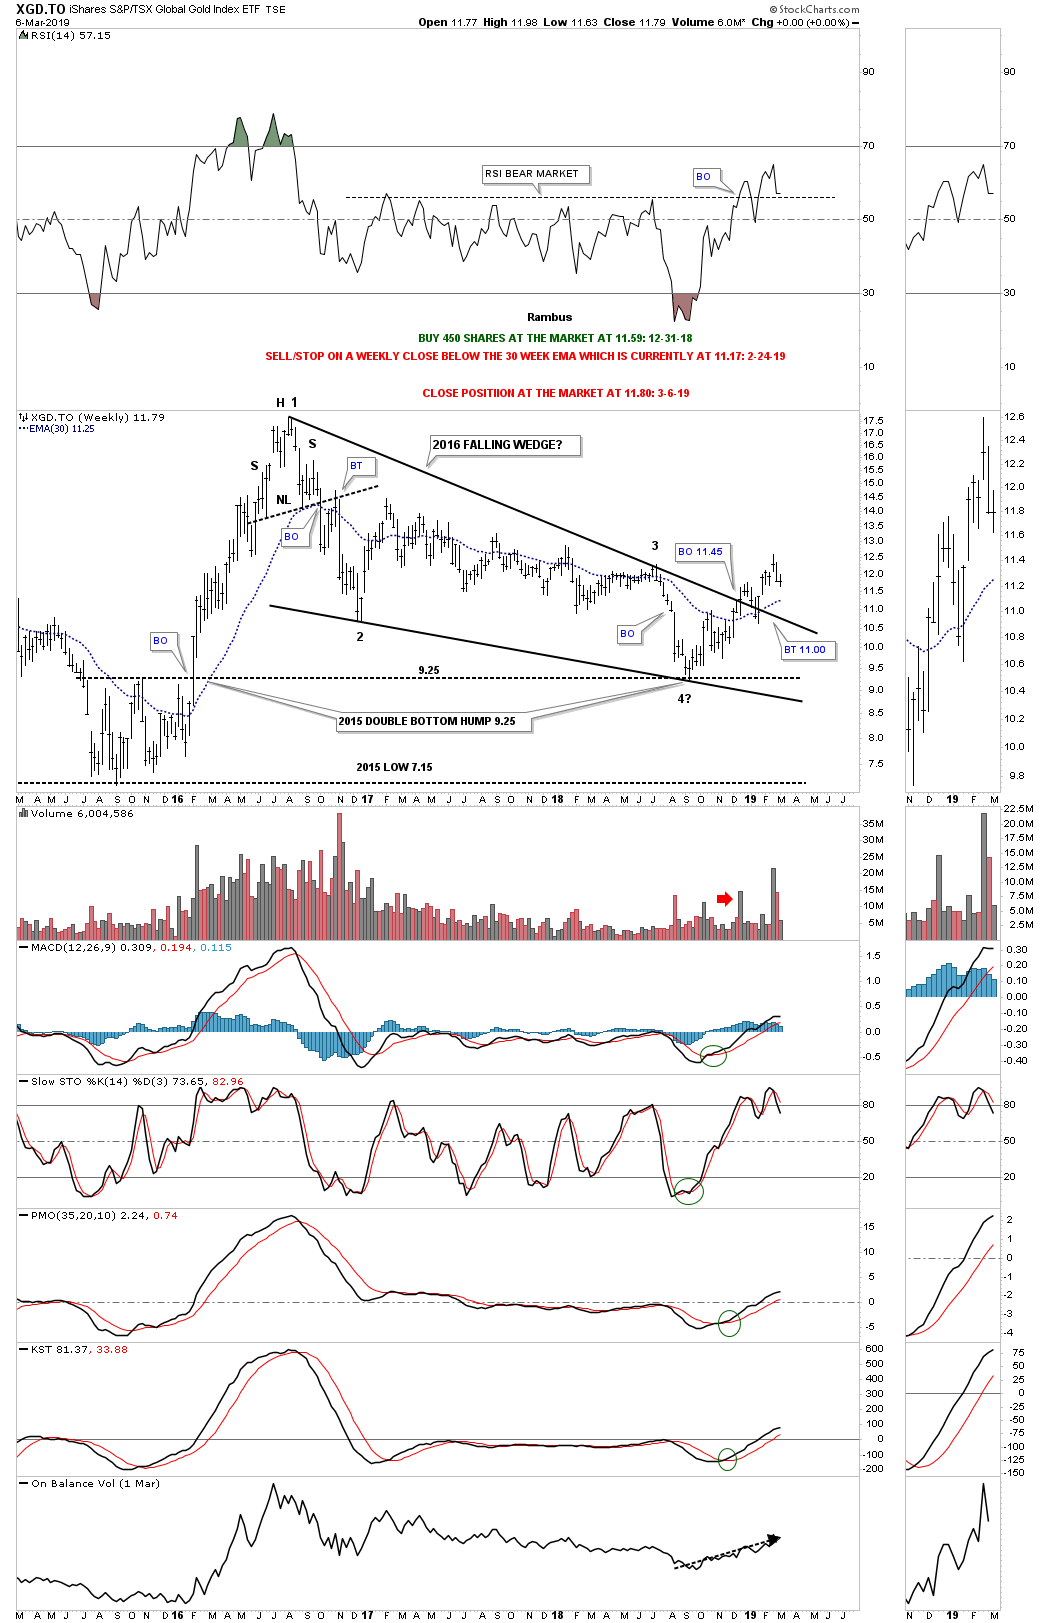
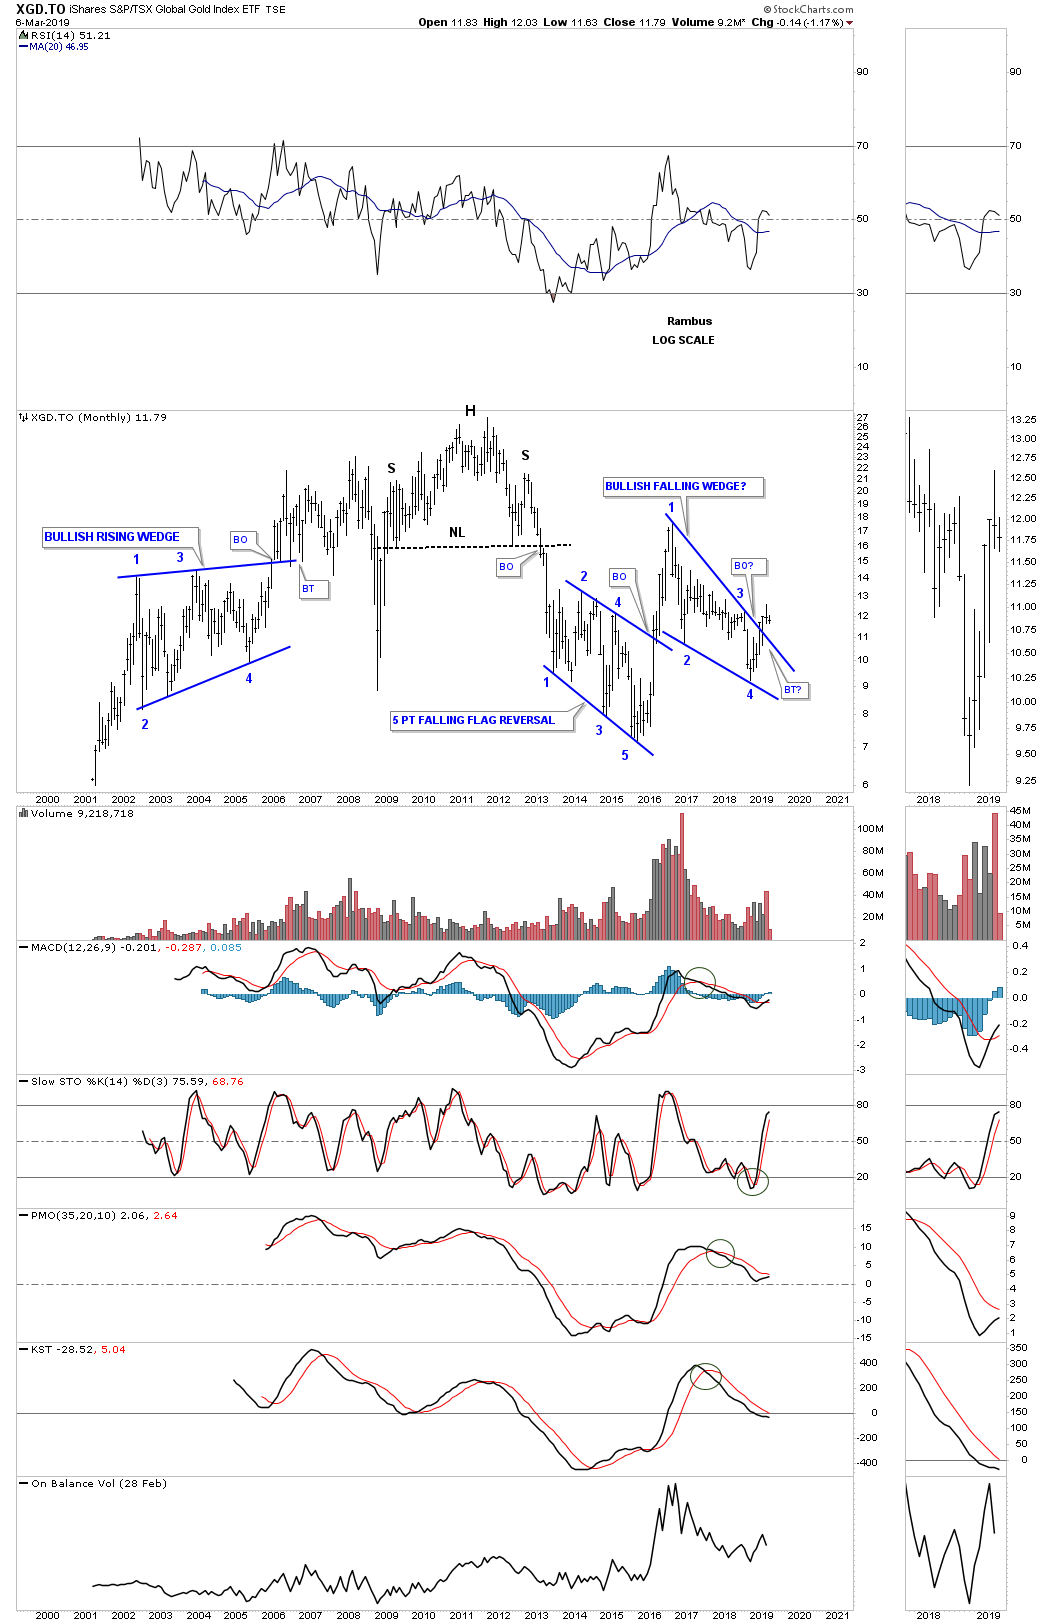
The only real question is will we see a complete backtest to the top rail on this long term monthly chart?
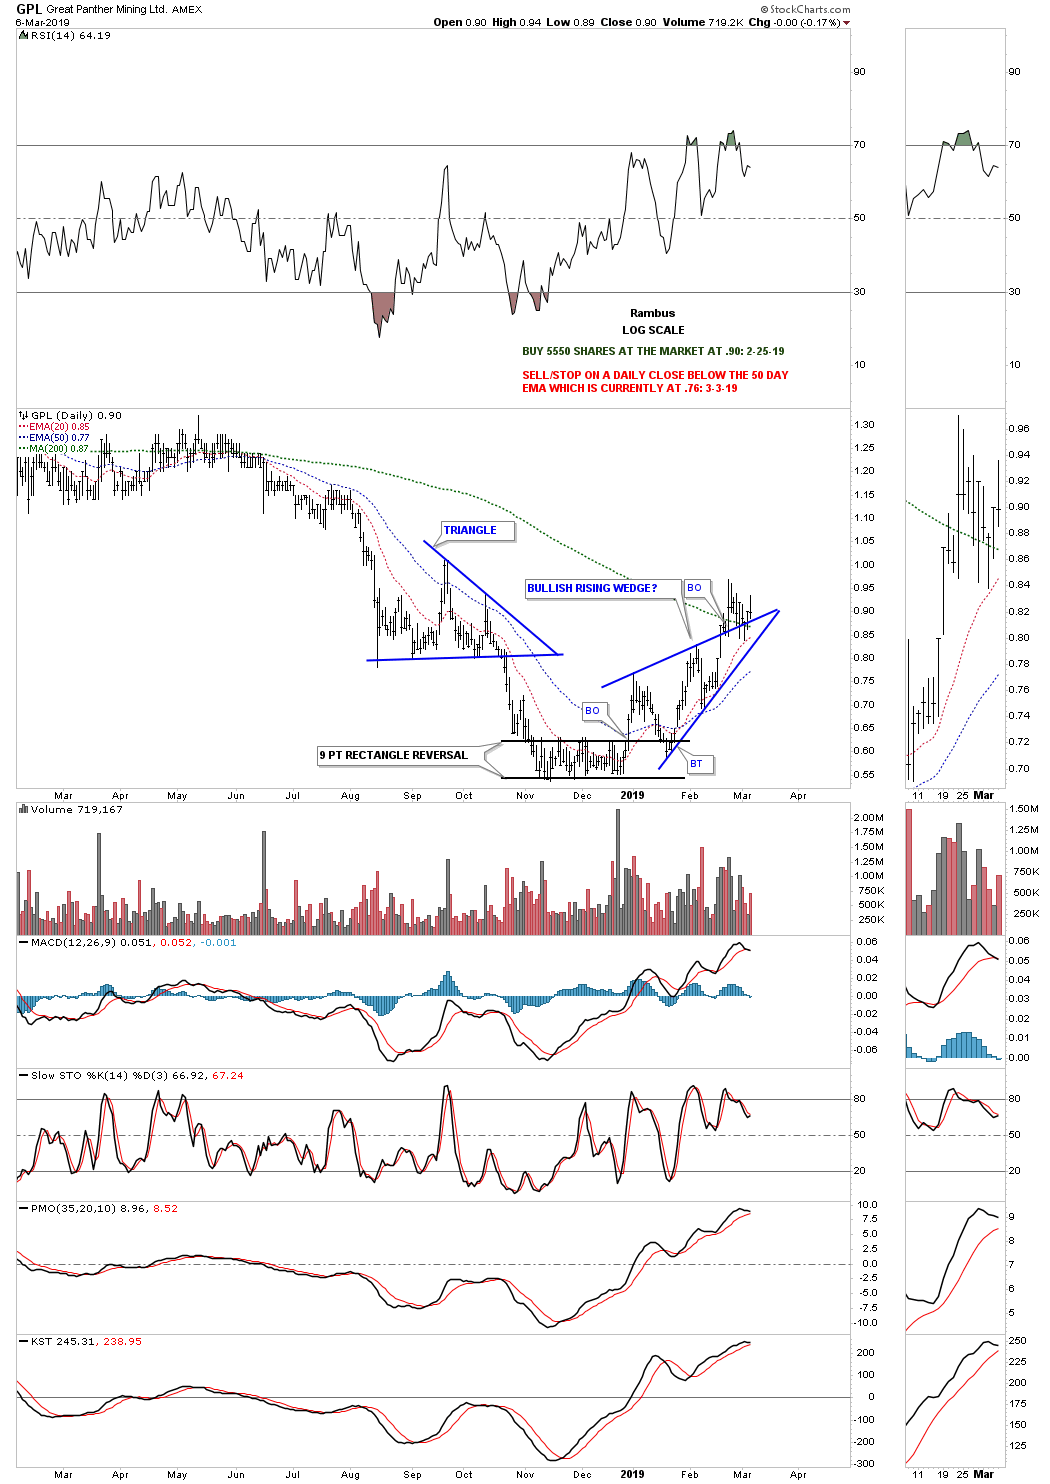
The daily chart for GPL shows it has formed a rising wedge above its nine point rectangle reversal pattern. As you can see it has been in backtest mode to the top rail for about a week now with the 200 day sma helping so far with support. As long as the price action can trade above the bottom rail of the blue rising wedge I will hold on to my position.
This weekly chart for GPL shows the problem Im seeing with many of the PM stocks I follow. Most have put in some type of small reversal pattern at the fourth reversal point within their 2016 falling wedge or downtrend channel. Many have now rallied up to the top rail and are backing off which tells us the top rail is still hot. We had a similar situation back in 2013 when the PM stock were breaking down from their massive 2011 H&S tops. They all didnt break their necklines at the same time. Back then the weakest PM stocks broke down first with the rest taking their turn until GG I believe, was the last one to finally break below its neckline. In our current setup we should see the strongest PM stocks breakout above the top rail of their 2006 trading range first with the laggards to following behind.
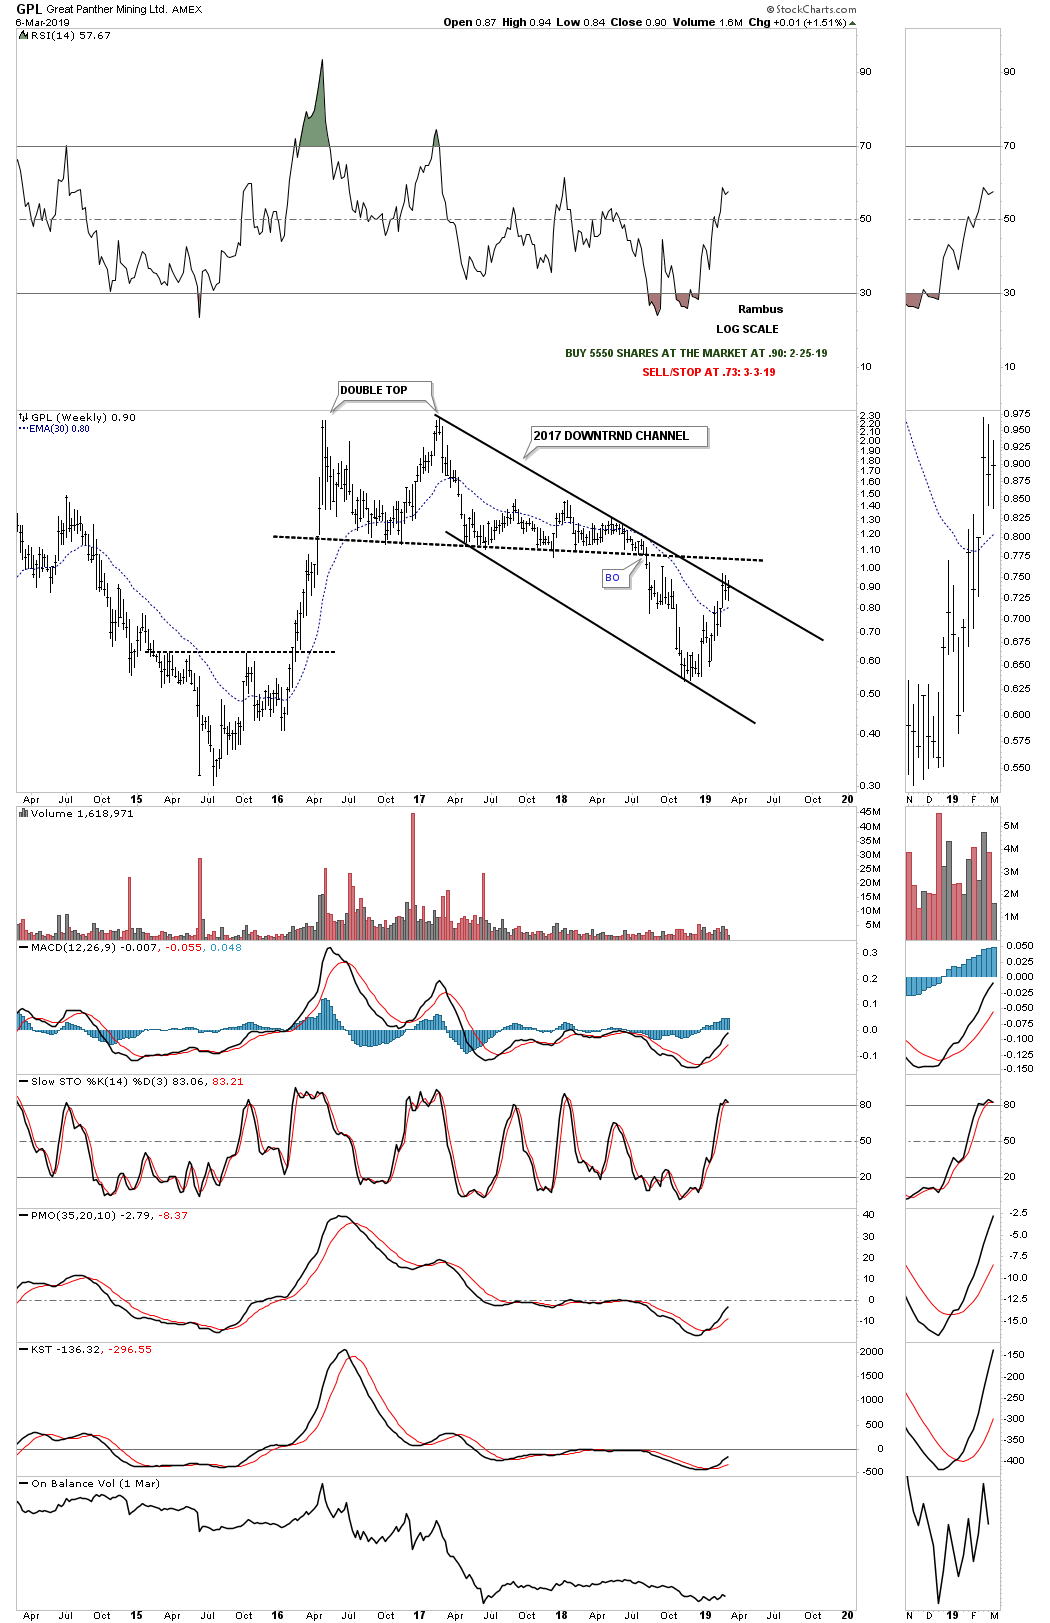
GPL monthly. Close but no cigar just yet.

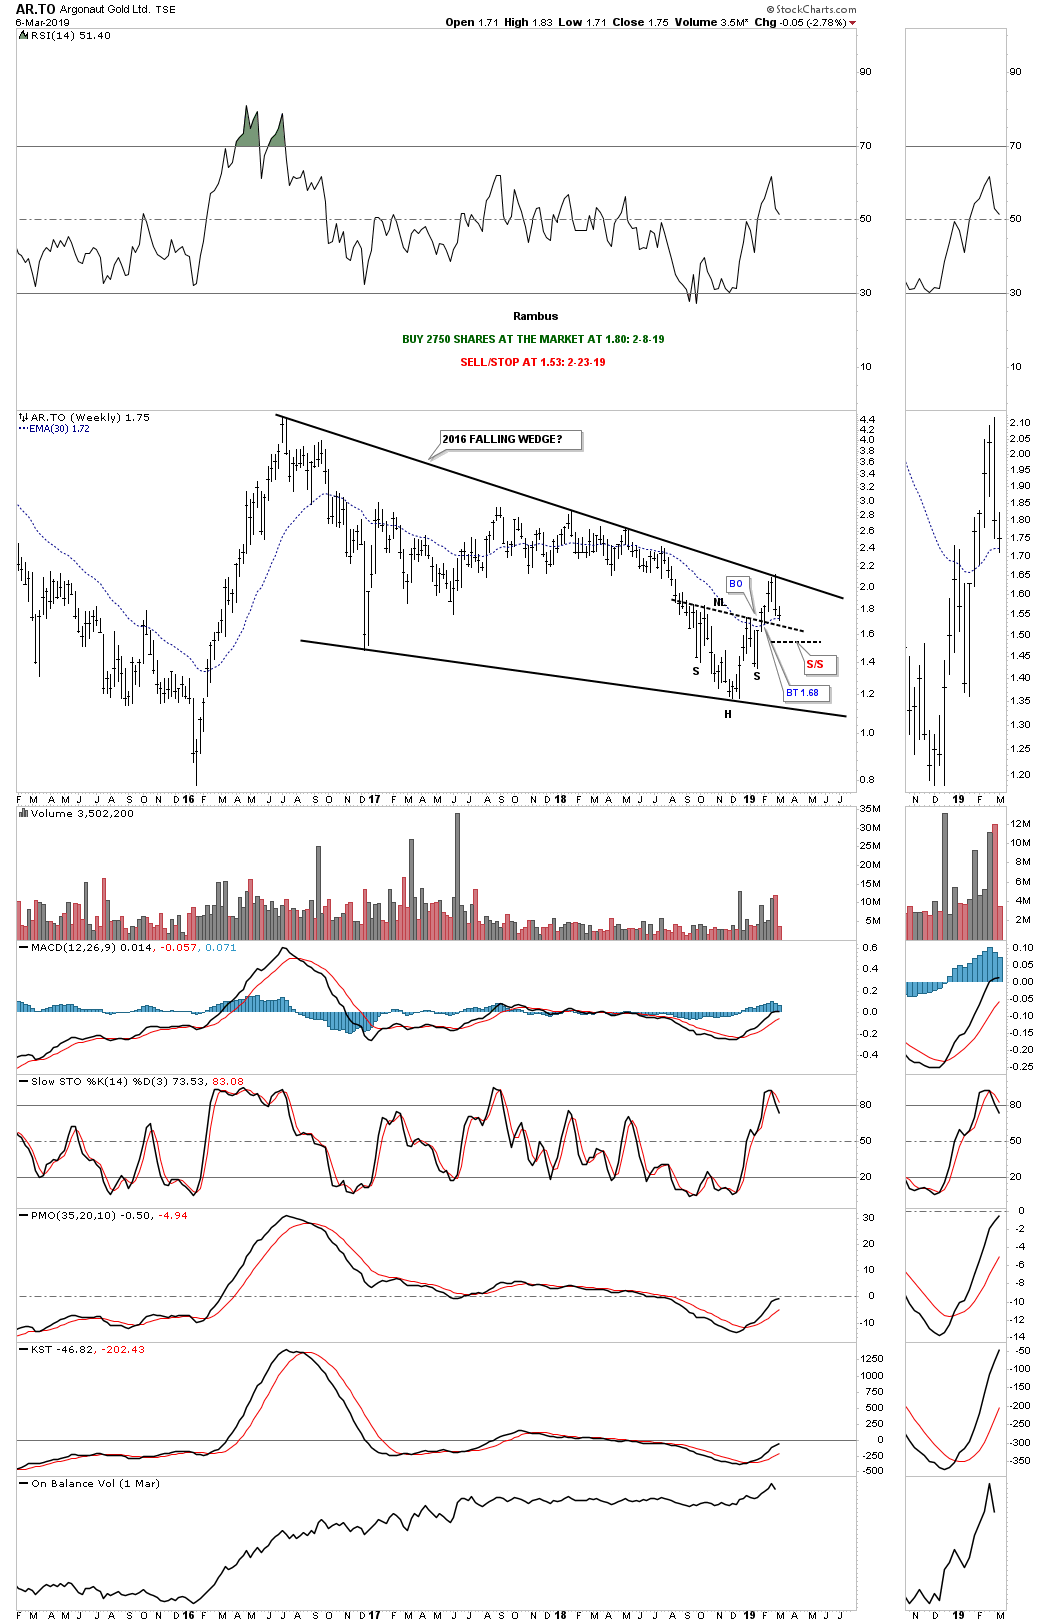
AR.TO shows a perfect example of the small reversal pattern forming at the bottom of its 2016 falling wedge with a rally up to the top rail. Its now backing down and hopefully will find support on the neckline before it tries to take out the top rail again.
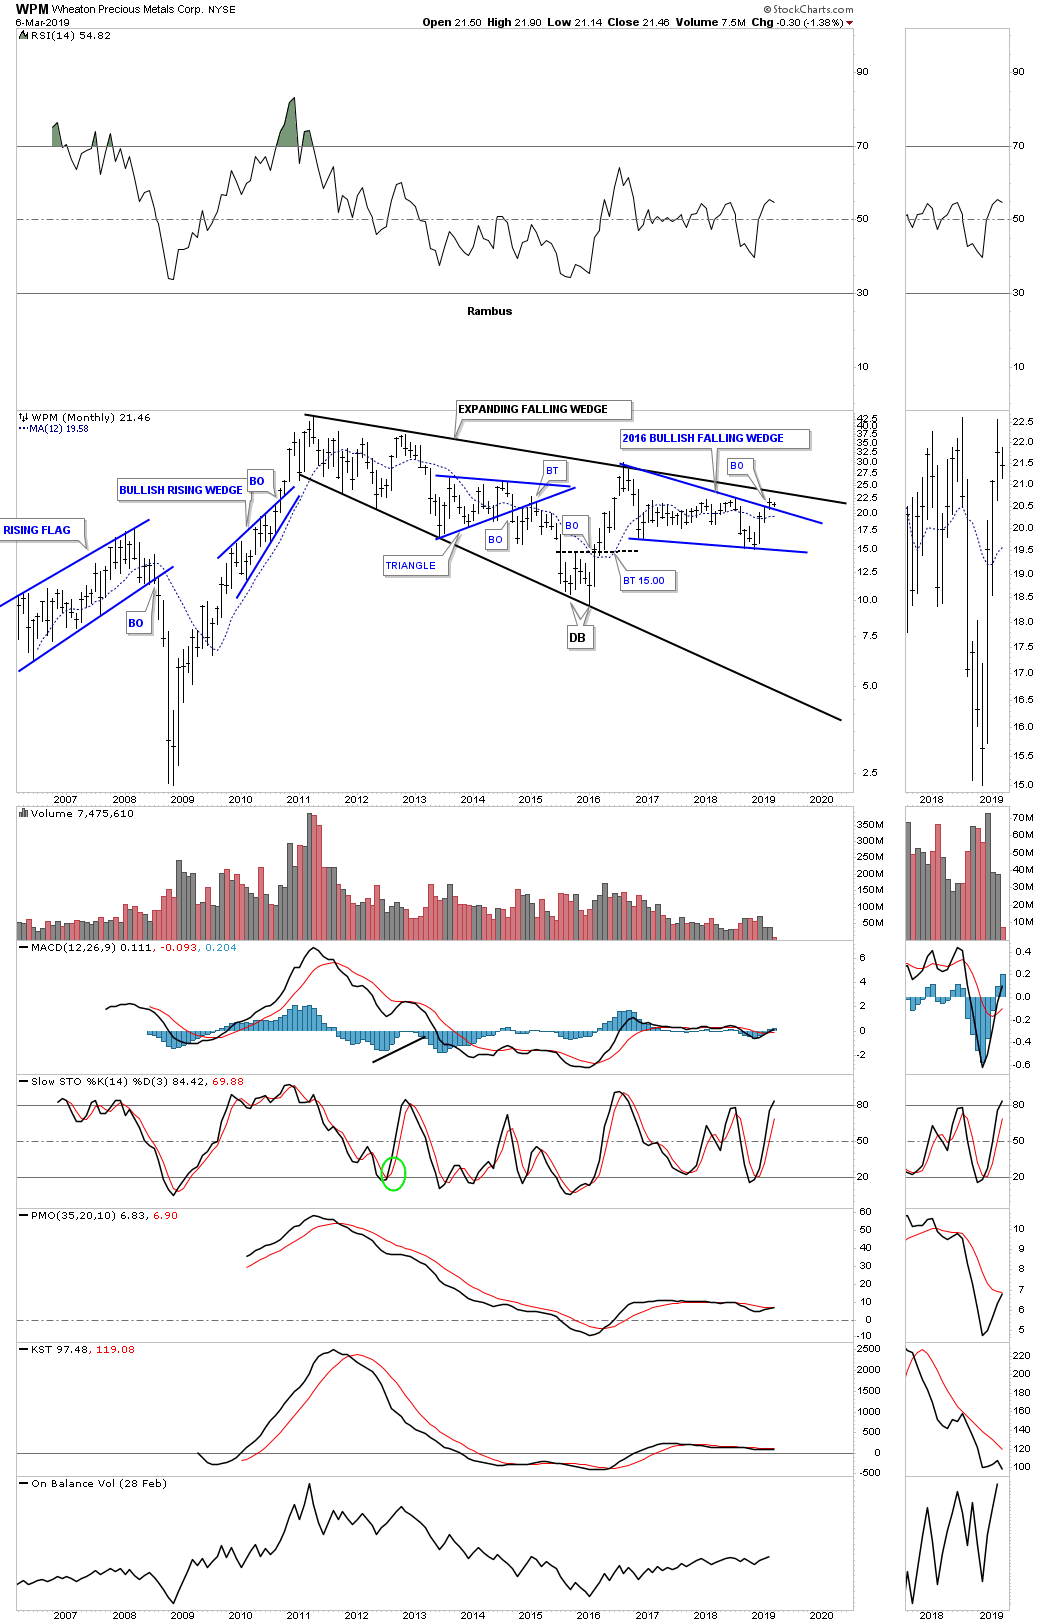
This long term monthly chart for WPM shows it has broken above its 2016 bullish falling wedge but has another important area of resistance to overcome which is the top rail of the black 2011 expanding falling wedge. We could even see a ping pong move between the blue and black trendlines.
SAND is setup a little differently as it formed a symmetrical triangle as its 2016 consolidation pattern and has broken out above the top rail. Note the small double bottom that formed at the last reversal point.
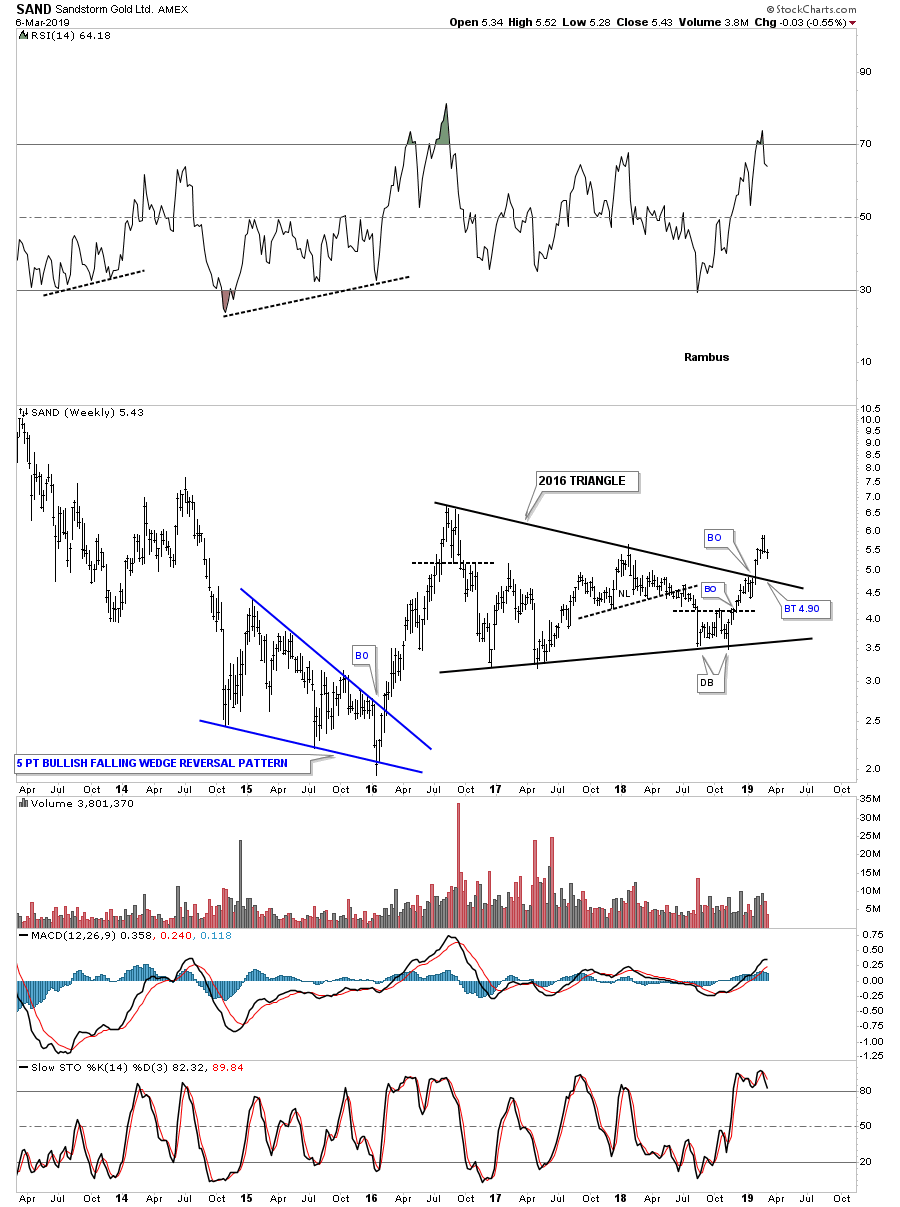
SAND is currently trading between the top rail of its 2016 triangle consolidation pattern which is the right shoulder of a very large H&S bottom. Here too we may see a ping pong move between the neckline and the top rail of the blue symmetrical triangle.

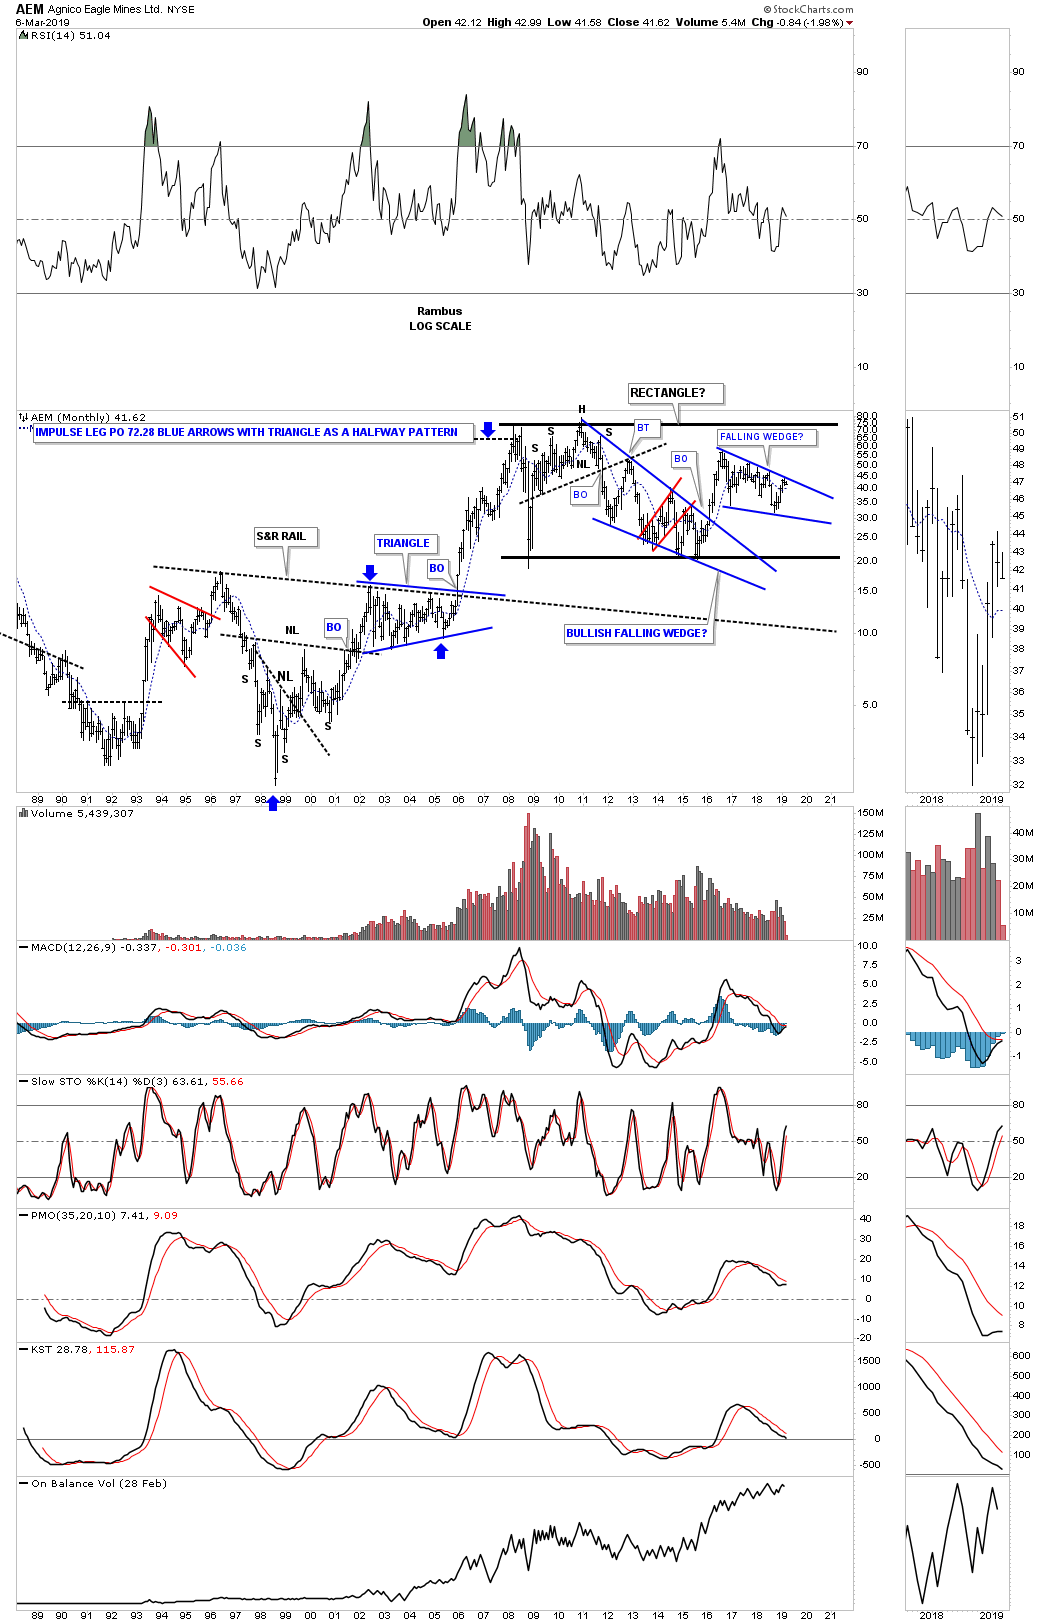
This weekly chart for AEM shows the price action touching the top rail of its 2016 falling wedge and backing off a bit.
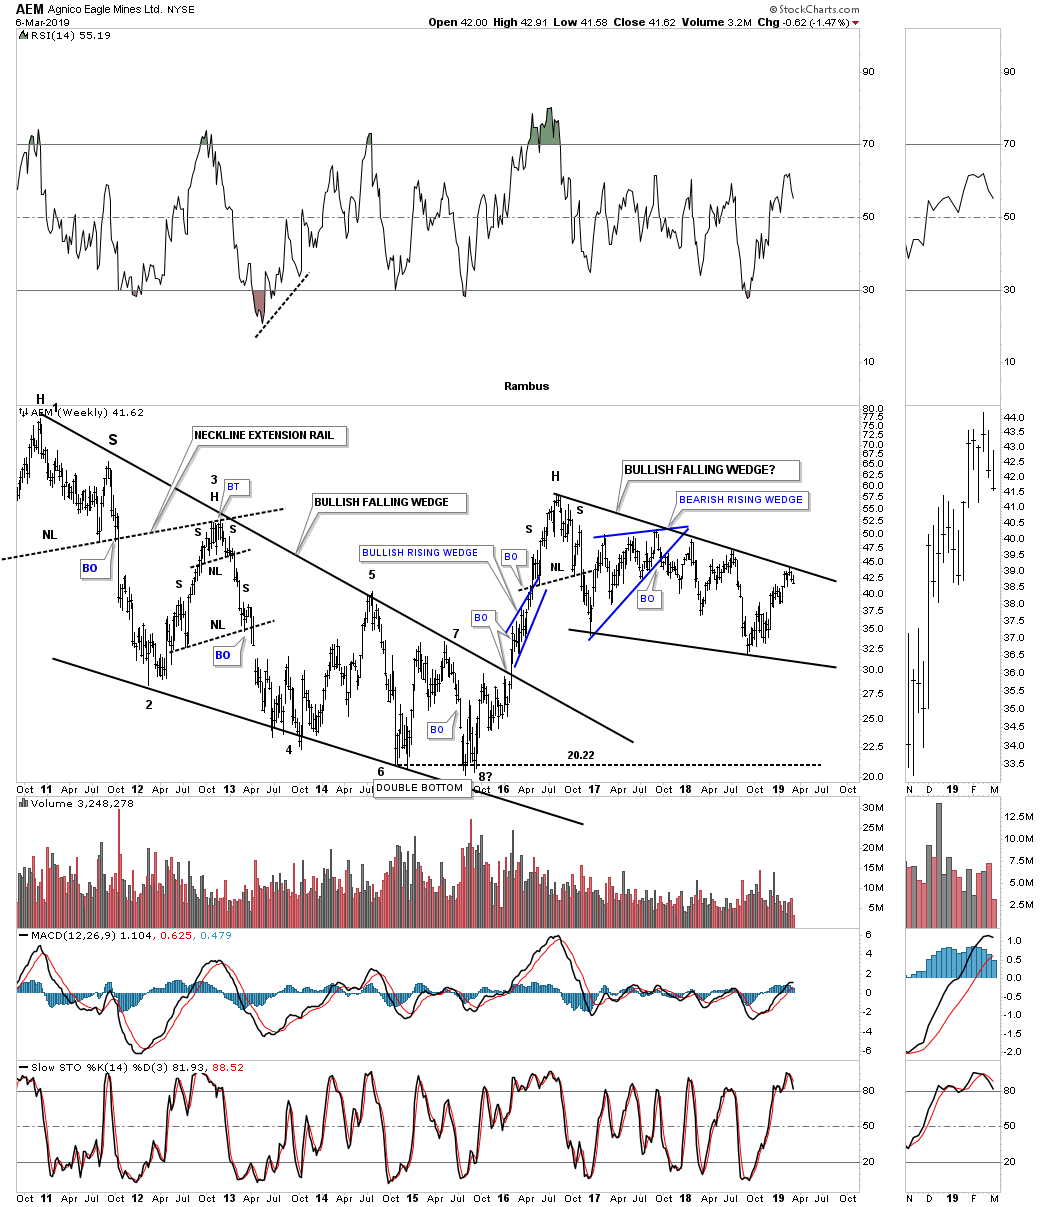
The long term monthly chart for AEM shows the 2016 falling wedge forming inside of the massive 2008 rectangle.
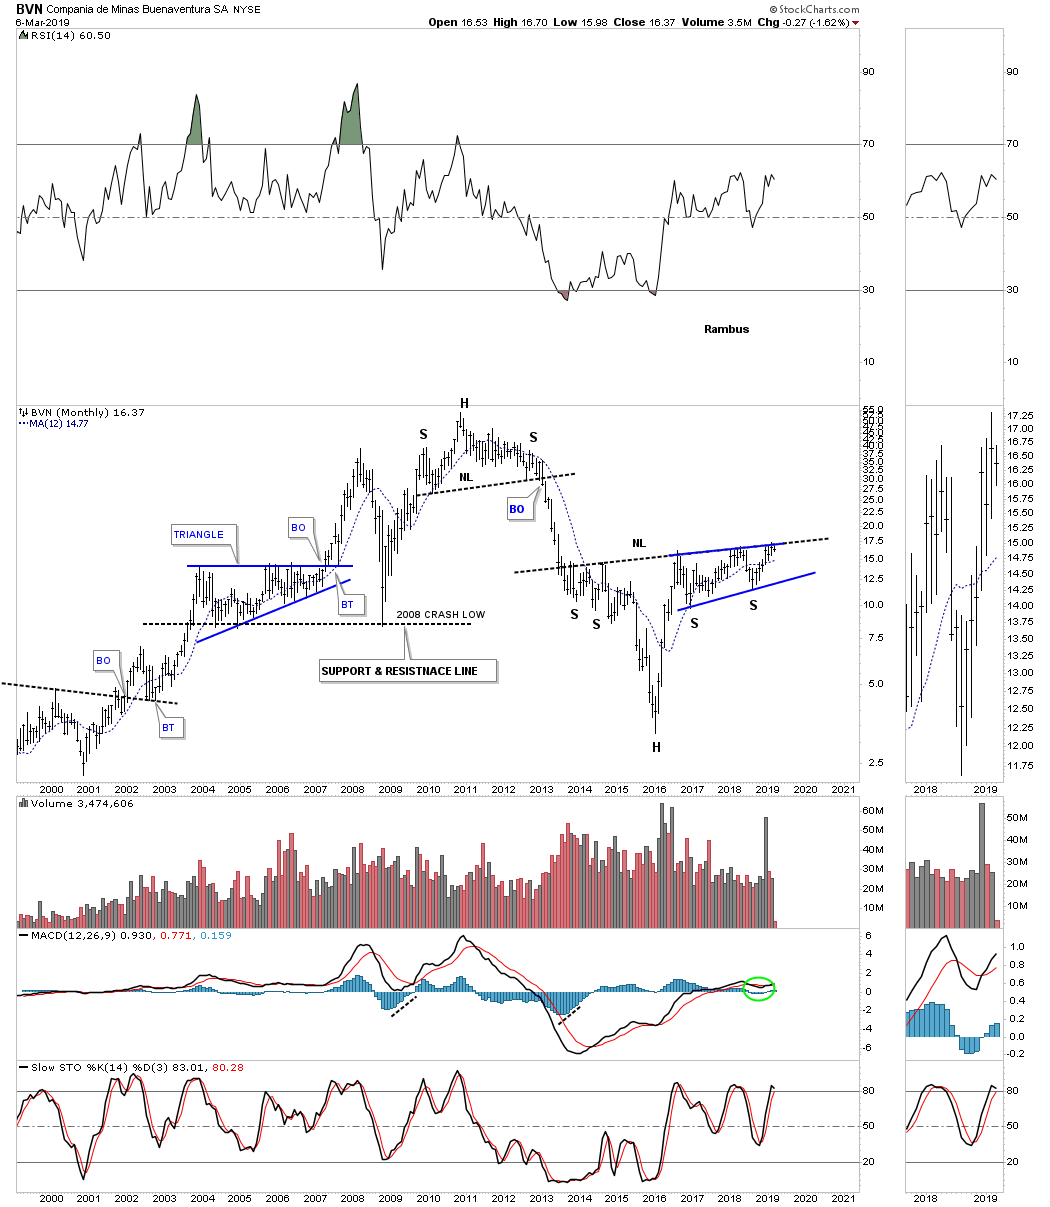
This long term monthly chart for BVN shows the 2016 bullish, RISING WEDGE, forming the right shoulder of a very large H&S bottom.
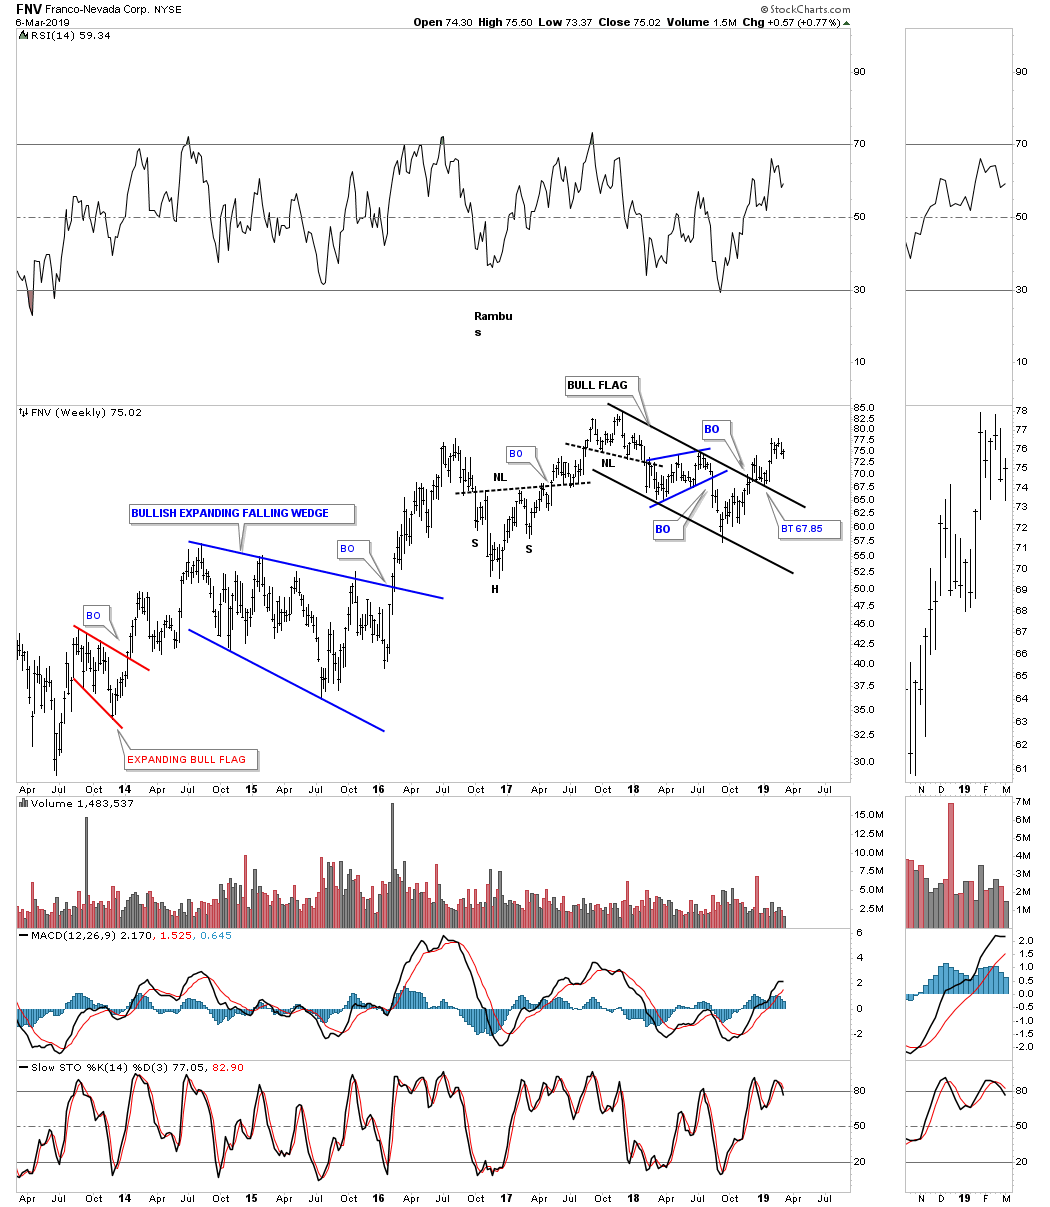
FNV broke out of its 2016 bull flag and looks to have completed a backtest to the top rail.
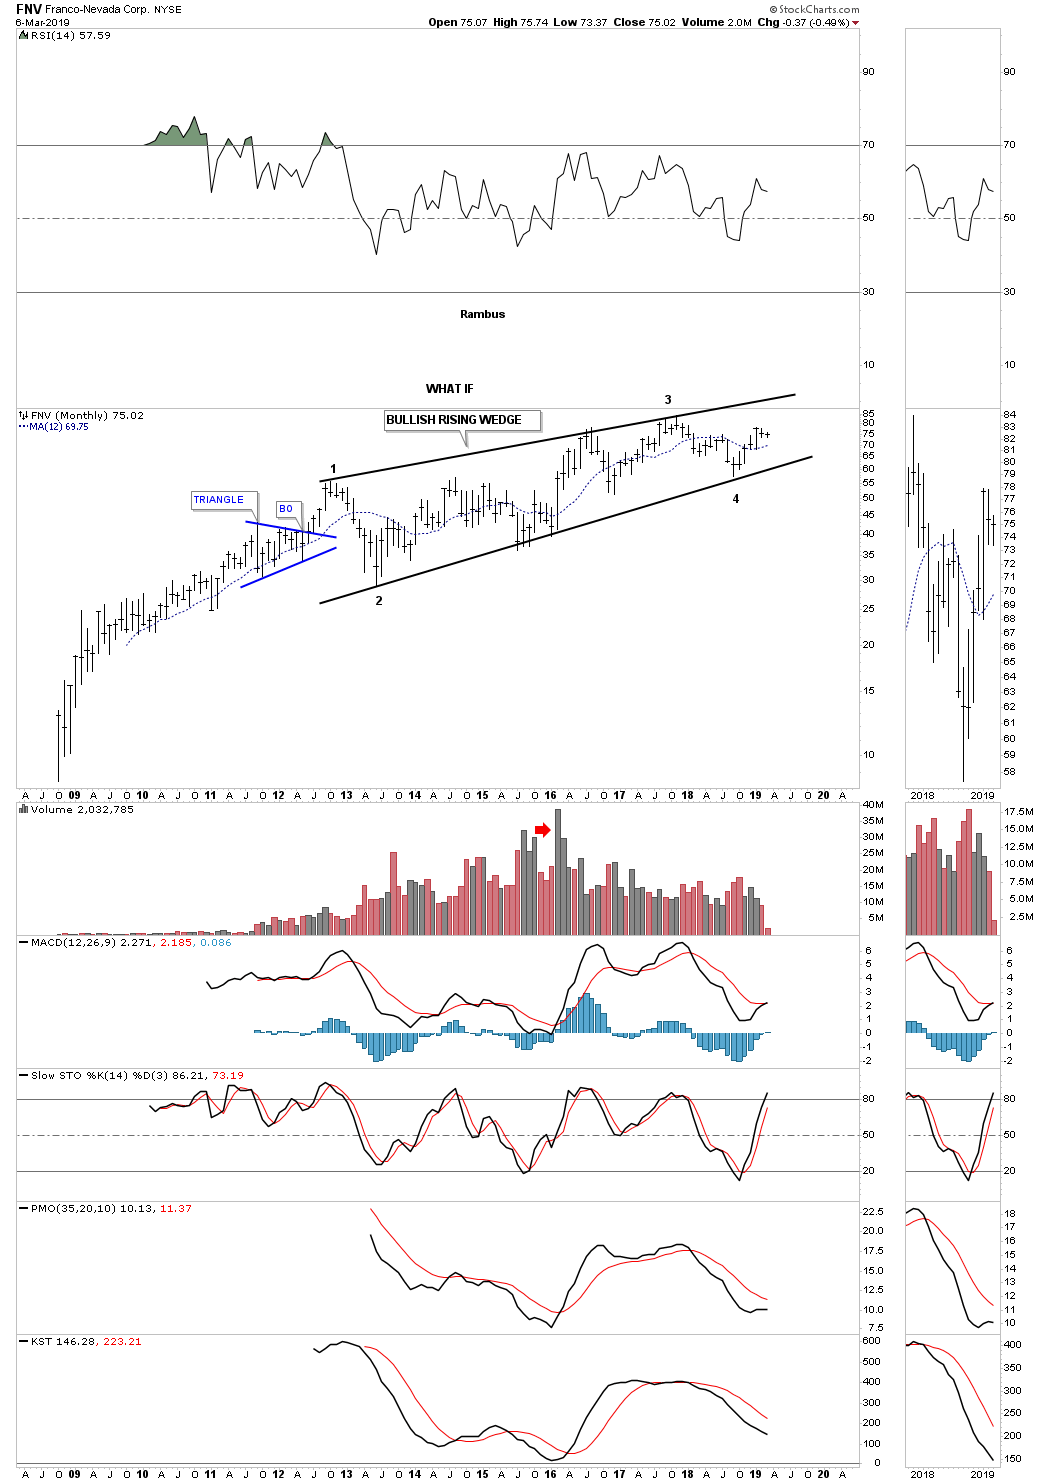
FNV has always been one of the leaders when it comes to the precious metals stock. This long term monthly chart is a WHAT IF chart. What if this is a massive bullish rising wedge?
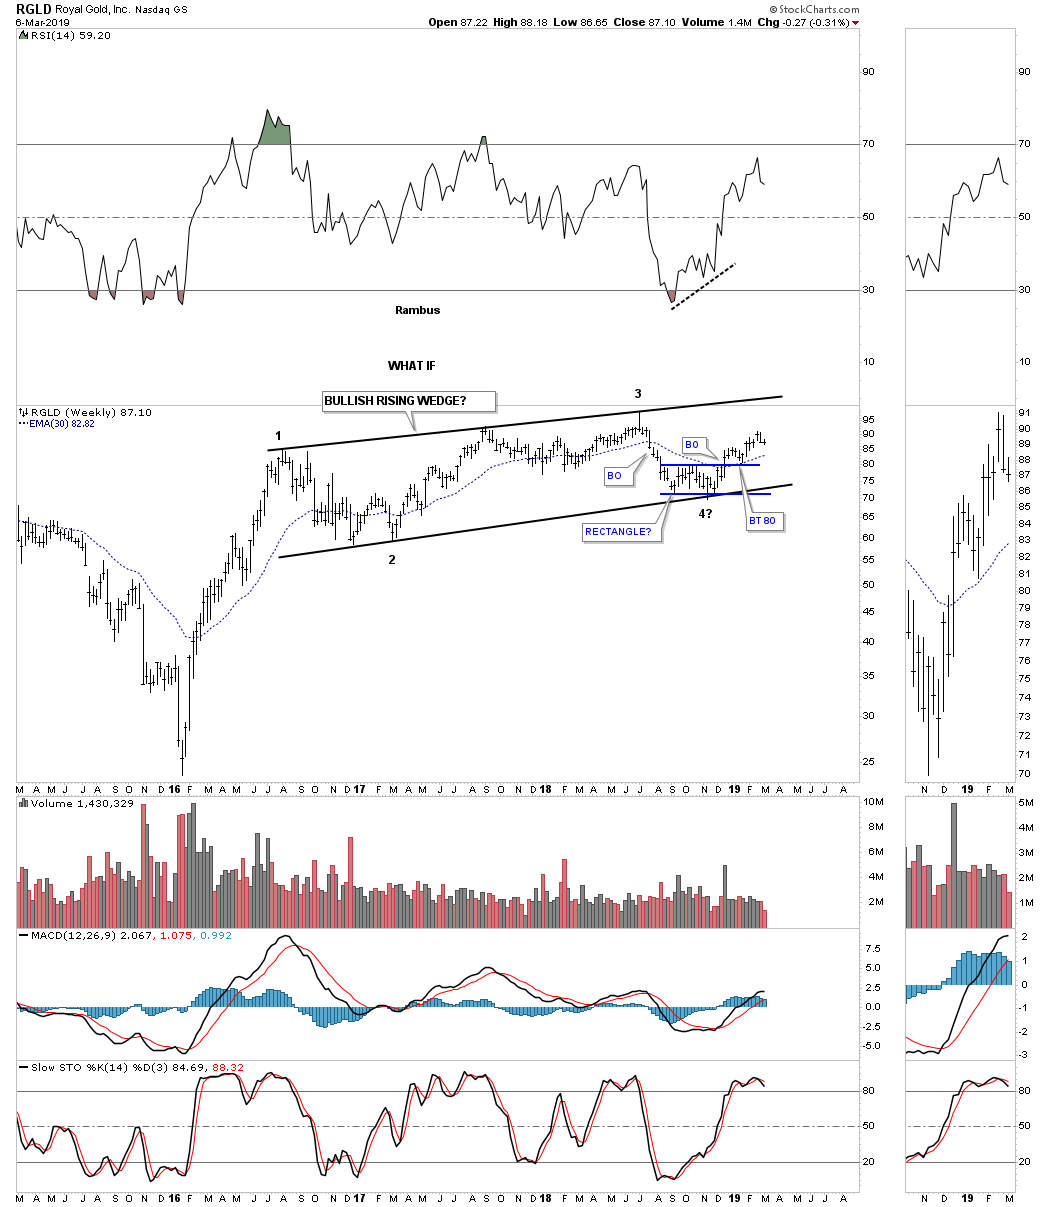
RGLD is another precious metals stock that leads the rest of the PM stocks higher. It too has a WHAT IF possible bullish rising wedge. Note the blue rectangle that formed at the fourth reversal point.
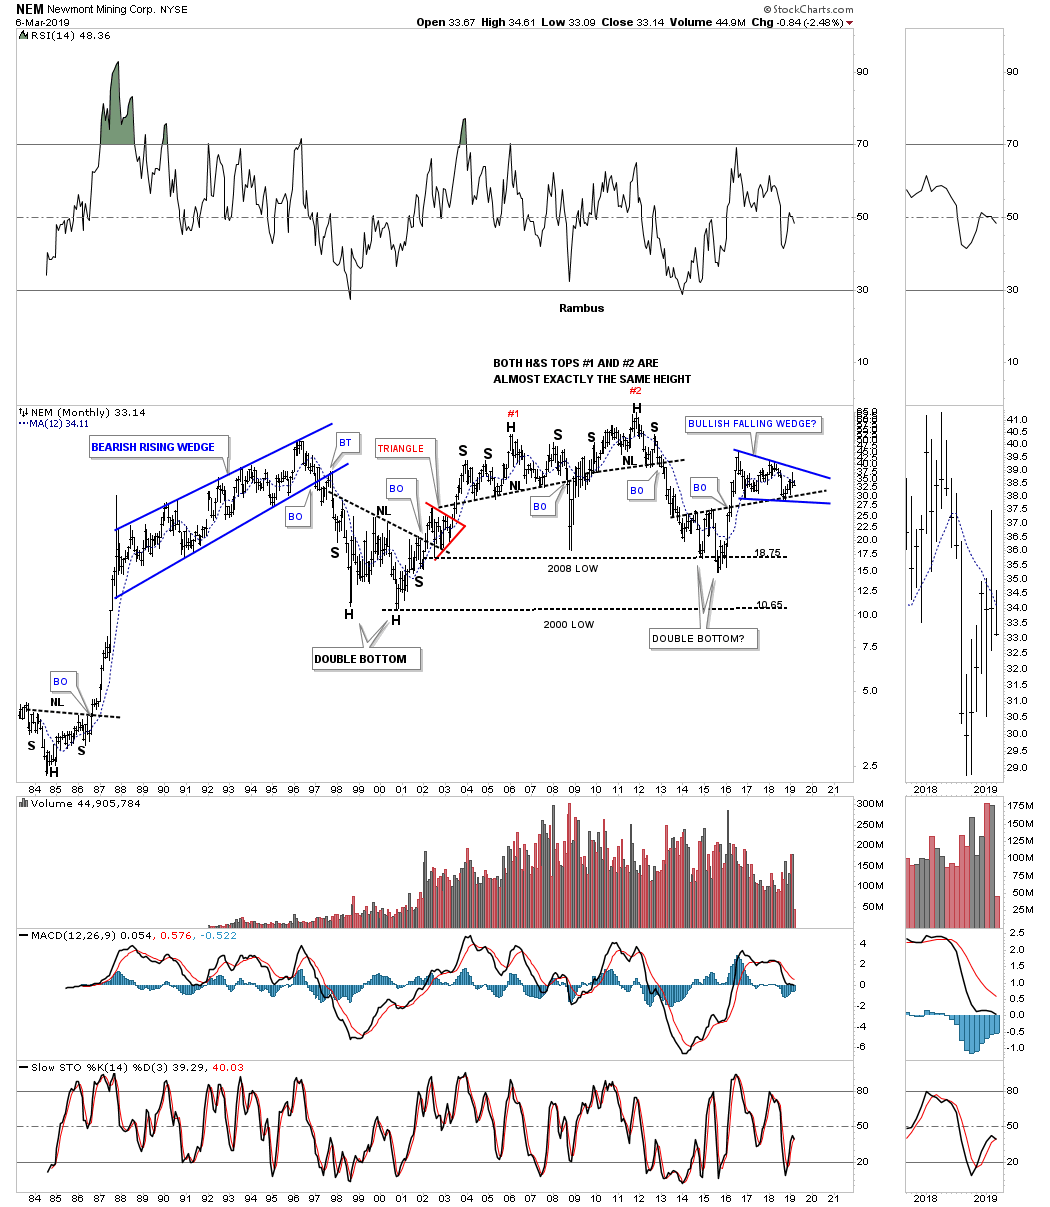
This long term monthly chart for NEM shows its been building out its 2016 falling wedge but unlike a lot of PM stocks it hasnt been able to rally up to the top rail and is showing relative weakness.
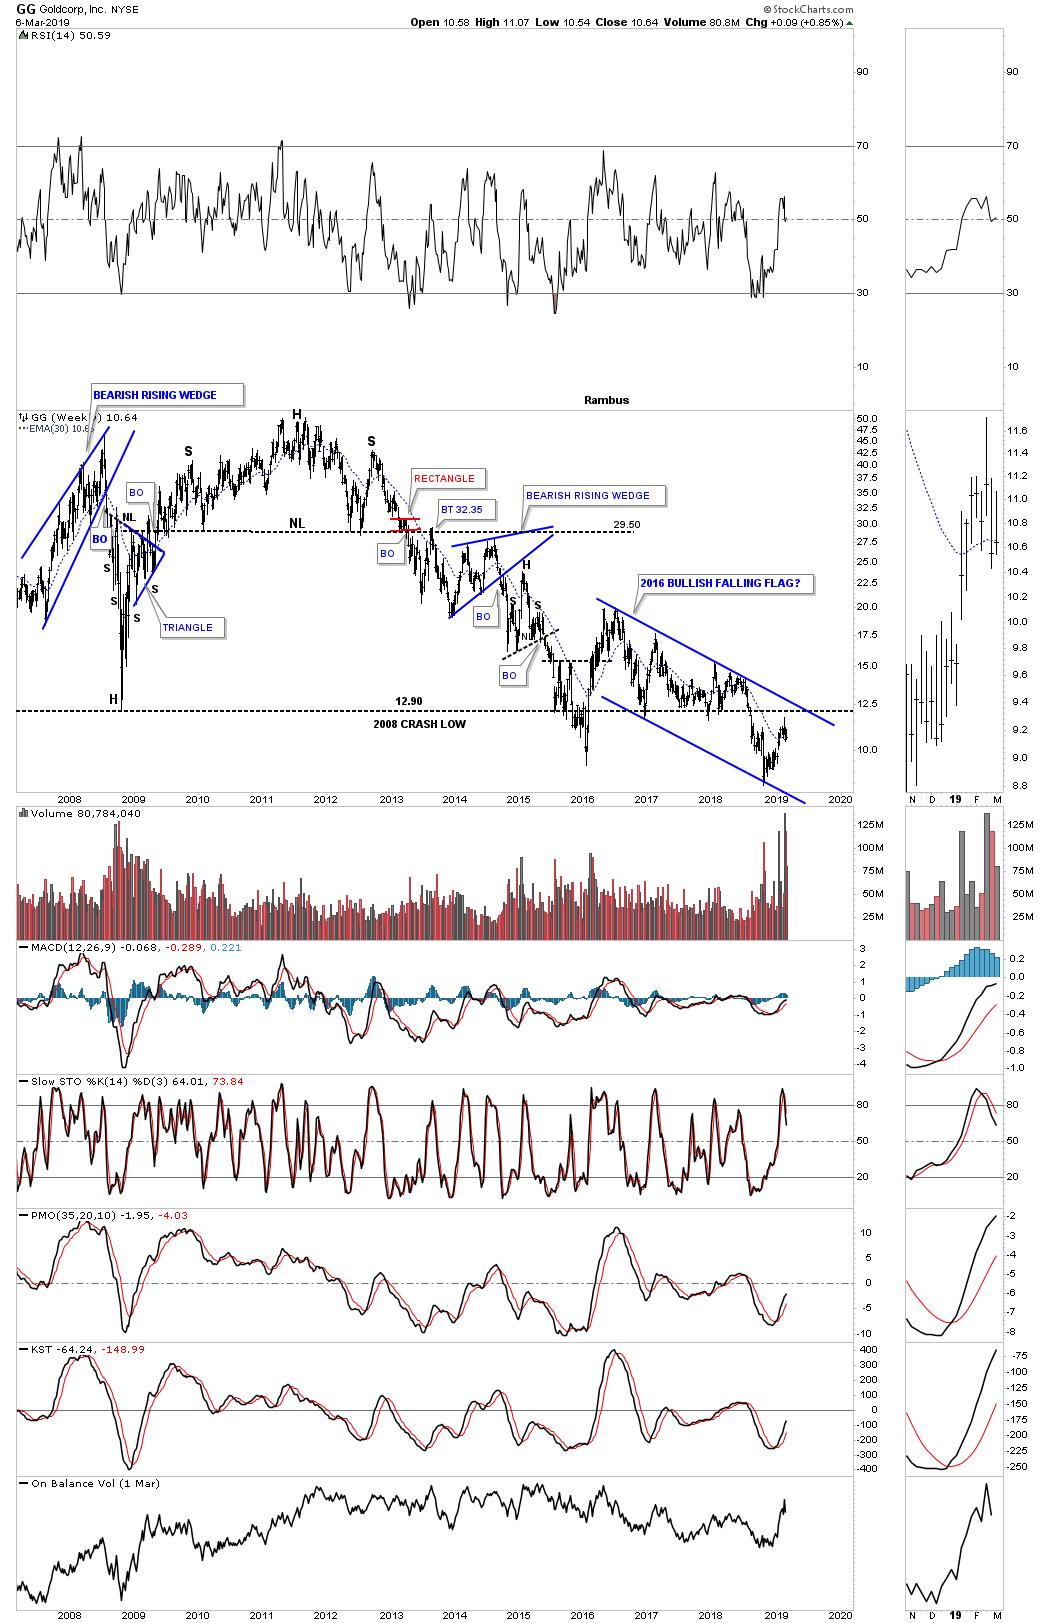
GG is one of the biggest dogs in the big cap precious metas stocks areas as its still trading below its 2008 low.
What these PM stocks above show is that there are some bright spots within a sea of mediocrity. The leaders will lead the way as they always do and the rest will move when their time is right. I know it feels like one needs to be fully invested but there are going to be many new buy signals when we see the top rails of those 2016 trading ranges begin to give-way. If one is a long term investor then you can sit tight but for most of us mere mortals sitting tight can be very difficult when we see our profits slowly slipping away. I think the name of the game right now is patience and let some of the PM stocks that have had a strong run out of the October low to consolidate those gains. There is nothing I can see right now that calls into question that the next leg up in the bull market that began late last year is in trouble.
All the best
Rambus
| Digg This Article
-- Published: Thursday, 7 March 2019 | E-Mail | Print | Source: GoldSeek.com


