-- Published: Monday, 11 March 2019 | Print | Disqus
By: David Chapman
20,000 jobs vs. 55,900 jobs. That was the stark difference between the U.S. nonfarm payrolls and the Canadian job numbers for February. Given Canadas population is only about 1/10th that of the U.S. it would be like Canada created 559,000 jobs in February. For the U.S. Fed it gives meaning to their patient approach. To the BofC it gives pause to any thoughts of lowering interest rates. As to the unemployment rates the U.S. rate (U3) fell to 3.8% from 4% while the Canadian unemployment rate remained unchanged at 5.8%. But not the difference in the labour force participation rate. For the U.S. it was unchanged in February at 63.2% while in Canada it rose slightly to 65.8% from 65.6%. The higher the participation rate the higher the unemployment rate. For the record in the U.S. the U6 unemployment rate fell to 7.3% from 8.1% while the Shadow Stats unemployment rate www.shadowstats.com fell to 21.1% from 21.8%. Not surprisingly those not in the labour force in the U.S. rose to 95,208 thousand from 95,010 thousand.
With the Euro zone, Japan and China all showing signs of slowing it is not surprising as well we are seeing signs of slowing in the U.S. and Canada. In the U.S. the real merchandise trade deficit just hit record levels as both annual and Q4 deficits were the deepest in history. Q4 housing starts were revised sharply lower. Given the trade deficit and the slowing housing market expect a sharp downward revision in Q4 GDP. The Baltic Dry Index (BDI) a measurement of shipping activity around the world is at its lowest level since 2016. It is signaling a global slowdown in trade. Canadas housing market is also experiencing a slow down as housing starts plummet across the country and prices continue to soften. Canada also experienced a widening trade deficit. In the U.S. a widening trade deficit is not what President Trump wants.
As well a strong U.S. dollar is not what President Trump wants either. But this past week the US$ Index jumped to its highest level since December. It backed off on Friday but what it is telling us is that odds favour further gains for the U.S. dollar rather than falling. A run to par (100) is now not out of the question. The Canadian $ gained on Friday following the strong job numbers but the reality is the Canadian $ is not far from its 2018 low of 73.30 (closed Friday at 74.57).
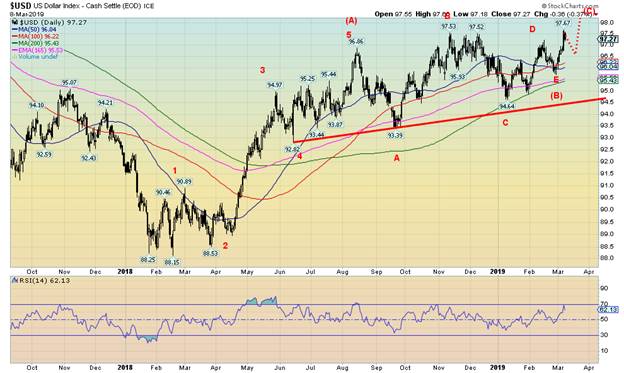
Source: www.stockcharts.com
We have relabeled the US$ Index. The correction since August 2018 now appears as an ABCDE type pattern which we have labeled as wave (B). To come is wave (C) up that should take the US$ Index to at least par (100). All this is against a backdrop of an overly optimistic US$ and a depressive Euro. The breakdown point remains at 94.50.
The reaction of the markets on Friday to the February nonfarm payrolls was in the end rather muted. The markets had been falling all week but Fridays action saw the stock markets fall only to reverse and come back to almost unchanged on the day. But overall stock markets were down on the week. We also note divergences such as the sharp fall in the Dow Jones Transportations (DJT) while the NASDAQ made new highs for the move but other indices did not.
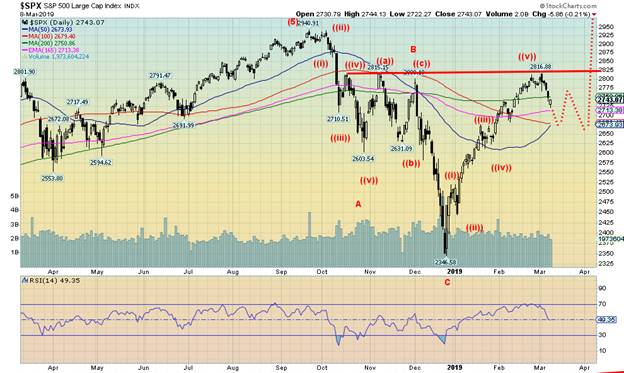
Source: www.stockcharts.com
The S&P 500 along with the other stock market indices stopped short of a major breakout that would have suggested a run to new all-time highs. Remember DJI 30,000? Well it is still alive. The S&P 500 along with the other indices could form the right shoulder of a potential head and shoulders bottom. After that a breakout above 2,825 could project up to around 3,300. Key is the S&P 500 does not breakdown under 2,600. The five wave up pattern from the December low has forced to reassess just where we are and the conclusion we came to is that the stock indices could still run to new all-time highs. But we emphasize the S&P 500 must hold above 2,600 or potentially all bets are off.
Gold benefitted from the poor economic numbers seen on Friday but at the end of the week all gold could do was remain flat on the week. Silver managed to eke out a small 0.6% gain. Our view on gold hasnt changed. After hitting a peak near $1,350 our expectations are a corrective period that could last into May and gold fall to around $1,250 with a worst case scenario down to $1,220. That would fit with a stronger US$. Nonetheless gold after falling from $1,350 to near $1,280 is due for a rebound. We note improvement in the commercial COT this week suggesting the commercials have knocked back on their short positions although they didnt really add to their long positions. A gold rebound could take gold back to around $1,320 before it resumes its down trend. Once this correction is out of the way our expectations are that gold should embark on a multi month rally that should take it past $1,400 and up towards $1,500.
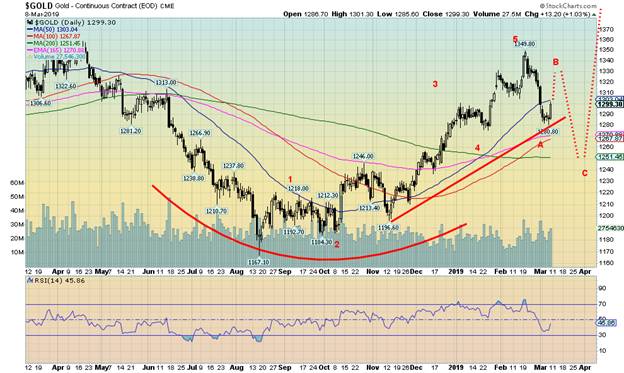
Source: www.stockcharts.com
Thats it for this week. Have a great week! We will return with a full report next weekend.
D.C.
TECHNICAL SCOOP
E-Commentary
Charts and commentary by David Chapman
Chief Strategist, Enriched Investing Inc.
Phone: 416-523-5454 Email: david@davidchapman.com
dchapman@enrichedinvesting.com


