-- Published: Sunday, 17 March 2019 | Print | Disqus
By: DAVID Chapman
The most important of these rules is the first one: the eternal law of reversion to the mean (RTM) in the financial markets.
John C. Bogle, The Clash of Cultures: Investment vs. Speculation investor, business magnate, philanthropist, founder CEO Vanguard Group, 19292019
No amount of observations of white swans can allow the inference that all swans are white, but the observation of a single black swan is sufficient to refute that conclusion.
David Hume, Scottish Enlightment philosopher, historian, economist and essayist, 17111776
First, it is an outlier, as it lies outside the realm of regular expectations, because nothing in the past can convincingly point to its possibility.
Nassim Nicholas Taleb, The Black Swan: The Impact of the Highly Improbable, essayist, scholar, statistician, former trader, risk analyst, b. 1960
Black swans. Attributing sudden and often catastrophic events to such a beautiful bird seems grossly unfair. But panics, manias, crashes, and collapses are like a thunderstorm on a sunny summer afternoon: they are unpredictable, and usually have severe and widespread consequences. Yet we largely ignore their possibility.
But they happen with frequency. Just because we havent had a big one recently doesnt mean that one couldnt hit us at any time. It is nearly impossible to list all of the black swan events that have taken place in history. But they date back to ancient times and include both natural and financial disasters. Some change the course of history and set the course for eventual financial, economic, and societal collapse. Think of the arrival of the Europeans in North and South America starting in the 16th century.
Over two centuries later, the native populations of North and South America had been decimated by 90% and their societies were either gone completely or subjugated by the Europeans. Even into the 20th century the Europeans continued to subjugate the native populations.
From a financial standpoint, a few black swan events stand out in ancient times, with one in particular having far-reaching consequences. In 64 AD the Emperor Nero debased gold, silver, and copper coinage. This acted as an indirect tax on Roman savers, sparking inflation and contributing to the impoverishment of many, particularly in the lower classes. What is important here is that the devaluation tactic was used repeatedly by other Roman emperors over the next three centuries, leading to the decline and collapse of the Roman Empire. Neros debasement of Roman coinage was not expected, but such was the power of emperors in the Roman Empire.
Debasement of money is a theme that has played itself out time and time again. The Chinese were the first to use paper money, dating back to the Tang Dynasty (618907 AD). But, looking back, it was probably no surprise that the ability to print money led to hyperinflation over a long period of time and through many Chinese dynasties. By 1455 the Chinese stopped using paper money, but by then it was too late. China retreated into a long period of isolation that left them weak and vulnerable with the arrival of the Europeans that got underway in the 16th century and peaked in the 19th century.
The modern world has seen its share of black swans. On the theme of debasement of money, the closing of the gold window and the uncoupling of gold to the U.S. dollar in August 1971 by President Richard Nixon would have to be considered a black swan event. It led to the debasement of the U.S. dollar and set in motion a money and credit explosion that continues today. As well the former regime of generally fixed rates for currencies centered around gold and the U.S. dollar saw currencies set to float around the U.S. dollar as the worlds reserve currency. Nixon as Nero?
Since 1971 U.S. debt levels have grown from $1.8 trillion in 1971 to over $73 trillion today, a gain of roughly 3,950%. To put that in perspective, the DJI has gone up (before reinvestment of dividends) roughly 2,750%. Gold, on the other hand, has increased by over 3,600%. Monetary and credit growth since 1971 has been unprecedented. Since August 1971 the financial world has been shaken by a series of financial crisis, most of which could be considered as black swan events, although some would be what one would call a grey swan event. Each crisis has been more severe then the previous one. Think of them as a series of financial earthquakes of varying size.
As with Neros decision to debase the currency of the day, Nixons decision to debase the U.S. dollar by ending its connection with gold lingers with us today. The full effects of this decision remain to be seen. After all, it took another four hundred years to complete the collapse of the Roman Empire. After Neros reign, the Roman Empire went through a series of civil wars before the Emperor Vespasian restored order. The Roman Empires period of Pax Romana lasted roughly from the reign of Augustus 27 CE to Marcus Aurelius 180 AD. After that, the empire degenerated into a series of civil wars, ever-changing emperors, currency debasement, and wars on the frontier that continued to the end. There were sporadic periods of stability; however, financial stability never returned.
We have identified 17 financial crises of consequence that have occurred since 1971:
· The financial crisis of 19731974. Technically, this one was triggered by another black swan event, the oil crisis of 1973. One could also say it was augmented by the political crisis with the collapse of the Nixon presidency. The oil crisis had not only short-term effects on global politics and the global economy, but it has had many long-term effects as well. The Dow Jones Industrials (DJI) fell 45% from January 1973 to December 1974.
· The Latin American debt crisis of 1982. As the world economy slipped into recession in the early 1980s as a result of high inflation, Latin American countries such as Mexico, Argentina, and Brazil were unable to pay back their debts. They had gorged on debt in the 1970s and the worlds international banks were only too happy to lend to them. As the crisis deepened, their currencies collapsed and the interest required to service their debt, largely denominated in U.S. dollars, soared. It took years to sort out the collapse and the effects lingered in the Latin American countries for years after. While the stock market suffered, the decline was not as steep as the one seen in 19731974. The final low was made in August 1982. On an inflation-adjusted basis, however, the stock market had fallen almost 73% from its 1966 high before making its final bottom in August 1982.
· The savings and loans crisis of the late 1980s. Thanks to deregulation, savings and loans institutions went on a lending spree. Trouble was they lent long and funded short. As interest rates rose, many became insolvent. Accounting gimmickry as a result of deregulation often helped hide the growing collapse. But what was really going on was a huge Ponzi-like scheme. In the end, some 700 savings and loans companies collapsed and a global recession followed in the early 1990s.
· The junk bond crash of 1989. The financing of takeover deals and mergers in the late 1980s led to the issuance of billions of dollars of junk bonds to finance the deals. The collapse of the $6.75 billion UAL takeover in 1989 was considered a key trigger in the collapse of the market. The junk bond collapse left a path of destruction leading to the bankruptcy of Drexel Burnham Lambert, a large investment dealer. Drexel was the Lehman Brothers of its day. The collapse also contributed to the recession of the early 1990s. Once again, the Fed was required to flood the financial system with liquidity to prevent a wider collapse.
· The stock market crash of October 1987a true black swan event. The Dow Jones Industrials (DJI) fell 508 points or 23%. Program trading had become an in thing, helping to exacerbate the crash. The event led to the introduction of circuit breakers and also set in motion the Fed flooding the financial system with liquidity to prevent a potentially bigger collapse. While the event itself was short-lived and, by the early 1990s the stock market was on its way to record highs, the effects of the crash lingered for years.
· The Japanese financial crisis of 1991. The Japanese stock market and real estate bubble of the 1980s burst in 1991 as the BOJ hiked interest rates to quell the speculation. The result was a collapse in the Japanese real estate market as prices fell as much as 60% and a collapse in the stock market that eventually took it down 80% by 2003. The stock market and real estate collapse sparked a financial crisis as banks became technically bankrupt while the Japanese government kept them artificially alive, giving rise to the phrase zombie banks. The result was a prolonged economic recession that became known as Japans lost decade. The effects linger today despite years of the BOJ keeping interest rates artificially low and the injection of huge amounts of liquidity into the financial system. The stock market remains down 45% from its 1991 peak.
· The Mexican peso crisis of 1994. This was also known as the Tequila crisis. The crisis was triggered by President Ernesto Zedillo reversing a policy of tight currency controls that had been in place. It was exacerbated by the lending of huge amounts of money at below-market rates to spur economic growth. A rebellion in the southern state of Chiapas helped push the Mexican peso into a free fall, losing 50% in a week. The U.S. government had to step in with a $50 billion loan. But the impact was felt across Latin America as bond yields soared and debt defaults grew. Once again, the Fed had to step in to prevent a wider crisis as the collapse threatened U.S. and other global markets as well. The stock market languished throughout 1994 but there was no major collapse.
· The Asian financial crisis of 1997 and 1998. It all started with the collapse of the Thai Bhat in July 1997. Like the Latin American debt crisis of the 1980s, Thailand and other Asian tigers had overextended themselves in foreign loans that they couldnt pay as their currencies crashed. The crisis soon spread to South Korea, Hong Kong, Indonesia, Laos, and Malaysia. This one required a bail-out by the IMF. A year later the crisis repeated itself, only this time it was led by Russia. It led to the collapse of Long-Term Capital Management (LTCM) a large hedge fund led by John Meriwether and featuring Myron Scholes of Black Scholes fame. The collapse of LTCM not only sparked a mini-stock market crash but the Fed once again had to come to the rescue to prevent a meltdown of the financial system. LTCMs ties into the financial world were huge and its collapse could have triggered more collapses. Between the two collapses, international indices suffered far more than those in the U.S. and Canada, with some falling 60% or more.
· The bursting of the dot.com bubble in 20002002. Technology and internet stocks soared in the late 1990s on a wave of easy money provided by the Fed from the 1998 crisis. People became millionaires overnight and obscure technology companies soared to unheard-of levels. The fact that hardly any of them made money was beside the point. But the bubble burst as all bubbles do, and the collapse was a spectacular as the rise. The NASDAQ fell 78% by 2002, almost equalling the collapse of the DJI in 19291932 when it fell 89%. Many companies went bust and disappeared. Names like Pets.com and Boo.com may have been the esoteric names that went bust, but it was the big companies such as WorldCom, Global Crossing, Nortel Networks, and Enron that became synonymous with the collapse.
· 9/11. This was a true black swan event as planes hit the Twin Towers of New Yorks World Trade Center and later the Pentagon on the morning of September 11, 2001. It triggered a shutdown of the stock exchanges. When they opened, they were down by only about 12% but an estimated $1.4 trillion was wiped out in the five days the exchanges were closed. Its lasting effect was the triggering of ongoing wars in Afghanistan, Iraq, Libya, Syria, and elsewhere. These wars have cost the U.S. an estimated $2.5 trillion, an amount that is still growing. The 9/11 event also left failed states in its wake.
· The global financial crisis of 20072009. As with other crises, the Fed and central banks around the world flooded the financial system with liquidity and lowered interest rates after the dot.com collapse. This helped trigger the housing bubble. The crisis started with the bursting of the sub-prime mortgage market and the collapse of a couple of hedge funds at NY investment dealer Bear Stearns. It eventually led to one of the biggest collapses in history when NY investment dealer Lehman Brothers collapsed in September 2008, throwing 25,000 out of work. Lehman Brothers was saddled with $619 billion in debt. Stock markets globally collapsed and the Fed and other central banks were forced again to come to the rescue with the greatest bail-out in history. The stock market collapse was the worst seen since the Great Depression, wiping over $10 trillion out of global equity markets. The DJI fell 55%. The collapse was so severe that without the help of the Fed and U.S. Treasury, along with the BOE, the BOJ, and the ECB rescue packages, the global financial system could have collapsed. Interest rates were reduced to zero and eventually, in the eurozone and Japan, sub-zero. Housing markets collapsed, not only in the U.S., but in a number of other countries as well. The effects of the 2008 financial collapse linger with us today. In the end, its causes were not fully addressed, thus setting the stage for another financial crisis at some point.
· The European sovereign debt crisis in 2011. In many respects, this crisis was an aftermath of the 2008 financial crisis. High debt countries in the eurozone like Greece, Portugal, Spain, and Ireland were severely hurt by the 2008 financial crisis. Germany was unable (or unwilling) to fund these countries out of their debt. A collapse of these countries, including some leaving the eurozone could have triggered a global financial crisis comparable to the 2008 collapse. This time it was the ECB who were forced to come to the rescue with loans, sub-zero interest rates, and effective bail-outs to prevent a collapse. The eurozone has been in a state of almost permanent recession ever since and the debt crisis lingers, now encompassing larger countries such as Italy.
· The gold crash of 2013. Gold had enjoyed a strong 10-year run to the upside, rising from roughly US$250 in 2001 to a peak of over US$1,900 by September 2011. The rescue of the global economy in 2008 and again with the euro crisis of 2011 had led to the feeling that the worst was over. Many felt gold had in the end been in a speculative bubble. After trading in a range between $1,500 and $1,800 through 2012 the collapse got underway in the morning of April 12, 2013 when someone offered 400 metric tonnes of gold for sale on the open. Prior to that both Germany and Venezuela had requested repatriation of their gold from the Fed and the BofF. When Germany was told it would take seven years to deliver their gold an uneasy sense developed that there was a bullion bank in trouble. When the dust cleared, gold had fallen to US$1,045 by December 2015, a loss of 46% from the top. Gold stocks suffered even more with many falling 80% or more. Many junior exploration companies fell over 90%. Gold remains down today roughly 32% from the 2011 top.
· Black Monday China August 2015. With cheap money readily available, a stock market bubble developed in China. The Shanghai Index (SSEC) had soared 180% from 2013 to 2015. While that wasnt as much as it had soared from 2005 to 2007, it was still a significant bubble that developed. As with so many other crises, Chinese companies had borrowed extensively to finance the speculation. The trigger was an unexpected devaluation of the yuan, leading to a stock market crash on August 8, 2015 when the exchanges fell about 10%. Three weeks later they were down 30%. One of the prime reasons for the devaluation of the yuan was the collapse of oil prices in 2014. The oil price collapse was triggered by a global glut of oil aided by the shale oil boom in the U.S. Global trade withered as result, negatively impacting Chinas manufacturing exports. Oil prices fell roughly 77% between 2013 and 2016. The Chinese tried to balance the situation by devaluing the yuan. But that sparked a debt crisis because much of the borrowing by companies was in U.S. dollars, thus making it more expensive for them to repay their loans. The Chinese crisis, coupled with the end of quantitative easing (QE), the collapse in oil prices and culminating in Brexit, sparked a stock market collapse that saw the DJI fall roughly 15% from May 2015 to February 2016. Considering all the turmoil, the stock market decline in North American markets was actually fairly muted.
· Brexit June 2016. This one is ongoing and could be leading to an economic disaster for the United Kingdom and even the EU if a hard Brexit occurs at the end of March 2019. The latest attempt to get a deal through the U.K. parliament has failed. In the aftermath of the unexpected result in June 2016 (a black swan event), the pound sterling plunged to a 31-year low against the U.S. dollar. As noted, the long-term economic impact of Brexit remains undetermined as this is an ongoing event. The U.K. could now be seeking an extension, but they need the approval of the EU.
· The bursting of the cryptocurrency market December 2017. Bitcoin and the cryptocurrencies had become the new in-thing. Bitcoin had soared over 19,000% into 2017 rising from around $100 in 2013 to a peak of $19,891 in December 2017. Other cryptocurrencies rose even more. The bubble was being compared to Tulip Mania of 1637, however, not even tulip prices rose that fast. People who got in early became over night millionaires even billionaires. The number of cryptocurrencies being offered soared. The bubble burst when the CBOE and the CME offered the listing of Bitcoin futures, thus allowing investors to short Bitcoin on a large scale. Today Bitcoin sits down 80% from its peak and many cryptocurrencies are down over 90% while others just disappeared. Regulators are circling the cryptocurrency market and many crypto exchanges have crashed leaving investors with nothing. The bursting of the cryptocurrency market was one of the most spectacular in history.
· The Trump tariffs crisis of 2018. The imposition of tariffs by the Trump administration got underway in January 2018. It may have started with solar panels and washing machines but it quickly spread, impacting many countries including Canada, Mexico, and the EU. The tariffs spread later to China. Countries retaliated. The stock market was shaken and fell 12% from January to April 2018. The second round of tariffs shook the markets more as they collapsed to upwards of 20% from October to December 2018. The tariffs wars are ongoing and the U.S. and China remain in negotiation. But, given the uncertainty of the Trump administration, things could go from working towards a solution to a collapse very quickly.
Left out of this are natural disasters that have occurred, many of which have had longer lasting effects. The great Indian Ocean earthquake of 2004 resulted in a massive tsunami, causing only $15 billion in damage but killing an estimated 220 thousand. The earthquake had the energy of 23,000 Hiroshima-type atomic bombs. Another notable disaster was the Fukushima nuclear disaster of 2011. That was also triggered by an earthquake and tsunami.
These two were the most notable, but the world may only be beginning to see the effects of the disasters triggered by global warming as hurricanes become more intense and destructive, and killer heat waves become normal during the summer. The heat waves have triggered thousands of deaths and huge destructive forest fires and droughts. The potential for earthquakes to hit large population centres, particularly in the ring of fire that includes the West coast of Canada and the U.S., is a constant concern. The destruction of a major U.S. city from either a hurricane or earthquake would have wide-ranging financial and societal effects. Given the growing severity of events from global warming, the long-term financial and societal effects are still unknown.
It is difficult to predict where the next financial crisis will come from. The history since 1971 suggests a financial crash or crisis occurs roughly every 2.6 years. Since the 2008 financial crisis we have seen at least five, although none of them have been on the scale of what happened in 2008. Since the crises got underway, starting with the financial crisis of 19731974, the Fed and the central banks have generally led the way in bailing out the financial system. Given the massive levels of global debt the world is facing (estimated at $250 trillion, up $100 trillion since 2008), an unexpected event could spark another financial crash on the scale of 2008. Except this time the Fed and the worlds central banks are handicapped in bailing out the financial system. They are running out of bullets. In its place the EU, the U.S., Canada, and Japan have put in place bail-in legislation. What that means is that depositors and bond holders of the banks are at risk of being turned into stock owners, stock that might have little or no value.
Trying to identify where the next unexpected black swan might come from is difficult. We cite the following:
· A banking crisis in the EU triggered by either the Brexit or the collapse of the Italian banking system. A collapse in the United Kingdom and the EU could quickly spread into a global financial crisis. The EU earlier faced a crisis over Greece, Spain, and others. Italy is one of the worlds largest economies and a banking collapse and default there would have global repercussions. Many cite the potential for the collapse of Deutsche Bank, the worlds 15th largest bank as a possible trigger. The German government is trying to engineer a merger between Deutsche Bank and Commerzbank, Germanys 2nd largest bank to strengthen the two. The latest Brexit deal has been rejected by the U.K. parliament. Now what? A hard Brexit, a vote to delay, a second referendum that would today see the Brexit vote of 2016 reversed, the collapse of the May government or something else all together?
· A collapse of the shadow banking system in China. Like the Latin American crisis and the Asian financial crisis, Chinese companies are heavily indebted in U.S. dollars. As the Chinese economy slows, a debt collapse could be triggered. It could be one that PBOC cant fully control. A collapse in China could quickly spread globally, triggering a potential larger financial collapse. Chinas real estate market would also collapse.
· A U.S. state and local governments debt crisis could have far reaching effects. U.S. states and municipalities have debt totalling $3.1 trillion. The most severe debt problems are in states such as California, Illinois, and New Jersey. Add in the growing debt problems with student loans and car loans and we could find ourselves in another Bear Stearns moment when some fund is shut down because their asset base has collapsed. A debt crisis could spread to a still shaky banking system despite shoring up of capital from the 2008 financial crisis. The U.S. deficit is also sharply rising now exceeding $1 trillion annually as the debts of war pile up. Attempts to cut Medicare, Medicaid, or Social Security could trigger a severe backlash. There is also the question of underfunded pension funds estimated to be at least $6.3 trillion and unfunded liabilities of Medicare and Social Security totalling at least $123 trillion. Finally, there are dozens of U.S. corporations leveraged up, many of them currently barely investment grade. Downturns could quickly turn them into junk bonds and funds would have to dump them. As the economy slows, a debt-laden country is highly vulnerable to a financial collapse.
· Can an outbreak of war be a black swan? The start of WW1 triggered the closure of stock exchanges in Europe which led to the closure of the NYSE. While initially stock prices fell, they quickly found a bottom in November 2014. 1915 was the best one-year stock market in DJI history, rallying largely on the back of the manufacturing boom created by the war. After topping in November 1916, the stock markets panicked again when the U.S. entered the war. By December 1917 the DJI was down over 40%. Stock markets fell when WW2 broke out in September 1939. The bombing of Pearl Harbour sparked a panic and the final bottom wasnt seen until April 1942 with the DJI down 40%. War can spark a stock market crisis. The hot spots are India/Pakistan, Iran, Venezuela, and North Korea.
We dont pretend to know where the next financial crisis will come from or how it will unfold. If the talks between China and the U.S. fail, that might be a trigger. China is slowing down and, like debt crises in the past, their companies are overextended in U.S. dollar-denominated loans. Another sudden devaluation of the yuan by China could also trigger a financial collapse, although they probably learned their lesson in 2015. The 2008 financial crisis started small when some hedge funds failed in July 2007. The sudden failure of a large hedge fund now could trigger a wider collapse. The trouble is, the central banks ammunition to combat a financial crisis has been severely compromised. In the last financial crisis, the Feds balance sheet exploded to over $4 trillion from $800 billion. Now they have been trying to pay down that huge overburdened balance sheet, one that has its share of debt that is highly doubtful. We also note that the Fed is technically bankrupt as financial statements showed that losses in their value of their bonds was $66.5 billion. The Feds capital is only $39 billion. In a slowing economy, they have had to now announce they will slow down or stop their paydown of the balance sheet. What message does that send?
The reality is, with $250 trillion of debt outstanding in the world, the global financial system is on a hair trigger that could be set on fire at any time. The global economy is starting to slow down and when that happens, the skeletons usually come out of the closet. The fact that it hasnt happened is meaningless because when it does happena month from now, six months from now, or a year or more from nowthe financial devastation could be worse than 2008. We are but one black swan event away from a unknown financial collapse.
MARKETS AND TRENDS
| | | % Gains (Losses) Trends |
| Close Dec 31/18 | Close Mar 15/19 | Week | YTD | Daily (Short Term) | Weekly (Intermediate) | Monthly (Long Term) | |
Stock Market Indices | | | | | | | | |
S&P 500 | 2,506.85 | 2,822.48 | 2.9% | 12.6% | up | up (weak) | up (topping) | |
Dow Jones Industrials | 23,327.46 | 25,848.37 | 1.6% | 10.8% | up | up | up (topping) | |
Dow Jones Transports | 9,170.40 | 10,310.12 | 1.9% | 12.4% | up (weak) | down (weak) | up (topping) | |
NASDAQ | 6,635.28 | 7,688.53 | 3.8% | 15.9% | up | up (weak) | up (topping) | |
S&P/TSX Composite | 14,322.86 | 16,140.35 | 0.9% | 12.7% | up | up | up | |
S&P/TSX Venture (CDNX) | 557.20 | 627.77 | 1.6% | 12.7% | up | down (weak) | down | |
Russell 2000 | 1,348.56 | 1,553.53 | 2.1% | 15.2% | up (weak) | neutral | up (weak) | |
MSCI World Index | 1,710.88 | 1,888.76 | 2.7% | 10.4% | up | neutral | neutral | |
NYSE Bitcoin Index | 3,769.99 | 3,886.31 | (0.1)% | 3.1% | up | down | neutral | |
| | | | | | | | |
Gold Mining Stock Indices | | | | | | | | |
Gold Bugs Index (HUI) | 160.58 | 169.38 | (0.4)% | 5.5% | up (barely) | up | down (weak) | |
TSX Gold Index (TGD) | 186.74 | 193.42 | (0.9)% | 3.6% | up (weak) | up | neutral | |
| | | | | | | | |
Fixed Income Yields/Spreads | | | | | | | | |
U.S. 10-Year Treasury yield | 2.69 | 2.59 | (1.2)% | (3.7)% | | | | |
Cdn. 10-Year Bond yield | 1.96 | 1.76 | (0.6)% | (10.2)% | | | | |
Recession Watch Spreads | | | | | | | | |
U.S. 2-year 10-year Treasury spread | 0.21 | 0.16 | (5.9)% | (23.8)% | | | | |
Cdn 2-year 10-year CGB spread | 0.10 | 0.10 | flat | (16.7)% | | | | |
| | | | | | | | |
Currencies | | | | | | | | |
US$ Index | 95.73 | 96.05 | (1.3)% | 0.3% | neutral | up | neutral | |
Canadian $ | 0.7350 | 0.7509 | 0.7% | 2.2% | down | down | down | |
Euro | 114.58 | 113.19 | 0.8% | (1.2)% | down (weak) | down | neutral | |
British Pound | 127.50 | 132.85 | 2.1% | 4.2% | up | up | neutral | |
Japanese Yen | 91.24 | 89.68 | (0.1)% | (1.7)% | down | neutral | neutral | |
| | | | | | | | |
Precious Metals | | | | | | | | |
Gold | 1,281.30 | 1,302.90 | 0.3% | 1.7% | down (weak) | up | up | |
Silver | 15.54 | 15.32 | (0.2)% | (1.4)% | down | neutral | down | |
Platinum | 795.90 | 831.80 | 1.7% | 4.5% | up (weak) | neutral | down | |
| | | | | | | | |
Base Metals | | | | | | | | |
Palladium | 1,197.20 | 1,518.50 | 2.0% | 26.8% | up | up | up | |
Copper | 2.63 | 2.91 | 0.7% | 10.7% | up | up | up | |
| | | | | | | | |
Energy | | | | | | | | |
WTI Oil | 45.41 | 58.52 | 4.4% | 28.9% | up | down (weak) | up (weak) | |
Natural Gas | 2.94 | 2.80 | (2.4)% | (4.8)% | neutral | down | neutral | |
Source: www.stockcharts.com, David Chapman
Note: For an explanation of the trends, see the glossary at the end of this article.
New highs/lows refer to new 52-week highs/lows.
Source: www.stockcharts.com
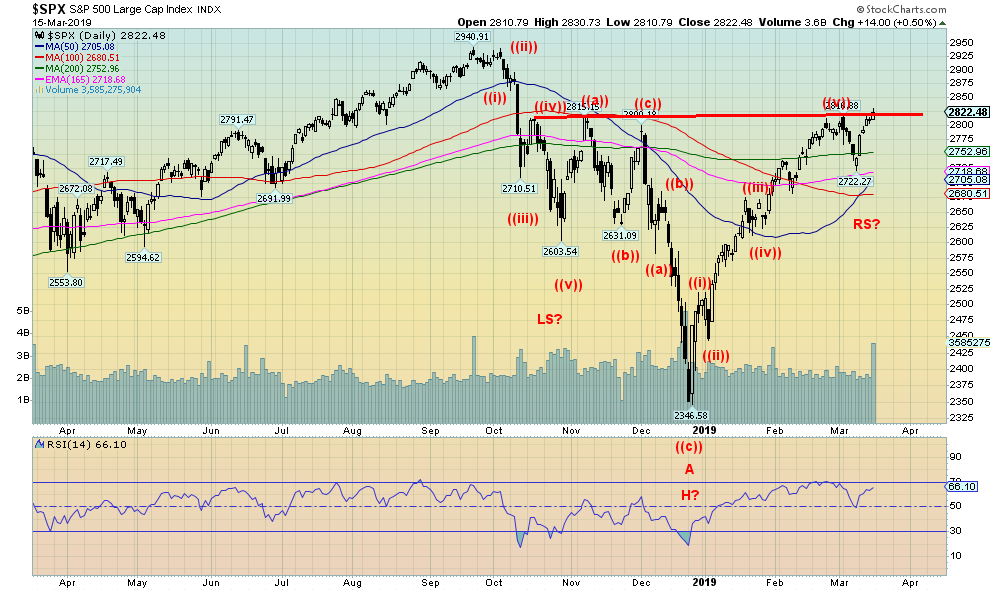
Wither the S&P 500? Will it break out? Or rollover and fall? This past week the S&P 500 gained 2.9%. Other indices were also up. The Dow Jones Industrials (DJI) was up 1.6%, the Dow Jones Transportations (DJT) gained 1.9% while the NASDAQ jumped a healthy 3.8%. The small cap Russell 2000 was up 2.1%. Elsewhere the TSX Composite gained 0.9% while the junior TSX Venture Exchange (CDNX) was up 1.6%. All indices continue to be up over 10% on the year. Internationally, the London FTSE 100 seems to ignore Brexit, gaining 1.9%. On the continent, the Paris CAC 40 was up 3.3% and the German DAX gained 2.0%. In Asia, Chinas Shanghai Index (SSEC) was up 1.8% while the Tokyo Nikkei Dow (TKN) jumped 1.2%. Success all around keeping the bulls alive and well in 2019.
But the S&P 500 is at a key point. Either we break higher here or we fail. 2,825 was considered our breakout point. The high this week was at 2,830. Why 2,825? The Fibonacci 76.4% retracement of the entire down move from the high in October to the low in December is actually at 2,800. But 2,825 represented a resistance line from the small tops in October and November that tied to the recent high seen on March 4, 2019 at 2,817. So, we used 2,825 as a reasonable breakout point that could point to a run to 3,300 for the S&P 500. A breakout over the Fibonacci 76.4% point is considered by technical analysts to be the point where going above it suggests new highs.
The S&P 500 saw a new high this past week but, as we show later, not everyone joined the new high party. The NASDAQ did but the DJI, the DJT and the Russell 2000 did not. A divergence? Well, it is confirmed a divergence if they fail to make new highs. New highs by all the indices confirms the uptrend.
Some have pointed to a potential head and shoulders bottom on the S&P 500 (as well on the other indices) but it is an ill-formed one. A good one would see more backing and filling. The so-called right shoulder had only one shallow thrust to the downside. The left shoulder made two solid thrusts to the downside before breaking down. The left shoulder also made two solid thrusts to the upside that failed. So, the H&S theory is somewhat questionable. If it is a H&S, it also points to a potential target of 3,300. We note that the MACD indicator has turned down. The rally this past week has not turned the MACD up. Instead, its fast-moving moving average is now only testing its slow-moving moving average. A failure we call a kiss and runmeaning the fast-moving MA kisses the slow-moving MA and then returns to the direction it was going in, which in this case is down. The breakdown point is at 2,700.
Source: www.stockcharts.com
Despite the DJI not making new highs along with the S&P 500, we note that both the S&P 500 and the DJI enjoyed strong volume on Fridays up move. DJT and NASDAQ volume also perked up. Could this be the sign that the stock markets are about to burst to the upside? We have talked in the past about a panic run to the upside. While the upswing would definitely be exciting, it would also be one fraught with danger. A breakout of the indices to the upside could spark a buying panic. If that were to happen, then the odds are that once the market tops a sharp downturn would follow. Enjoy the run if it happens but dont forget to exit.
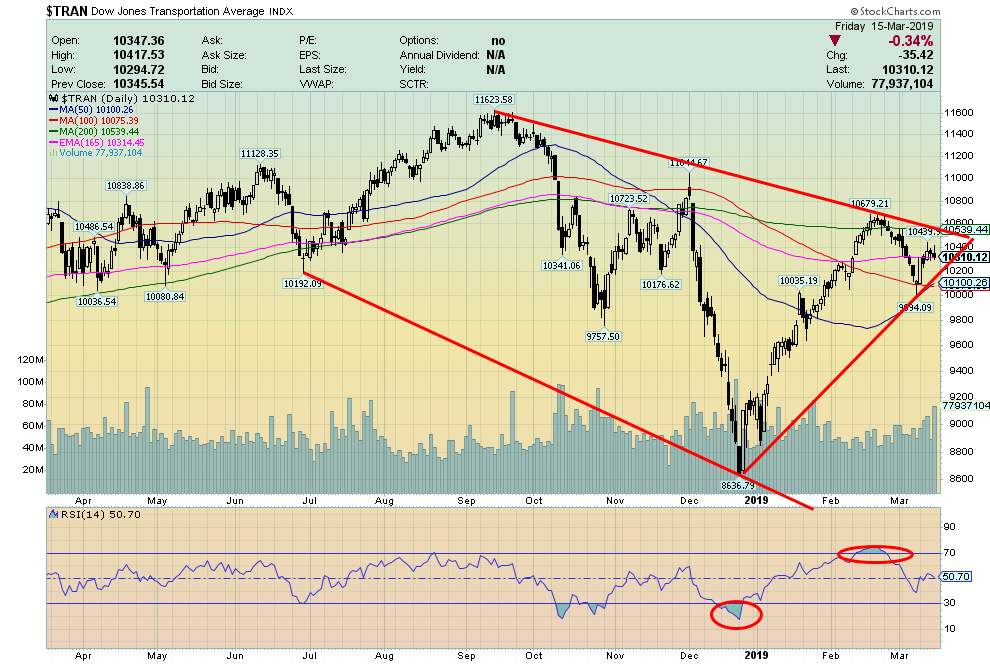
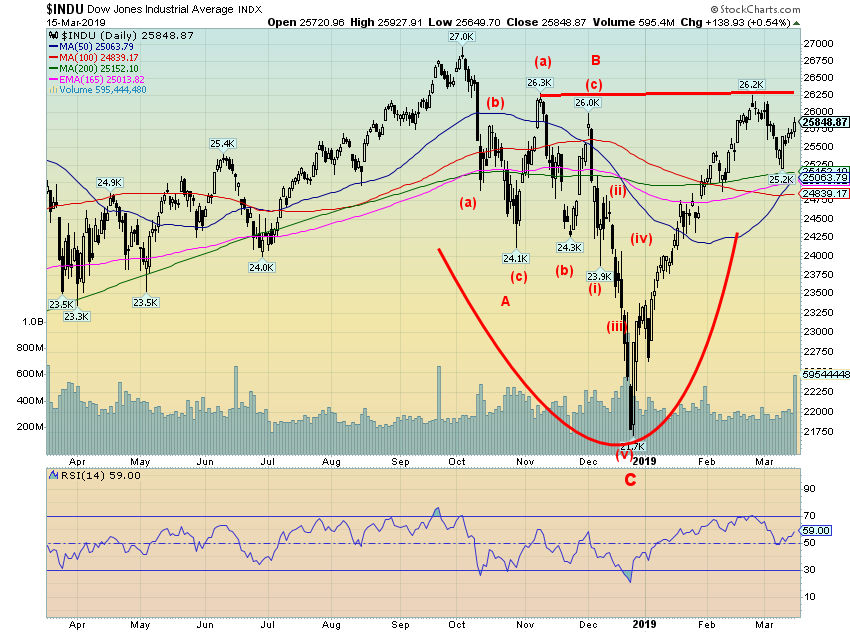
Here is the DJT. It is lagging the DJI by a considerable margin. The DJT is down roughly 1112% from its high while the DJI is only currently off roughly 4%. The classic divergence of the averages not confirming each other would be to see the DJI run to new all-time highs but the DJT fail to make new all-time highs. Watch this one carefully. The DJT is a solid sign of the state of the economy, given its heavy leaning in airlines, railways, trucking, and transportation services. At least the DJT doesnt have Boeing (BA-NYSE) to drag it down. The DJI is being held back currently by the poor performance of Boeing.
Source: www.stockcharts.com
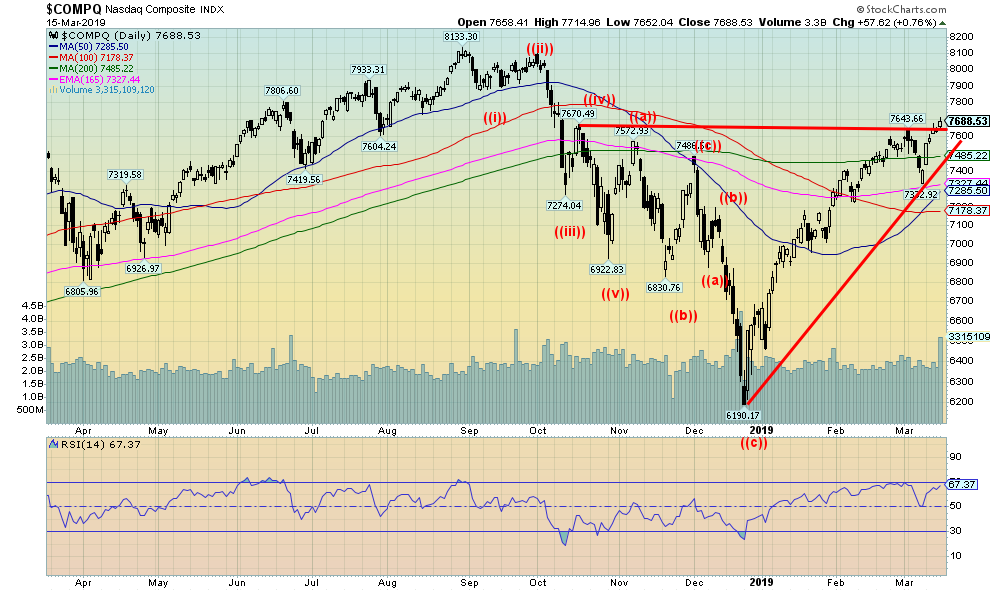
It is probably no surprise that the NASDAQ is once again being led by the FAANGs. The NASDAQ now appears to be breaking out, suggesting a move to new all-time highs. For the record, this year AAPL is leading, up 26.0%. NFLX is up 21.5% and surprisingly FB is up 20.3%, although it pulled back this week because of its problems related to the shooting in New Zealand. Lagging are GOOG up 10.6% and AMZN up 8.7%. All continue to be pointed to the upside, save for FB dipping this past week.
Source: www.stockcharts.com
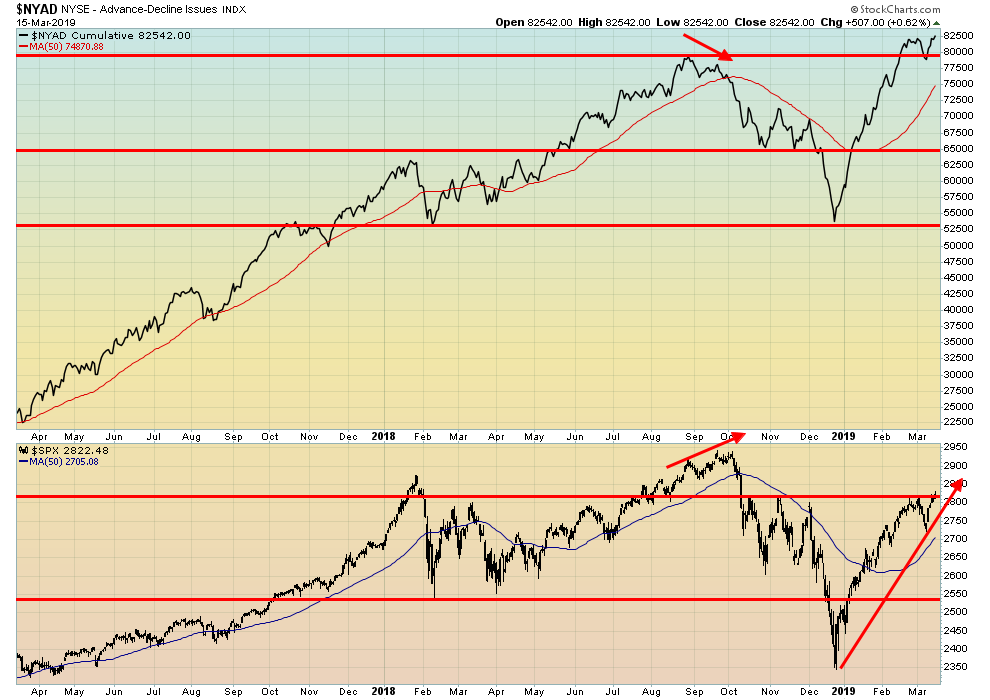
That NYSE advance/decline line continues to fascinate and suggest higher prices for the stock indices. The advance/decline remains in record territory and made new highs again this past week. It all suggests that the indices should catch up and eventually make new all-time highs. As long as the market believes that the U.S./China will kiss and make up, that earnings (while slowing) are still pretty darn good, that the economy may be slowing but the Powell put sits behind it, and that the political noise in the background remains just noisethen the markets should continue to rise. We have some divergence signals at this point, but they could resolve themselves soon.
Source: www.stockcharts.com
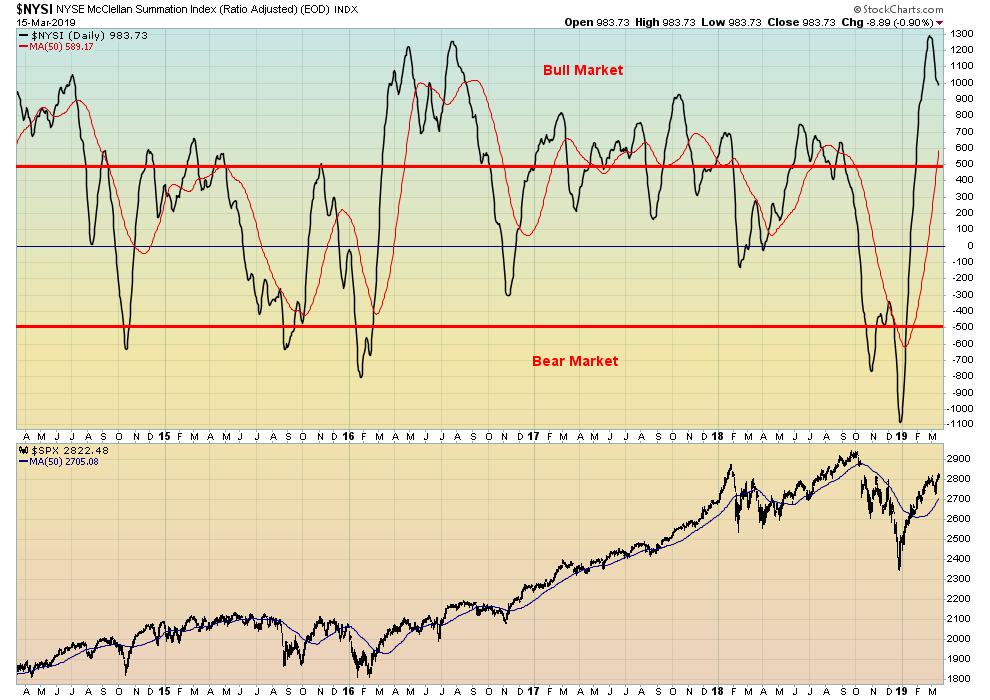
The McClellan Summation Index remains in bull territory. The thrust to the upside was more powerful than the one seen in March 2016. That suggests to us that the market could continue its move to the upside. A move that in many ways doesnt make any sense. But we have seen that picture before. The run-up of the NASDAQ in late 1999 early 2000 never made any sense either and we know how that one ended.
Source: www.stockcharts.com
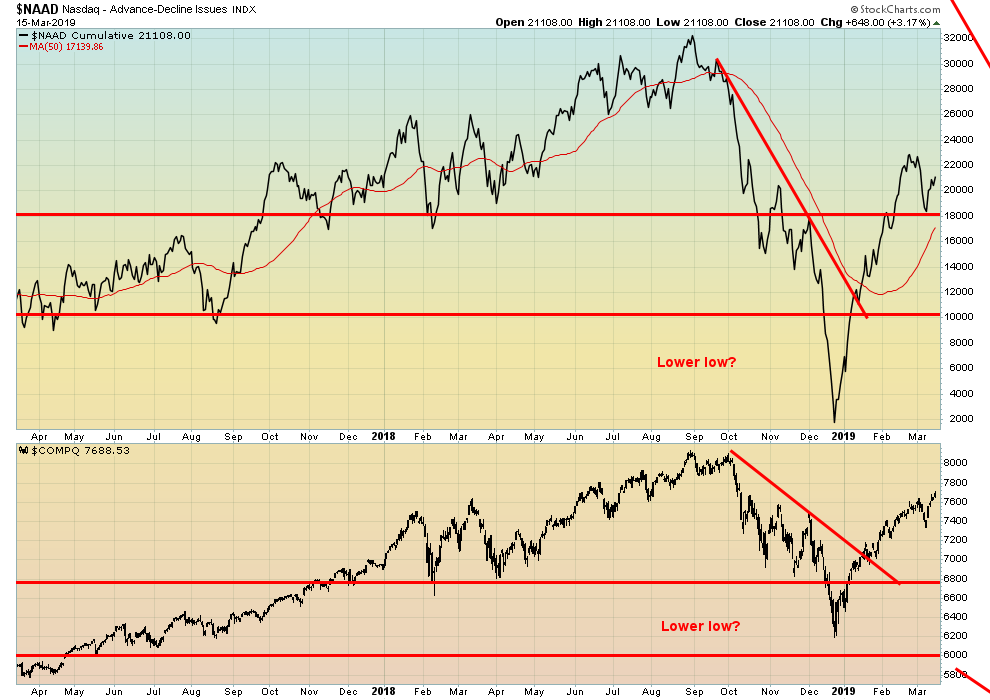
If the NYSE advance/decline is soaring to new all-time highs, then the NASDAQ advance/decline is not. Its nowhere near its old highs. A potential significant divergence? What would be a perfect divergence is the NASDAQ making new all-time highs but the NASDAQ advance/decline not making all-time highs. Keep an eye on this one.
Source: www.stockcharts.com
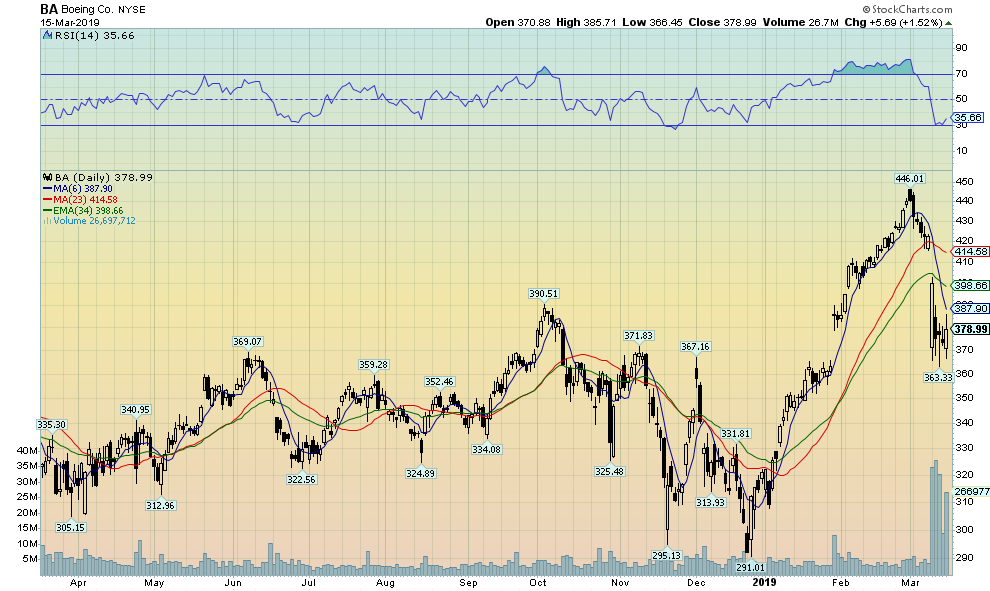
We couldnt resist. Here is Boeing (BA-NYSE). Boeing gapped down on very high volume. It has shown little sign that it is about to rise to fill that gap. The RSI never went under 30 to suggest the potential for a bottom. Odds are high that this stock is going to go lower possibly back to its start in 2019, just under $300.00. The workers who make those planes are naturally on pins and needles as to their future.
Source: www.stockcharts.com
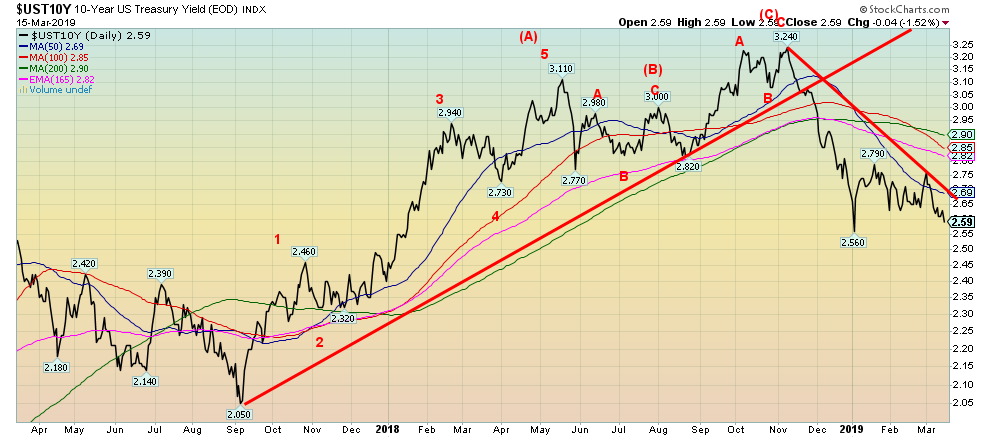
U.S. Treasuries are responding to weak data that has been released in the past week. We note from last weeks economic releases continued weakness in the retail sector, growing weakness in the housing market, weakness in durable goods, continued low inflation and continued soft pedalling from the Fed. With yields on the 10-year U.S. falling this past week to 2.59%, odds are favourable that the yield could drop below the earlier 2019 benchmark at 2.56%.
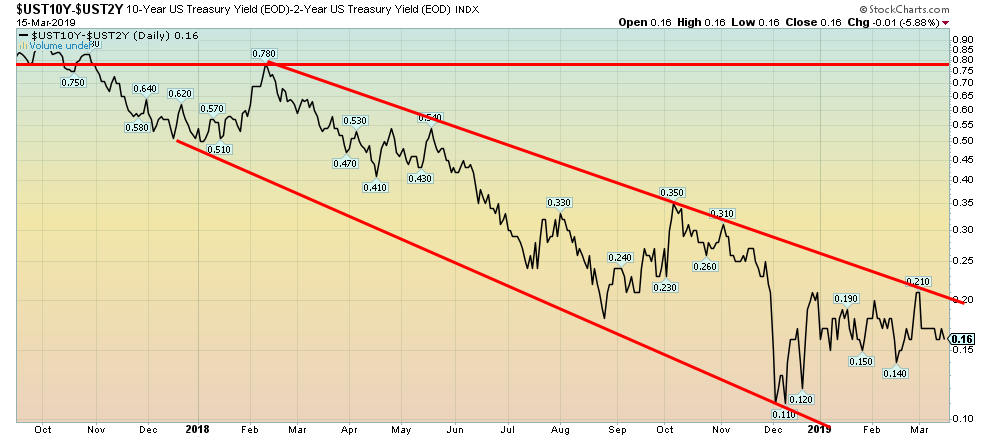
Recession Watch Spread
Source: www.stockcharts.com
The recession watch spread of the 10-year U.S. Treasury note minus the 2-year U.S. Treasury note appears to have resumed its downtrend. The 210 spread fell to 16 bp from 17 bp the previous week. The spread is still nowhere near falling under zero. And even if it does, it has in the past needed at least six months under zero before a recession hit. A breakdown under 14 bp could suggest a decline to 7 bp.
Source: www.stockcharts.com
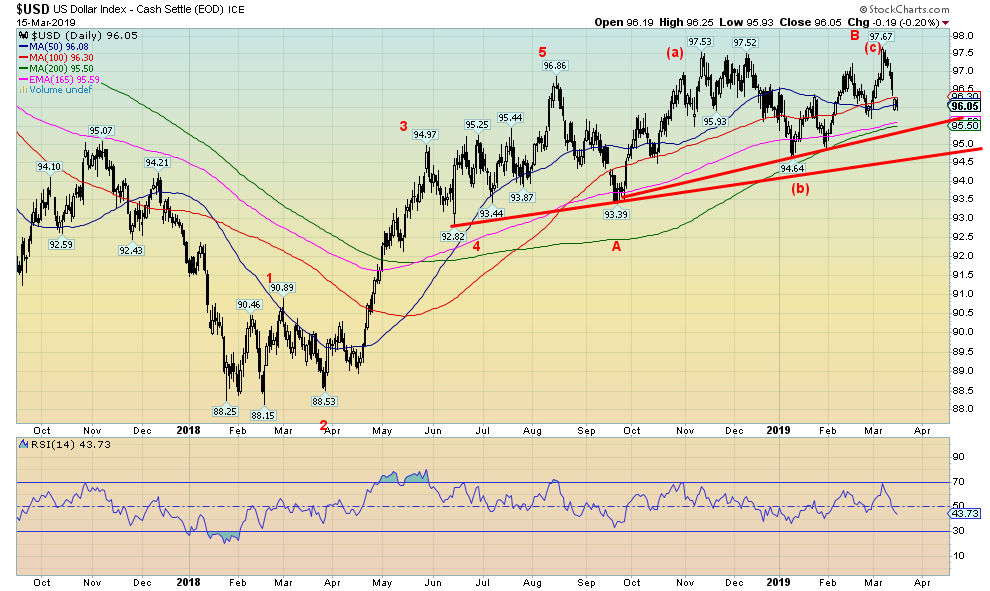
The U.S. dollar continued to rise because of ongoing weakness in other countries. As China slows and the EU and Japan continue to stumble, the safe haven default is the U.S. dollar. This is despite signs of growing weakness in the U.S. economy. It is not so much the weakness in the U.S. economy, but that other countries are experiencing even more weakness. As well, trade talks continue with China and there has been nothing that has come out of that could shake markets. The U.K. remains in a mess because of Brexit, but the pound sterling and the FTSE 100 are hanging in. The US$ Index fell 1.3% this past week as the euro gained 0.8%, the pound sterling was actually up 2.0% while the Canadian $ gained 0.7%. The Japanese yen was off a small 0.1%. The question is: which way is this US$ Index going to go? The previous week it looked like it was about to take off. But it faltered after the poor job numbers of the previous week. The weak economic numbers this past week didnt help nor did Powells dovish tone. Its all making the current pattern very confusing. On one hand it could take off towards 100 and on the other it could start a collapse. The US$ Index starts to break down under 95.50. Thats not that far away. A bigger breakdown gets under way under 94.50. As to the upside, only new highs would suggest that we could run to 100. It still looks like a top but we confess that run to new highs at 97.67 confused us as it suggested new highs ahead. We are not ruling it out. Until it breaks under 95.50 then it is highly unlikely that new highs will follow.
Source: www.stockcharts.com
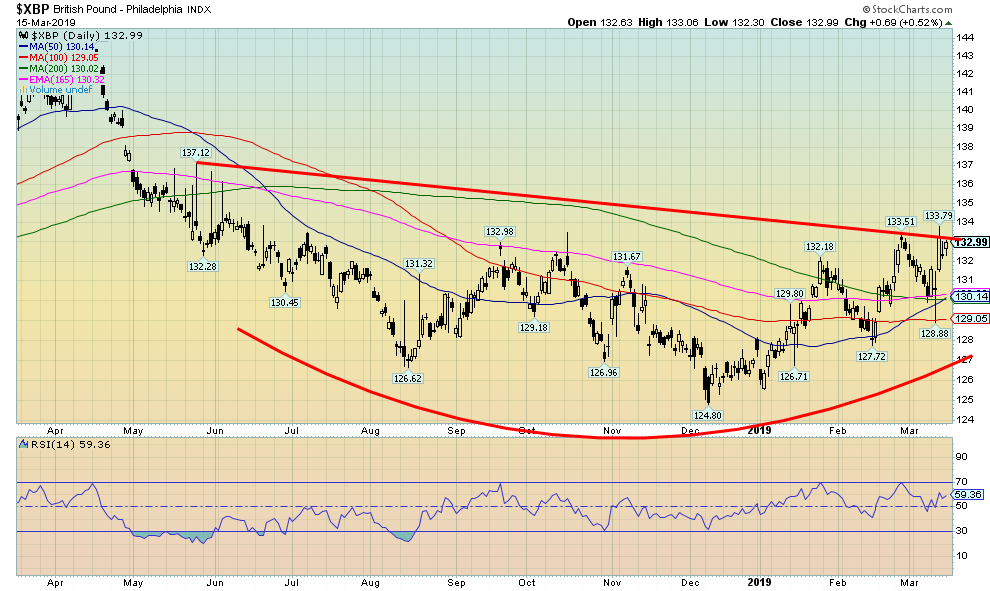
Brexit, Brexit, Brexit! That`s all you hear out of the U.K. It dominates them. One pundit referred to the U.K. as Dead Men Walking or The Walking Dead. This is a country that cant figure itself out and is divided against itself. Leavers vs. Remainers. But I find that chart of the pound sterling rather compelling. It doesnt look to us like a chart that suggests the pound sterling is about to bust to the downside. Granted, all bets could be off if the pound busts under 127 once again. That could suggest new lows ahead. Best hope for it right now given all of the confusion created in the U.K. is that the pound sterling continues its waffling in this potential bottom pattern. But we know that Northern Ireland is not very happy nor is Scotland. Referendums to leave are there as well. The best they can hope for right now is an extension. But for what purpose? And will the EU grant them the extension? They truly are the Walking Dead.
Source: www.stockcharts.com
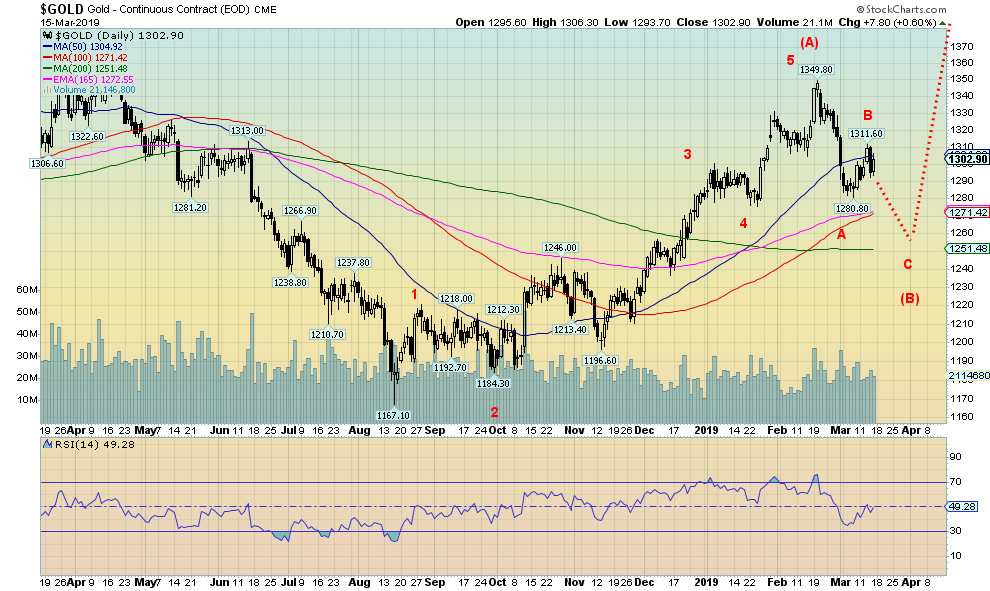
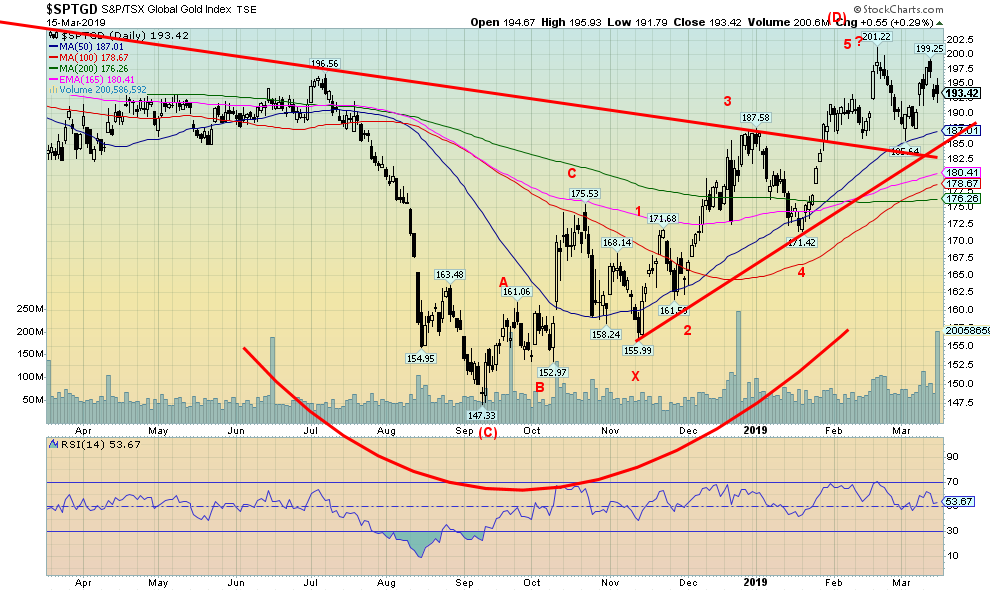
Gold managed to rally this past week as it closed over $1,300 once again. We continue to believe that this is a B wave that could take gold up to around $1,320 or $1,330. Wed be surprised at new highs above $1,350. Gold gained a small 0.3% this past week, but silver slipped 0.2%. Platinum was up, jumping 1.7% while palladium continues its remarkable run up just under 2.0%, although for once it didnt make a new high. Copper gained, up 0.7%. After this rebound rally is over, we suspect gold will fall to complete the correction of the run from $1,167 to $1,350. Downside targets remain at $1,250. Once this correction is overwith a low possibly in May but no later than Junegold should then run and take out $1,350 and the major resistance at $1,370 and move to $1,400 and higher. Key, of course, remains the U.S. dollar. But, as we note in our US$ Index commentary, we continue to believe that the US$ Index is poised to break down. There are many things that could spark this, including a political crisis in the U.S., or a breakdown in the China/U.S. trade talks. We couldnt help but notice that gold sentiment hit 90% at the recent highs. That high sentiment is often a signal that a top could be forming. The other extreme is a drop-in sentiment to 5% to 10%. Currently sentiment is still in the 60% range.
Source: www.cotpricecharts.com
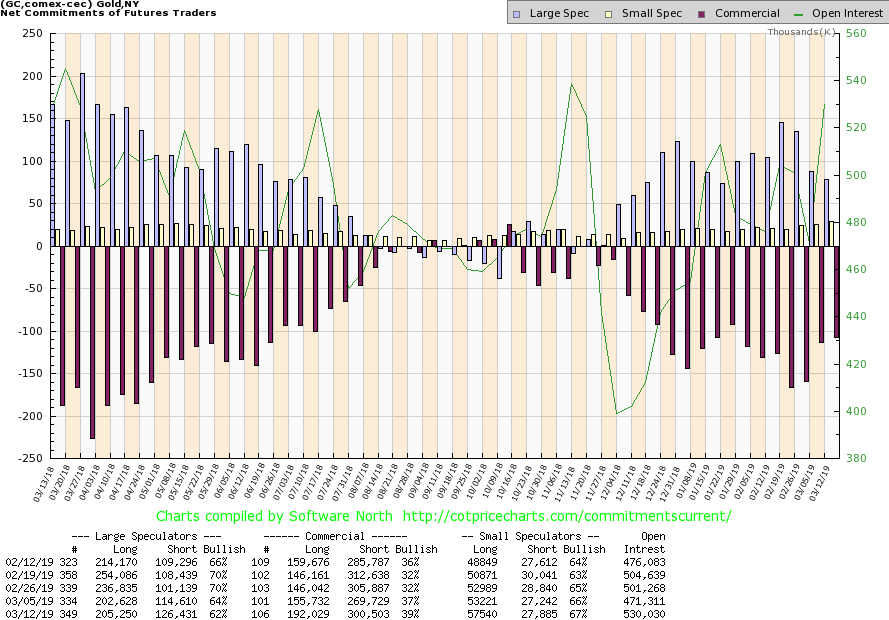
The commercial COT continues to be supportive of gold as it rose to 39% this past week from 37%. Two weeks ago, it was 32%. Long open interest took a big jump up just over 36,000 contracts but short open interest also rose up almost 31,000 contracts. The two offset each other, but the gain in the longs was enough to push the commercial COT higher. No surprise the large speculators COT (hedge funds, managed futures, etc.) fell to 62% from 64% and down from 70% just a couple of weeks ago. We note as well that the COT is now completely caught up from the craze of the shutdown two months ago. The commercial COT is positive but it is a weak positive. Ergo, our thoughts for gold to rise to maybe $1,320 or $1,330 but not make new highs above $1,350.
Source: www.stockcharts.com
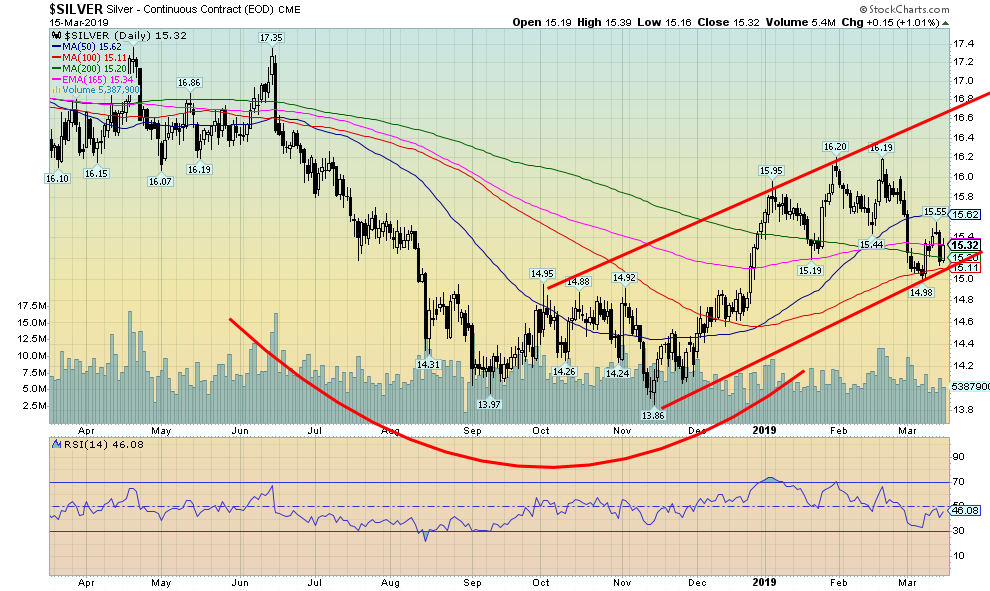
As we noted, silver slipped a small 0.2% this past week. Silver appears to be in a nice bull channel. We will see if it can hold that channel even as gold might move lower. A breakdown under $15 would change that scenario and silver could fall to the $14.60 range. Technically, it made what could be seen as a double top at $16.20 and $16.19. If so, the breakdown under $15.44 suggested the potential to fall to $14.45. Currently the low is $14.98, but if that goes then $14.45 becomes a possibility. Only new highs would break this mildly bearish scenario. However, in the interim silver should follow gold higher, at least for the short term. New highs above $15.55 could suggest a move towards $16 once again but a more likely target zone is between $15.70 and $15.80.
Source: www.cotpricecharts.com
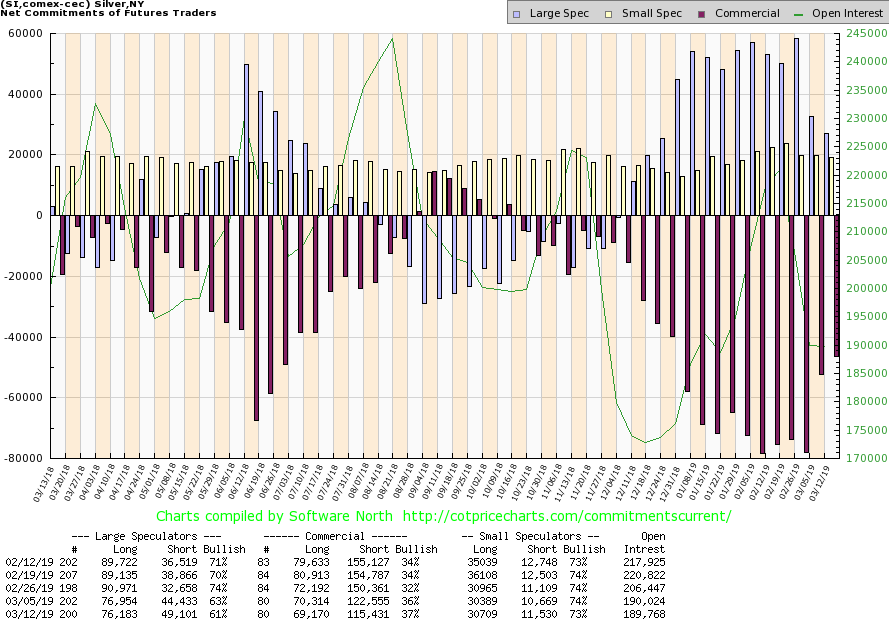
Like the gold commercial COT, the silver commercial COT gives some mild encouragement for higher prices. The commercial COT rose to 37% this past week, up from 36% the previous week. But note the rise was accomplished in a negative manner. Long open interest fell just over 1,000 contracts but short open interest fell roughly 7,000 contracts. The large speculators COT fell to 61% from 63%. But we note there that short open interest rose just under 5,000 contracts while long open interest was off only about 300 contracts. We consider the silver COT to be mildly bullish, but the fact that both long and short open interest fell makes us cautious.
Source: www.stockcharts.com
Like gold, the gold stocks are backing off from their recent highs. We note now that the TSX Gold Index may have made a small double top at 201.22 and 199.25. If so, the neckline is at 185 and a breakdown under that level could suggest a decline to around 170. We note there is considerable MA support in the 176 to 180 zone, but if we are going through a corrective period the likelihood is a decline through that level. We dont believe well see a major breakdown. But the potential of the double top is ominous, at least for the short term.
Chart of the Week
Source: www.stockcharts.com
OPEC vs. NOPEC. It seems that a war is breaking out between the U.S. and OPEC. What is NOPEC? Well NOPEC is a piece of legislation being proposed that would allow the U.S. government to sue the OPEC cartel. OPEC, through Suhail Mohammed Al Mazrouei, the UAEs oil minister has told U.S. financiers that if the NOPEC bill goes through the cartel would get members to raise their production to the max. Russia is also willing to join OPEC. A sharp increase in production would cause a glut of oil on the market and crash prices.
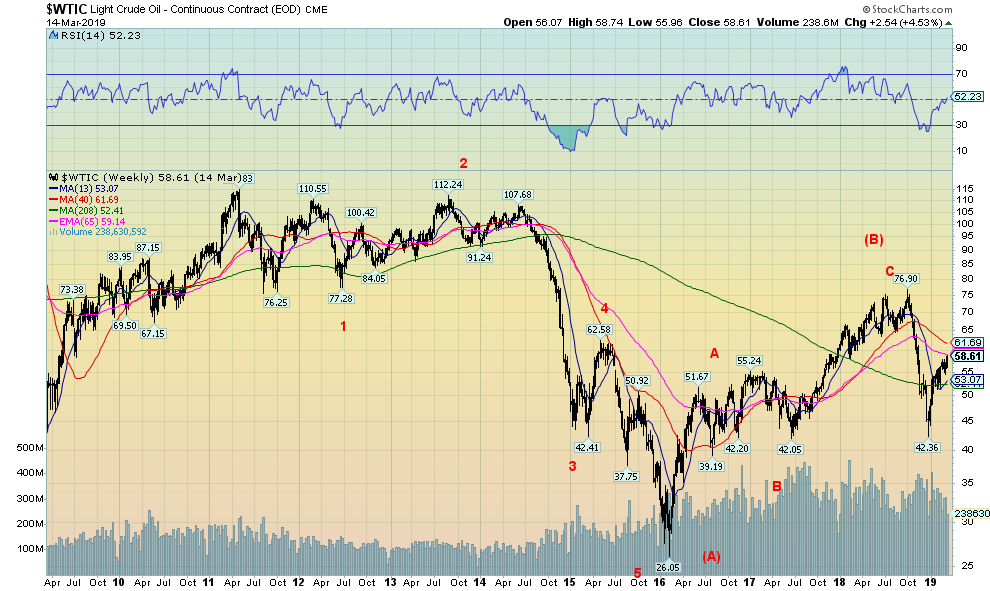
Now here is the rub. U.S. shale producers are on shaky grounds. They leveraged themselves and a sharp drop in oil prices could cause them to go bankrupt. The shale producers had a very difficult time when WTI oil crashed from $110 to $26 between 2013 and 2015 (final low was in early 2016). Since then, oil prices recovered hitting a high of about $77 this past year. Shale producers were relieved and so were their backers the banks. But now oil prices are threatening to collapse again. Part of the reason for the recent drop was fear of this NOPEC bill. Consumers will love lower prices and so will Trump since he has always campaigned and tweeted about the evils of the OPEC cartel.
Members of the oil and gas industry are against the bill. OPEC has crashed prices before, notably in 19851986, 19981999, and the most recent one in 20132015. This chart looks ugly. WTI oil is at weekly resistance between $59 and $62. After that sharp drop from $77 to $42 this rally looks like a bounce-back. This looks like an A wave down a B wave up with a C wave down to come. The C wave targets could be around $25 but it could go even lower. Beware the shale producers and their lenders if that happens.
TECHNICAL SCOOP
Charts and commentary by David Chapman
Chief Strategist, Enriched Investing Inc.
Phone: 416-523-5454 Email: david@davidchapman.com
dchapman@enrichedinvesting.com
Twitter: @Davcha12
March 18, 2019


