-- Published: Tuesday, 2 April 2019 | Print | Disqus
Jordan Roy-Byrne CMT, MFTA
Stop me if youve heard this before. Precious Metals disappointed again.
The miners were leading the metals but the metals broke down from bear flag patterns and that took the miners lower, suggesting an interim top is in place.
The technicals suggest weakness could be ahead for the sector but the fundamentals are finally turning bullish.
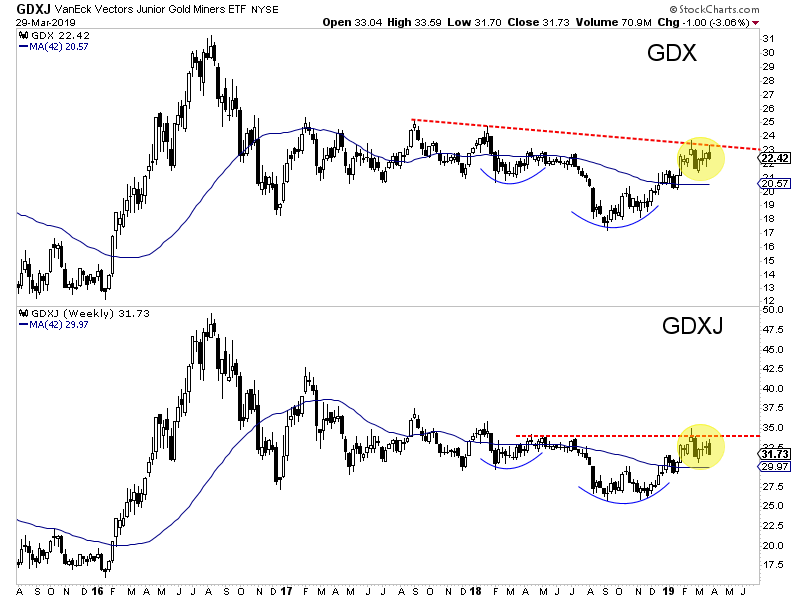
Before we get to fundamentals, lets look at the technicals. The weekly candle chart of GDX and GDXJ is below.
After last weeks failure to break weekly resistance, GDX now has resistance at $23 and GDXJ has resistance at $34.
The near-term trend is probably lower but if the Fed is going to cut rates later this year, Id expect the miners to eventually make a higher low which could also look like the right shoulder of an irregular head and shoulders bottoming pattern.
GDX & GDXJ Weekly Candles
As we noted last week, it wasnt until after the first rate cut (in the previous two occurrences) that precious metals began to outperform.
The chart below shows the pattern that leads to strong performance in gold stocks. The 2-year yield starts to decline, the Fed pauses, the yield curve steepens, the Fed cuts and then gold stocks perform.
With the current context and history, we can make the case that gold stocks and Gold will not officially move into a bull market until the Fed makes its first rate cut. Fed funds futures are now essentially discounting a rate cut by December and showing nearly a 30% chance of two rate cuts by January 2020.
Bonds are overbought (and yields are oversold) and so these markets could see a counter trend move which would align with weakness in precious metals.
However, precious metals bulls should not be dissuaded by weakness as a rate cut is likely coming within the next 12 months and probably sooner. The weeks and months ahead could prove to be an especially opportune time to position in advance of the first cut and a confirmed new bull market in gold stocks.
The content on this site is protected
by U.S. and international copyright laws and is the property of GoldSeek.com
and/or the providers of the content under license. By "content" we mean any
information, mode of expression, or other materials and services found on GoldSeek.com.
This includes editorials, news, our writings, graphics, and any and all other
features found on the site. Please contact
us for any further information.
Live GoldSeek Visitor Map | Disclaimer
The views contained here may not represent the views of GoldSeek.com, Gold Seek LLC, its affiliates or advertisers. GoldSeek.com, Gold Seek LLC makes no representation, warranty or guarantee as to the accuracy
or completeness of the information (including news, editorials, prices, statistics,
analyses and the like) provided through its service. Any copying, reproduction
and/or redistribution of any of the documents, data, content or materials contained
on or within this website, without the express written consent of GoldSeek.com, Gold Seek LLC,
is strictly prohibited. In no event shall GoldSeek.com, Gold Seek LLC or its affiliates be
liable to any person for any decision made or action taken in reliance upon
the information provided herein.