-- Published: Monday, 22 April 2019 | Print | Disqus
By: David Chapman
Evora, Portugal
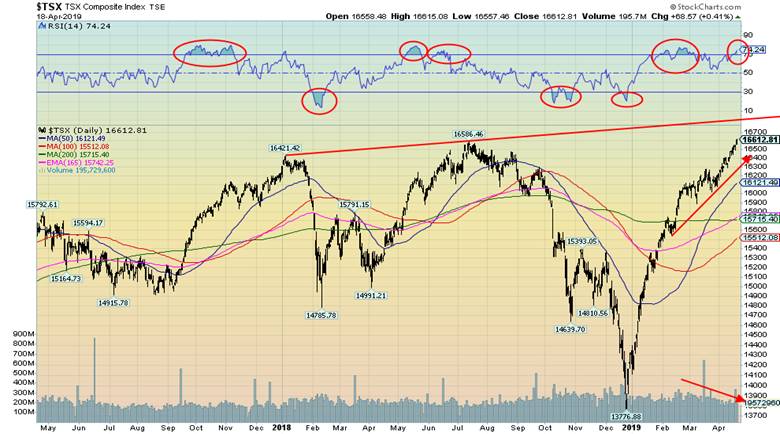
The TSX Composite made new all-time highs this past week. It was the only North American index to do so. The TSX was up 0.8% this past week, leading the way for the North American indices. By contrast, the S&P 500 actually fell about 0.1% this past week while the Dow Jones Industrials (DJI) made new highs for its current move, gaining about 0.6%. The Dow Jones Transportations (DJT) was up 0.7% while the NASDAQ gained about 0.2%. The small cap stocks continue to question this rally as the Russell 2000 lost 1.2%. They have tended to lag rather than lead as they should in a major rally.
The TSX Composite was not the only major index to make new all-time highs this past week. Against the backdrop of the Notre Dame Cathedral fire, the Paris CAC 40 also saw new all-time highs as it gained 1.4% this past week. New all-time highs is a theme we have mentioned previously and our belief is that more indices will soon follow. Nor have we eliminated the potential for a runaway move even as we approach May and the old saying sell in May, and go away. Stock indices have enjoyed a considerable run so far in 2019 and that undoubtedly has surprised many.
Source: www.stockcharts.com
The rise of the TSX Composite has been led by a number of sectors. Leading the way and also seeing new all-time highs for the sub-indices are Income Trusts, Consumer Staples, Industrials, Real Estate, Information Technology, and Telecommunications. Rising markets are being seen for Consumer Discretionary, Energy, Financials, Golds (although they have faltered recently), Global Mining, and Materials. Rising but potentially topping are Health Care and Utilities. The advance has been broad, an essential ingredient for new all-time highs.
With the rise to new all-time highs come warning signs. The RSI has once again moved above 70, a level often associated with tops. Treat it as a warning sign and not as a definitive. As can been seen with earlier highs, the RSI soared above 70 and stayed that way for some time before a corrective drop got underway. We also note the lagging volume. Again, this is a warning and not a definitive sign that the market is about to top. Often in moves like this it is not unusual to see lagging volume. It is a sign that while the market is rising and making new all-time highs it does not have huge strength or participation behind it.
Source: www.stockcharts.com
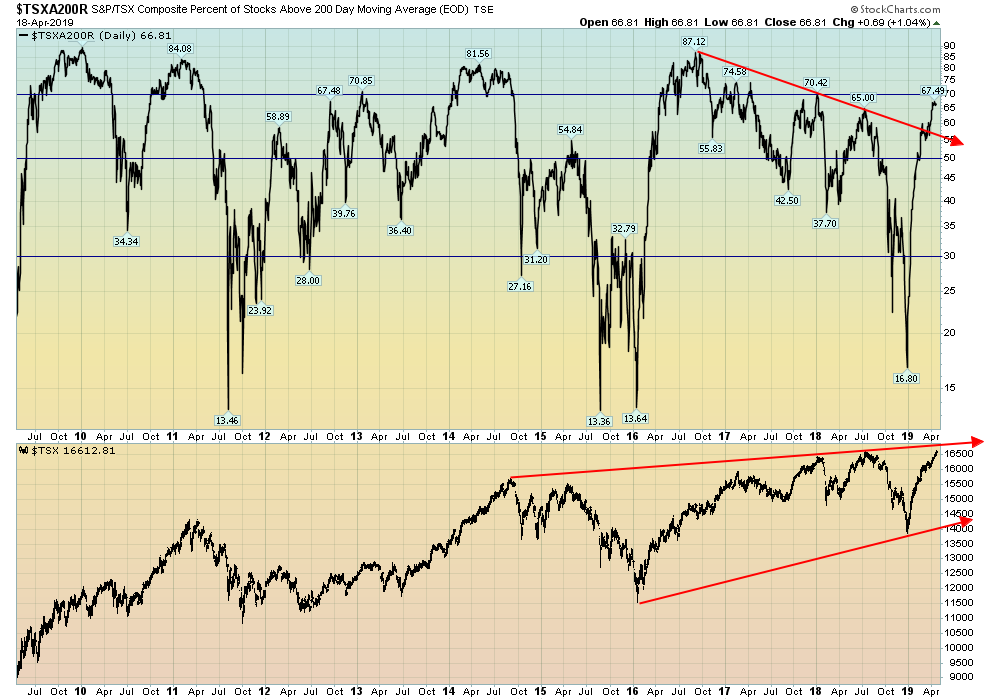
We note that the percentage of stocks trading above their 200-day MA has broken out to the upside. This is a positive development but it is diverging with the index. The percent index remains below its all-time , even as the TSX Composite makes new all-time highs. This is a divergence and suggests to us that the rally is being led by a smaller group of stocks.
Source: www.stockcharts.com
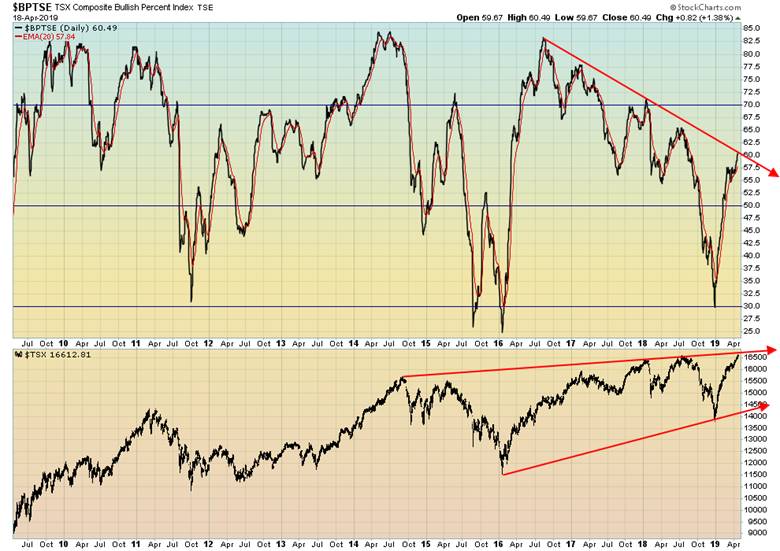
The TSX bullish percent index is also lagging badly. It is now approaching a downtrend line from a high seen way back in 2016. Yet the TSX Composite is making new all-time highsanother potential significant divergence to note. We note as well the TSX Composite is approaching a potential resistance line that connects the highs of 2014 with the highs of 2017 and 2018. That line appears to be up around 16,800, roughly 200 points higher from current levels.
While divergences and warning signs may abound, none of suggests that the market is about to top. Wed need other signs for that. In a strong market, divergences and warning signs can continue longer than many expect. Could stock markets move into a runaway mode? That is something we and others have raised as a possibility. The signs are there that new all-time highs could be seen but a runaway mode is something else again. Runaways are exciting and exhilarating but are ultimately dangerous. It could even push the TSX above 16,800 and that rising resistance line.
Golds continue to do as we expected as they work their way lower towards potential targets down to $1,250. We note that the gold stocks as represented by the Gold Bugs Index (HUI) and the TSX Gold Index (TGD) broke down this past week. The HUI lost 4.7% while the TGD fell 3.5%. Both are now in negative territory for the year. What is concerning is that they both appear to have fallen below small top patterns. The HUI projects down to 144 while the TGD projects down to 171, a decline of roughly 9% from current levels. Our preference would have been for the gold stocks to lead.
Nonetheless, there are some positives. We note silver was flat this past week even as gold fell 1.5%. Gold has made new lows for the current move while silver has not. This is a potentially positive divergence. The commercial COT for both gold and silver jumped this past week with the gold commercial COT rising to 39% from 33% and the silver commercial COT jumping to 44% from 40%. While golds long open interest jumped higher more significantly the short open interest fell sharply, suggesting the commercials are covering shorts on this decline. For silver, long open interest rose even as short open interest remain relatively unchanged. Neither are at levels we would consider super bullish but the direction is positive and fits with our belief that once this down wave is complete, we could embark on a strong rally.
Stock markets are continuing their recent relentless rise while gold and silver falter. In trying to find a catalyst for both a runaway move and a strong gold/silver rally we continue to watch the ongoing attack by President Trump on Fed Chair Jerome Powell. Could Trump attempt to fire Powell because he wants interest rates 50 bp lower and QE to return? That would be a catalyst for gold. But would it also send stocks higher? Anything is possible.
TECHNICAL SCOOP
E-Commentary
Charts and commentary by David Chapman
Chief Strategist, Enriched Investing Inc.
Phone: 416-523-5454 Email: david@davidchapman.com
dchapman@enrichedinvesting.com
Disclaimer David Chapman is not a registered advisory service and is not an exempt market dealer (EMD) nor a licensed financial advisor. We do not and cannot give individualised market advice. David Chapman has worked in the financial industry for over 40 years including large financial corporations, banks, and investment dealers. The information in this newsletter is intended only for informational and educational purposes. It should not be considered a solicitation of an offer or sale of any security. The reader assumes all risk when trading in securities and David Chapman advises consulting a licensed professional financial advisor before proceeding with any trade or idea presented in this newsletter. We share our ideas and opinions for informational and educational purposes only and expect the reader to perform due diligence before considering a position in any security. That includes consulting with your own licensed professional financial advisor.


