-- Published: Monday, 15 July 2019 | Print | Disqus
Ive never been poor, only broke. Being poor is a frame of mind. Being broke is only a temporary situation.
Mike Todd, movie producer, Elizabeth Taylors third husband; 19031958
It wasnt raining when Noah built the ark.
Warren Buffett, Business magnate, investor, speaker, philanthropist, CEO Berkshire Hathaway, b. 1930
Beware of inside information
all inside information.
Jesse Livermore, investor, speculator, author of How to Trade in Stocks, 18771940
Of course, I would not do that. My answer would be no. The law clearly gives me a four-year term and I intend to serve it.
Jerome Powell, Chair of the Federal Reserve, in testimony before Congress July 10, 2019; b. 1953
It is telling that the most important question for Jerome Powell at the July 10, 2019 congressional hearings was: would he step down from his job if President Trump attempted to fire him? From Maxine Waters, the House Financial Services Committee Chair, If you got a call from the president today or tomorrow, and he said, I am firing you, pack up, its time to go. What would you do? Waters added that it was the elephant in the room. But she also added that, It is essential that the Federal Reserve maintains its independence from the executive branch.
Such is the unprecedented monumental tug of war between a sitting president and the Chair of the Federal Reserve. Not since former President Lyndon Johnson tried to intimidate Fed Chair William McChesney Martin has a president so blatantly tried to interfere with the Federal Reserve. The answer is simple. All Trump can do is complain and appoint like-minded people, the most recent being Christopher Waller and Judy Shelton, and hope that they can help to outvote Powell and the other Fed governors. Waller and Shelton still have to be confirmed by the Senate. Earlier, Trump appointees either failed to pass with the Senate or withdrew when they realized there was no support for them.
The Board of Governors of the Federal Reserve has seven members. Four of the current seven, including Powell, are Trump appointees. The seven members of the Board, along with the five Federal Reserve Presidents, are the ones that set open market operations and interest rates. They are the FOMC. The Trump appointees have generally gone along with the majority. Being a Trump appointee is no guarantee that they follow what Trump wants.
Instead of the focus on Powell, the focus should be on what the Fed might do. And here Powell pleased the market. Powell in his speech implied that the Fed could soon cut interest rates because of concern over the global economy turning down and the ongoing trade wars. The focus has become interest rates and even the ECB may be getting into the act and the BOJ is going to maintain its ultra low interest rates even negative rates. There is now over $13 trillion of debt floating around the world with sub-zero interest rates.
Of course, it has been Trump pounding Powell to cut interest ratesas if that is really going to do anything. Overall, the U.S. economy isnt doing that badly with record low unemploymentat least, the official U3 rate as no one pays much attention to Shadow Stats (www.shadowstats.com) unemployment level except for those that like to look behind the veil. But there is a growing divergence between the U.S. economy and the rest of the world. And what that has done is encourage capital flows out of the slowing economies and their low rates to the U.S. and a stronger economy and higher interest rates. That helps maintain upward pressure on the U.S. dollar but also helps the U.S. economy.
But there is some trouble down the road.
The U.S. debt limit. Apparently, tax revenues have not been up to expectations. There is a significant risk that the U.S. could run out of borrowing authority by early September. The comments came from a Bipartisan Policy Center in Washington. In the first nine months of fiscal 2019, the budget deficit was $746 billion and is on target to top or at least approach $1 trillion for the first time since 2012. Total U.S. debt now stands at $22.5 trillion. The current debt limit of $21.988 trillion has already been exceeded.
U.S. Treasury Secretary, Steve Mnuchin, has stated that a deal needs to be in place from Congress before the August recess. Congress first needs to extend the debt limit. Failure to pass new limits could see cuts to various departments including defense. In the past, something happened at the last moment to get things passed thus averting a default. As usual, the partisan chasm between Republicans and Democrats prevents a deal from getting firmed up, although they have usually found a last-minute solution to prevent a default. Failure this time is a problem for the Fed on how to deal with it.
The 20072008 financial crisis got underway with the collapse of some BNP Paribas hedge funds that specialized in U.S. mortgage debt. Could the troubles of the $4.7 billion Woodford Equity Income Fund be the start of something similar? Following 23 consecutive months of withdrawals, the fund has now been closed to withdrawals, leaving investors angry and in limbo. The fund holds pension and investment savings of thousands. Ultimately, financial collapses start with a major player getting in trouble. Then it snowballs.
Possibly one of the more interesting things to come out of Powells testimony was his response to a question about a return to the gold standard. Powell is against it. He believes that a return to a gold standard would mean current Fed focus on employment and monetary policy would suffer. His comments put him at odds with potential Fed governor nominee Judy Shelton. Trump is also a fan of a gold standard. But central banks and private banks hate it because it effectively ties their hands as to what they can do. Many believe a return to a gold standard would eliminate the need for a central bank.
Below is a chart of U.S. debt and the debt limit vs. gold. As we noted, the U.S. has exceeded its current debt limit. And gold has failed to maintain its pace against the rising debt since 2013. Ultimately, everything self-corrects. Gold will eventually rise to maintain its pace against the rising debt and the debt limit will be raised to prevent a default. For gold to cover the entire U.S. debt of $22.5 trillion, gold would have to be priced at $86,000. The U.S. currently carries its 261.5 million troy ounces on its books at $42.22. Quite a difference.
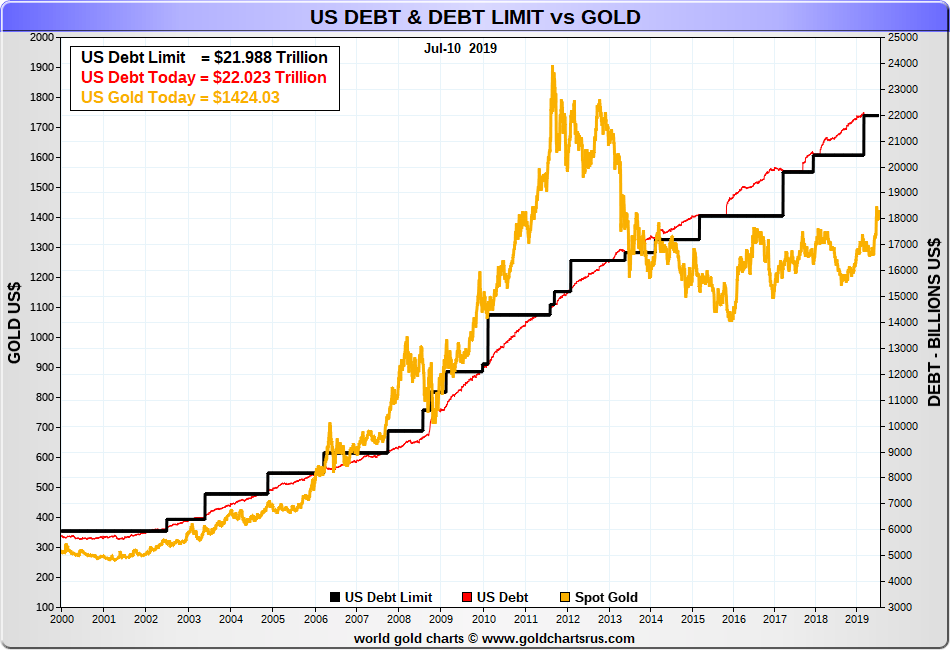
Source: www.goldchartsrus.com
MARKETS AND TRENDS
| | | % Gains (Losses) Trends |
| Close Dec 31/18 | Close Jul 12/19 | Week | YTD | Daily (Short Term) | Weekly (Intermediate) | Monthly (Long Term) | |
Stock Market Indices | | | | | | | | |
S&P 500 | 2,506.85 | 3,013.77 (new highs) | 0.8%` | 20.2% | up | up | up (topping) | |
Dow Jones Industrials | 23,327.46 | 27,332.03 (new highs) | 1.5% | 17.2% | up | up | up (topping) | |
Dow Jones Transports | 9,170.40 | 10,637.31 | 1.5% | 16.0% | up | up | up (topping) | |
NASDAQ | 6,635.28 | 8,244.14 (new highs) | 1.0% | 24.3% | up | up | up (topping) | |
S&P/TSX Composite | 14,322.86 | 16,488.12 | (0.3)% | 15.1% | up | up | up | |
S&P/TSX Venture (CDNX) | 557.20 | 576.03 | (1.8)% | 3.4% | down | down | down | |
Russell 2000 | 1,348.56 | 1,570.0 | (0.4)% | 16.4% | up | up | up | |
MSCI World Index | 1,710.88 | 1924.32 | (0.5)% | 12.5% | up | up | up | |
NYSE Bitcoin Index | 3,769.99 | 11,532.85 | 2.5% | 205.9% | up | up | up | |
| | | | | | | | |
Gold Mining Stock Indices | | | | | | | | |
Gold Bugs Index (HUI) | 160.58 | 200.67 | 4.0% | 25.0% | up | up | neutral | |
TSX Gold Index (TGD) | 186.74 | 225.55 | 3.0% | 20.8% | up | up | up | |
| | | | | | | | |
Fixed Income Yields/Spreads | | | | | | | | |
U.S. 10-Year Treasury yield | 2.69 | 2.12 | 3.9% | (21.1)% | | | | |
Cdn. 10-Year Bond yield | 1.96 | 1.61 | 1.9% | (17.9)% | | | | |
Recession Watch Spreads | | | | | | | | |
U.S. 2-year 10-year Treasury spread | 0.21 | 0.28 | 64.7% | 33.3% | | | | |
Cdn 2-year 10-year CGB spread | 0.10 | .03% | (70.0)% | 175.0% | | | | |
| | | | | | | | |
Currencies | | | | | | | | |
US$ Index | 95.73 | 96.42 | (0.5)% | 0.7% | neutral | up | up | |
Canadian $ | 0.7350 | 0.7683 | 0.3% | 4.5% | up | up | neutral | |
Euro | 114.58 | 112.79 | 0.5% | (1.6)% | neutral | down | down (weak) | |
Swiss Franc | 101.88 | 101.60 | 0.8% | (0.3)% | up | up | neutral | |
British Pound | 127.50 | 125.74 | 0.4% | (1.4)% | down | down | down | |
Japanese Yen | 91.24 | 92.78 | 0.6% | 1.7% | up | up | up (weak) | |
| | | | | | | | |
Precious Metals | | | | | | | | |
Gold | 1,281.30 | 1,412.20 | 0.9% | 10.2% | up | up | up | |
Silver | 15.54 | 15.24 | 1.6% | (1.9)% | up | neutral | down | |
Platinum | 795.90 | 830.90 | 3.2% | 4.4% | down | down | down | |
| | | | | | | | |
Base Metals | | | | | | | | |
Palladium | 1,197.20 | 1559.10 | (0.3)% | 30.2% | up | up | up | |
Copper | 2.63 | 2.45 | 1.2% | 2.4% | down (weak) | down | neutral | |
| | | | | | | | |
Energy | | | | | | | | |
WTI Oil | 45.41 | 60.20 | 4.7% | 32.6% | neutral | neutral | neutral | |
Natural Gas | 2.94 | 2.45 | 1.2% | (16.7)% | down (weak) | down | down | |
Source: www.stockcharts.com, David Chapman
Note: For an explanation of the trends, see the glossary at the end of this article.
New highs/lows refer to new 52-week highs/lows.
Source: www.stockcharts.com
The records just keep on falling. The Dow Jones Industrials (DJI) soars through 27,000 and the S&P 500 though 3,000. The trouble is. not all are following. We have noted the lagging Dow Jones Transportations (DJT) and how small cap stocks are also not keeping up (S&P 600, Russell 2000). These are divergences that need to be resolved if we are to continue moving higher. Indicators such as the NYSE advance-decline line continue to advance in record territory and the McClellan Summation Index (RASI) is well is in positive territory. The CBOE put/call equity options are somewhat bearish. a counter to the continuing rising market.
Other indices making new highs this week include the Dow Jones Utilities (DJU), NASDAQ, NYSE, Dow Jones Composite (DJC), NASDAQ 100, Russell 1000, Russell 3000, S&P 100 (OEX), and the Wilshire 5000. The major international indices did not make new highs and were down this week.
This past week the DJI was up 1.5%, the S&P 500 lagged up 0.8%, the DJT gained 1.5%, NASDAQ was up 1.0%, and Russell 2000 lost 0.4%. Elsewhere, the TSX Composite fell 0.5% and the TSX Venture Exchange (CDNX) was off 1.8%. Overseas, the London FTSE fell 0.9%, the Paris CAC 40 was off 0.5%, and the German DAX fell 2.0%. In Asia, Chinas Shanghai Index (SSEC) was down 1.1% and the Tokyo Nikkei Dow (TKN) fell 0.4%. It seems that international stocks fell and the proceeds went to buying U.S. stocks. Yet the US$ fell this past week.
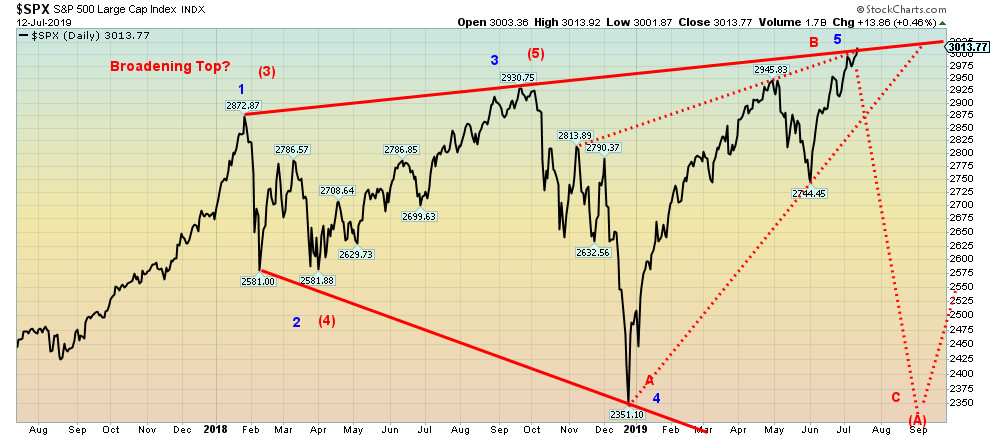
We continue to believe we are forming a broadening top formation (see next chart). We have designated the rising tops and falling troughs in blue as 1,2,3,4,5. We believe the market completed its third wave up from 2009 in January 2018, wave 4 was the correction that followed, and wave 5 took us to the top in October 2018 to complete wave 5 of a higher degree. What we have been witnessing since we believe is the start of a new bear market. The first wave down bottomed in December 2018. The current wave up is the B wave. B waves are often designed to mislead and confuse. The B wave has made new highs, giving the impression that its a new bull market. Indicators are positive in supporting the thesis. But volume lags. And, most importantly, enthusiasm is lacking. We are now approaching the top of the broadening channel, indicating that we could be nearing a final top. What should follow is a bear decline that takes us once again towards the bottom of the channel. The bottom of the channel is around 2,200, a decline of roughly 27% from current levels. Some believe that once we hit the channel bottom a new bull rise will get underway taking us once again to new highs. We are more inclined to believe that an irregular recovery will follow that could easily recoup 50% of the decline. That is how broadening top patterns usually work. If the tops were descending tops rather than ascending tops and still a broadening formation or, as some might call it, a megaphone pattern, then wed be leaning to a recovery that takes us to new highs. We note as well we could be forming a large ascending wedge pattern. Weve reached the top of the channel on the broadening formation and on the wedge formation. The odds favour a top of potentially some significance here. A break under 2,900 would be the first good sign of trouble as the wedge pattern would be breaking down.
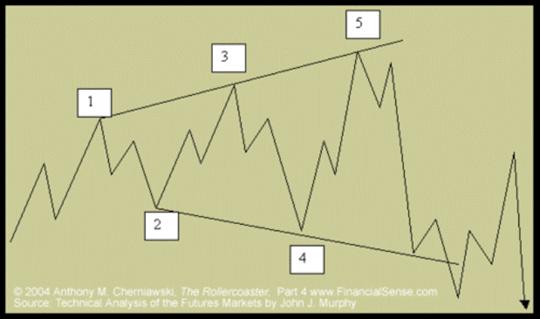
Source: www.financialsense.com , John Murphy Technical Analysis of Futures Markets
Here is the classical description of a broadening formation. It is described by John Murphy, author of Technical Analysis of Futures Markets, as a rare pattern. It is like an inverted triangle or, as some might call it, an expanding triangle. There are typically three peaks to a top and two declining troughs. Volume would decline on the rises but rise on the declines. That makes the pattern a bear formation. A lot of false signals appear during the formation of the triangle. One might be the rising advance-decline line that signals the market is going higher. Murphy describes the pattern as usually occurring at important market tops even as it is a rare pattern. The pattern is confirmed when it busts through the bottom of the channel.
Source: www.stockcharts.com
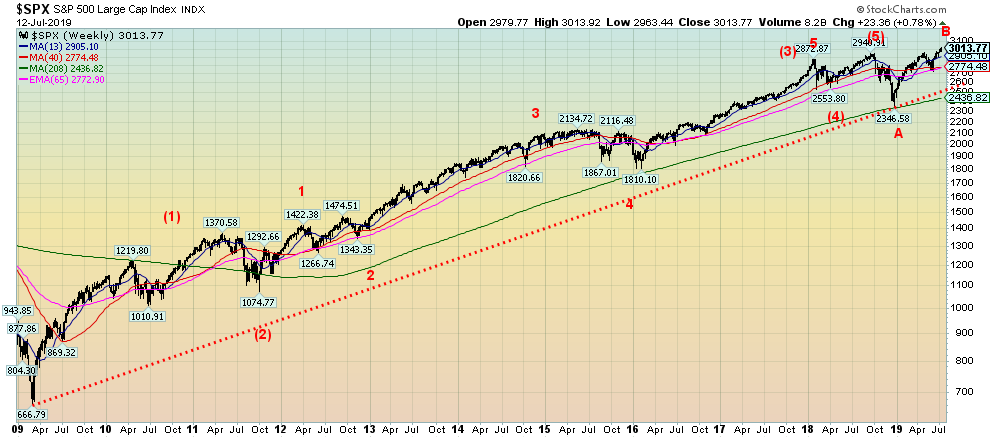
We havent changed our outlook on the long up pattern from March 2009. We believe five waves were completed in October 2018. The weekly market turns into a bear under 2,400. Note how the four-year MA defined market troughs in 2011, 2016, and 2018.
Source: www.stockcharts.com
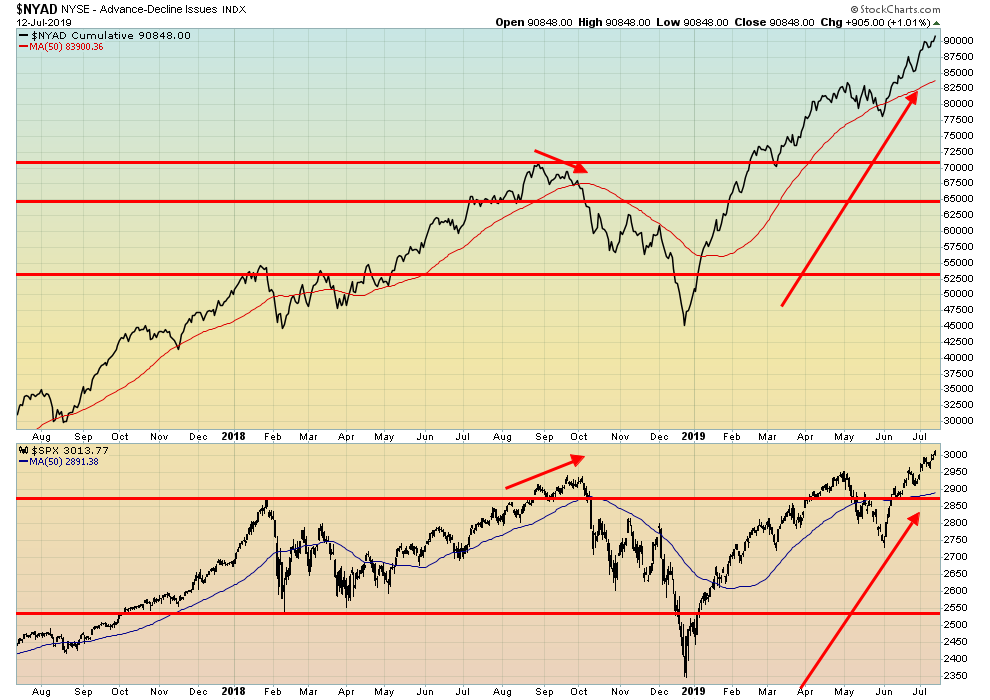
A potential misleading false indicator. The NYSE advance decline line keeps making new highs. The S&P 500 has also now made new highs but not convincingly. We could be wrong and the advancedecline line could be right. But given we are now at the top of the channel the next move of the market and the advancedecline line should be down. August/September are traditionally weak months.
Source: www.stockcharts.com
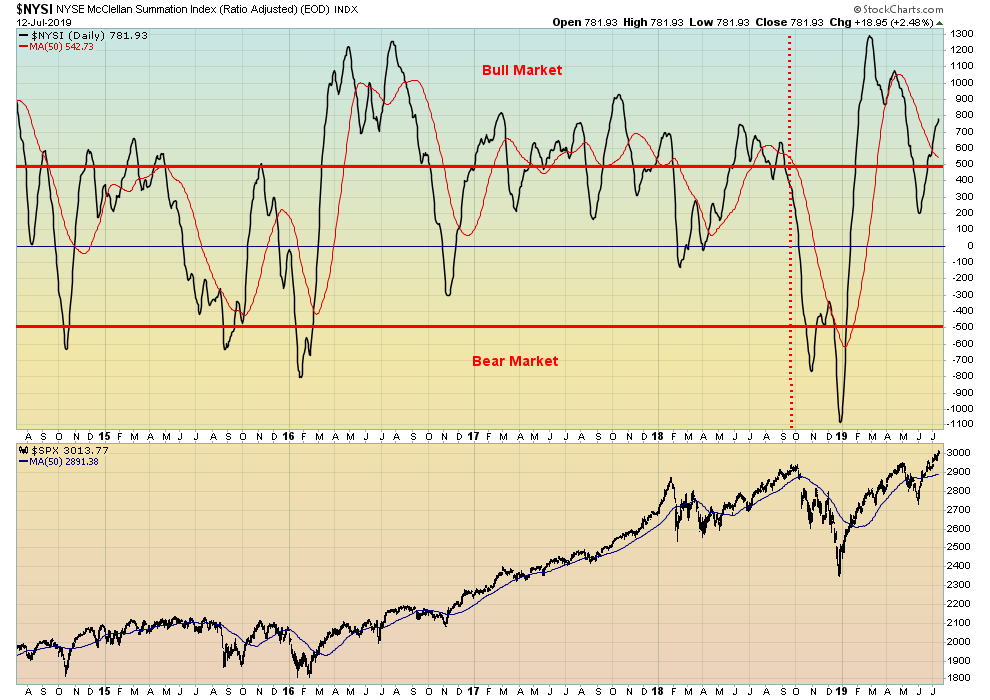
The McLellan Summation Index (ratio-adjusted) known as the RASI continues in positive bull territory. Wed like to see it turn down under 500. When the market rebounds and possibly makes another new high and the RASI remains under 500, it would be the classic divergence.
Source: www.stockcharts.com
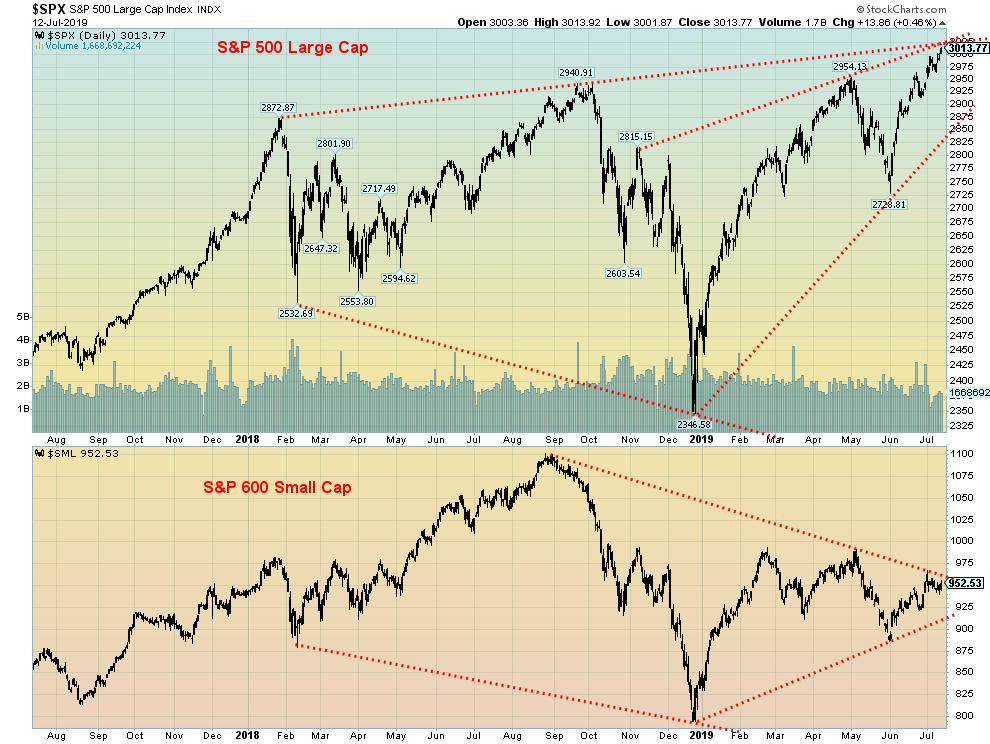
The markets are not confirming each other. Here is the S&P 500 (large cap) vs. the S&P 600 (small cap). The 600 is nowhere near its former highs of September 2018. Other divergences between indices include the DJI vs. the DJT as the DJI makes new all-time highs, but the DJT like the 600 is nowhere near its former highs. Others are the S&P 500 and the KBW Bank Index. The S&P 500 makes new highs while the KBW remains well below its former highs. Banks should be leaders, not laggards. The Semi-Conductor Index (SOX) is also below its former highs even as the S&P 500 makes new highs.
Source: www.stockcharts.com
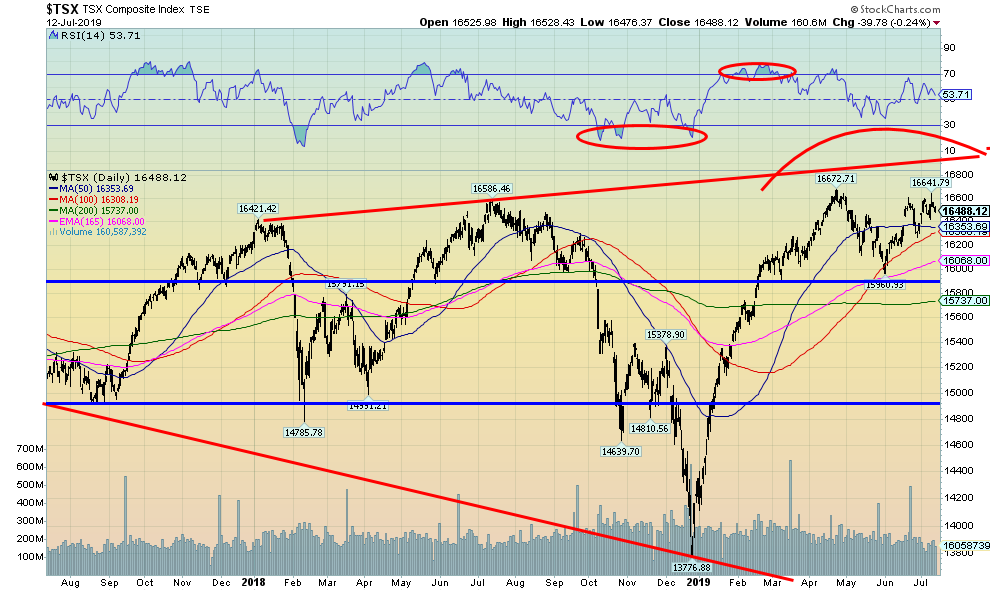
Is the TSX Composite making a double top? Could be. This past week the TSX hit a high of 16,641, short of the 16,672-high seen in April 2019. The TSX appears to be rolling over. The neckline of a possible double top is around 16,400. It could imply a decline to 15,700 once that level breaks. Targets could be as low as 15,250.
Source: www.stockcharts.com
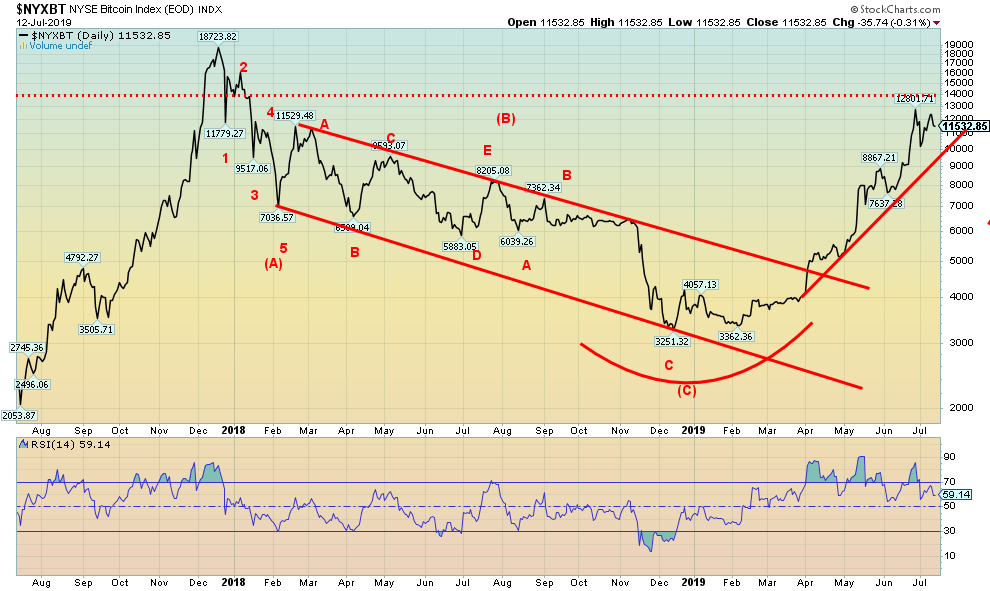
The Bitcoin rally is faltering. After running to a high of over $13,000, Bitcoin has been volatile over the past few weeks; it fell initially to around $10,000 and then rallied again to $12,000, only to now see that rally falter. On July 10, Bitcoin took a $1,000 hit in a little over an hour, going from over $13,000 back to $12,000. Apparently all cryptos were hit as they took a $27.1 billion trading loss in just over an hour. Volume had been falling on the rise but rose sharply on the sell-off. An interesting story saw an offer from Investor Fortress for all the creditor claims against Mt. Gox at a price of $900/Bitcoin. In 2014, Mt. Gox collapsed taking 850,000 Bitcoins with it. They just disappeared. No one knows where. Mt. Gox went into bankruptcy. Fed Chair Jerome Powell got into the cryptocurrency debate at the recent Congressional sessions when asked about Facebooks planned LIBRA cryptocurrency. He noted that cryptos raise a lot of concernsprivacy, money laundering, consumer protection, and financial stability. He said no one uses cryptos for payments. Its speculative, an alternative to gold. Cryptos are a speculative store of value like gold. Except that cryptos are virtual while gold is real. Cryptos have been around barely 10 years. Gold has been around for over 3,000 years. Cryptos, like a fiat currency, can be endlessly reproduced. All the gold in the world is limited, difficult to find and difficult to bring to production in quantities that justify a mine. President Trump does not like cryptos but he does like gold.
There are 2,324 cryptos listed at Coin Market Cap (www.coinmarketcap.com) with a combined market cap of $313.1 billion. Bitcoin has a market cap of $203.6 billion, representing almost 66% of the market. There are 17 cryptos with a market cap over $1 billion. Dogecoin (DOGE) is ranked 28th with a market cap of $389.5 million. Not bad for a fake.
Source: www.stockcharts.com
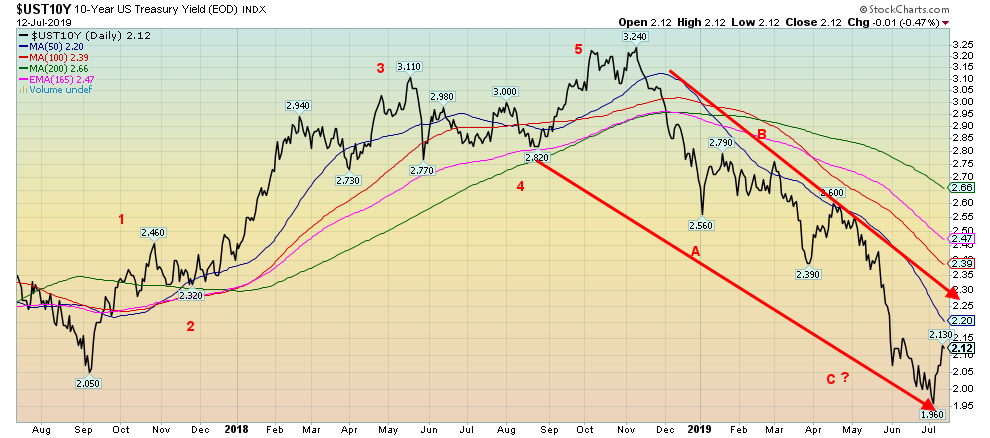
A sluggish response to the 30-year bond auction this past week helped push bond yields to their highest level in a month. This came against the backdrop of dovish comments from Fed Chair Jerome Powell and thoughts of a cut in the key Fed rate at the July 3031 FOMC. The 10-year U.S. Treasury note jumped 8 bp this past week to close at 2.12% vs. 2.04% a week earlier. We note the falling 50-day MA up near 2.20% as a potential target. Given a record stock market, there was also some outflow of funds from bonds into stocks. For now, the 1.96% low remains the 10-years nadir. We have a long way to go to challenge the 200-day MA up near 2.66%. We are not expecting that any time soon.
Recession Watch Spread
Source: www.stockcharts.com
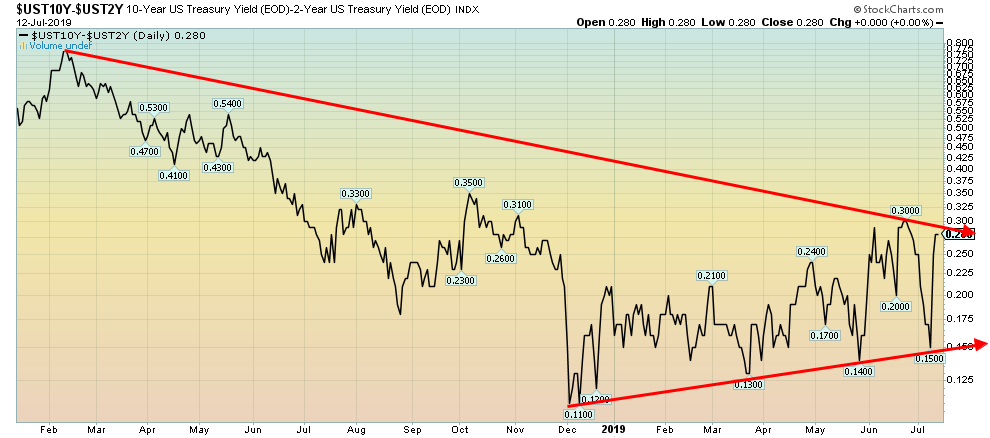
The 2-year U.S. Treasury note fell this past week 3 bp, from 1.87% to 1.84% thus widening the spread between the 10-year U.S. Treasury note to 28 bp. The 2-year was pushed down by expectations that the Fed will cut interest rates later this month. As a recession warning this spread is not telling us much except that supposedly things are good. Normally the 210 spread goes negative at least six months in advance of a potential recession. The 210 spread has not yet been negative.
Recession Watch Spread 2
Source: www.stockcharts.com
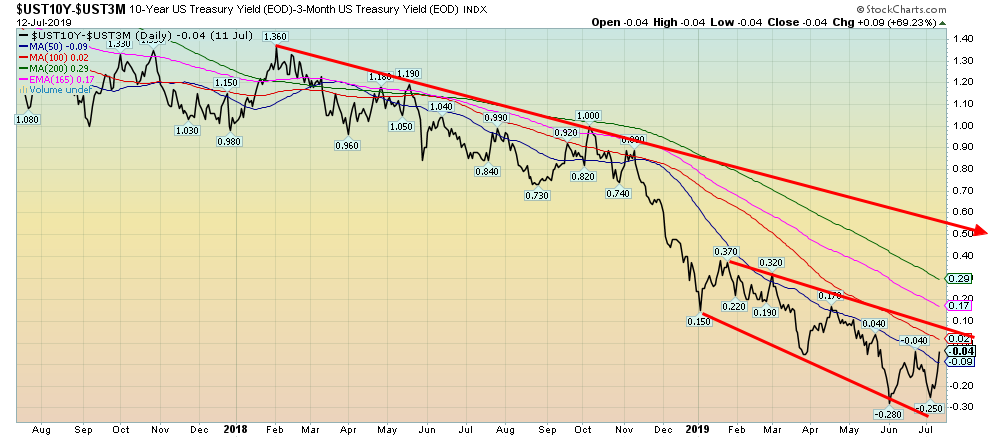
The 210 spread has not been negative but the 3-month10-year spread has been negative since May. Many are now touting the 3-month10-year spread as the one to watch. Still, the spread at negative 4 bp is well off its June low of negative 28 bp. This spread can remain negative for upwards of six months or more before the onset of any recession. And, as we have seen, it doesnt stop the stock market from rising. A reminder that the 3-month10-year spread went negative in July 2006, well over a year before the stock market topped in October 2007.
Source: www.stockcharts.com
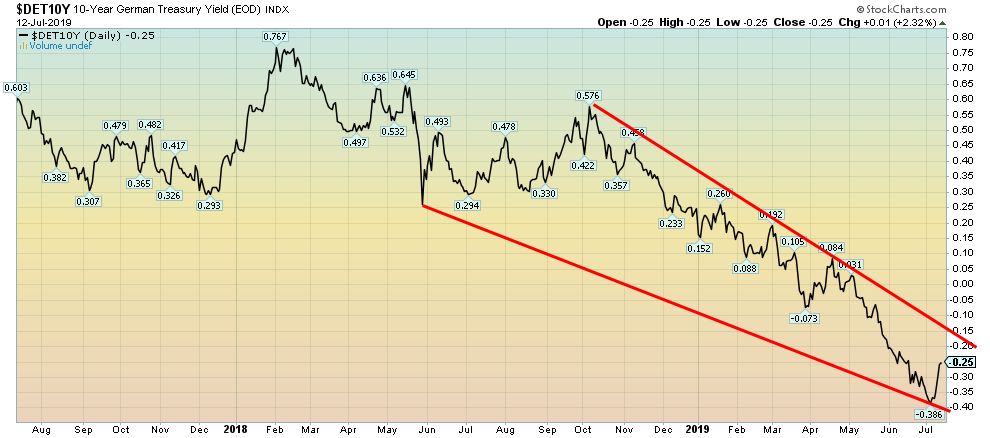
There are $13 trillion of bonds trading at negative yields in the world. Bonds, particularly government bonds, may be safe assets but does it really make any sense to be paying the German government 2 euros for every 1000 euros borrowed over a 10-year period. Yes, many have to hold government bonds no matter what, but they are paying for the privilege. The trouble is, given negative yields on so many bonds and low interest rates on many others, it pushes investors into higher yielding debt and stock instruments hoping for that higher return. It also helps create bubbles in financial assets. All we can say is that 10-year German bunds at negative 25 bp are certainly better than 10-year German bunds at negative 38 bp seen earlier this month.
Source: www.stockcharts.com
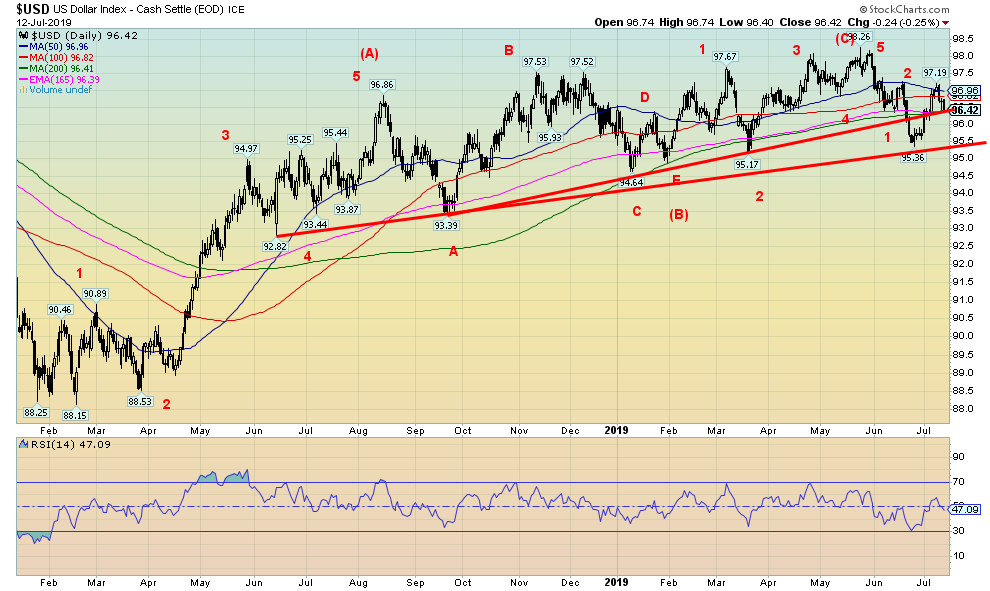
Is there a risk growing that government intervention will push the U.S. dollar lower? President Trump wants lower interest rates and a lower dollar. Given his persistence and his bombastic methods, he may get his wish. Trump may even find a way to intervene in the U.S. dollar outside the Fed. Trump is accusing the EU and China of currency manipulation, and if they lower interest rates he may keep pushing Powell to follow his bidding by also lowering rates. He could also use the Exchange Stabilization Fund to help push the dollar lower. Although there are even limits as to what it can do in any sustained manner. It is also unlikely there could be anything like 1985 Plaza Accord to lower the U.S. dollar due to a lack of cooperation amongst G20 members. The US$ Index fell 0.5% this past week. Other currencies rose with the euro up 0.5%, the Swiss franc up 0.8%, the pound sterling up 0.4%, and the Japanese yen up 0.6%. The Canadian dollar also gained up 0.3%. The US$ Index is now on a line of support near 96.40, but a break through that level could send it down to the key support line near 95.50. Below 95.50, the US$ Index could begin to break down in a bear market.
Source: www.stockcharts.com
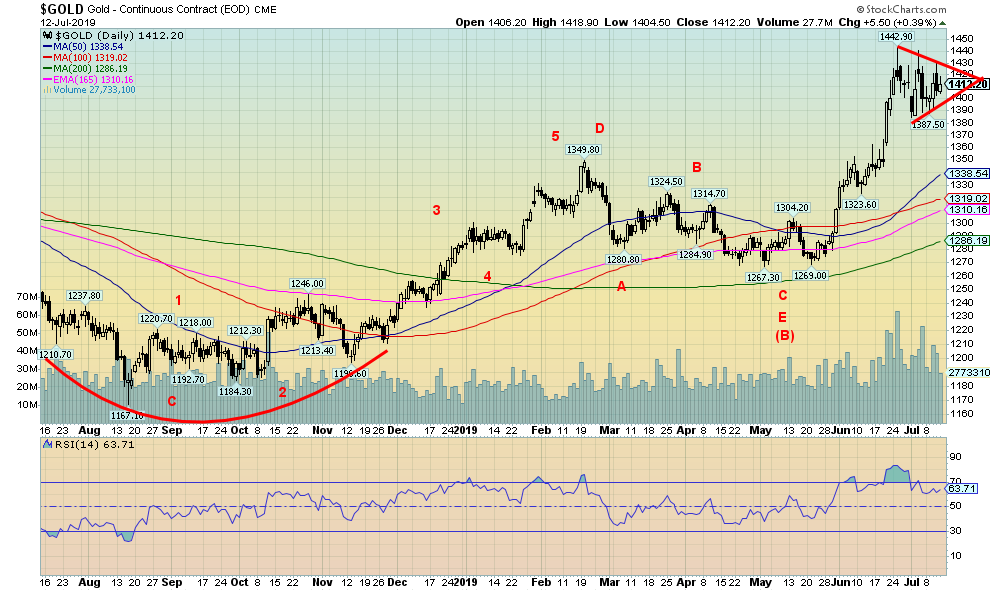
Gold rebounded this past week, rising to $1,412 up 0.9% on the week. Silver also had a good week, up 1.6% to $15.24. Platinum fared even better, gaining 3.2%. Platinum remains undervalued compared to gold. Gold continues to form what appears to be a bullish pennant pattern. A breakout could be imminentthis would occur above $1,430 and target up to $1,485. Given the recent high at $1,442, that took out the 2013 high of $1,434, suggesting to us that not only had gold broken out following a six-year bear market but it was now going to go higher. Gold formed what appears to be a cup and handle formation (the cup formed in the July to December period of 2018 while the handle was the pullback from February to May 2019). The cup and handle formation projects to the $1,530-$1,535 area. Note the high volume for gold as it busted through $1,400 in late June and early July. It was the first time through $1,400 since 2013. Despite the breakthrough many still do not believe in gold. When you have been down so long people tend to forget you even exist. While many gold analysts have become excitedly bullish, that has not yet spread to the world of funds who have largely ignored gold for years. Low interest rates help gold, making it more attractive to hold. And despite what some people say, gold remains a store of value. Central banks have been large buyers of gold over the past several years, particularly Russia and China as they seek to strengthen their currencies. If gold continues to rise, vulnerable currencies could be those who hold little or no goldlike Canada. The Bank of Canada sold all its gold a few years ago, including its hoard of Edward VII 19121914 coins.
Source: www.cotpricecharts.com
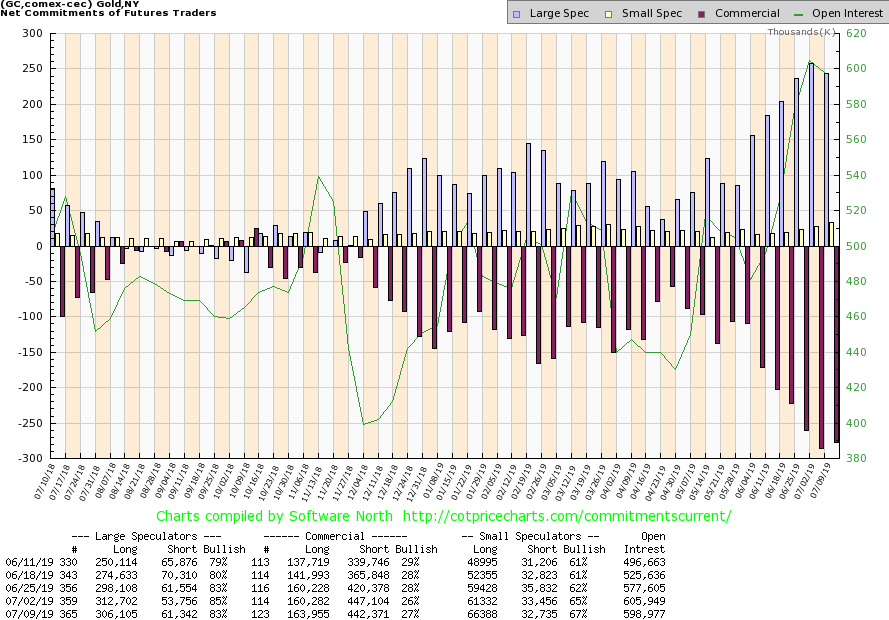
The commercial COT for gold improved slightly this past week to 27% from 26%. Long open interest rose over 3,000 contracts while short open interest fell almost 5,000 contracts. This suggests the commercials may have covered some of their shorts on the recent plunge. The commercial COT has improved, but is still not where we would call bullish. Nonetheless, the commercial COT can continue to fall even as the gold price moves higher. We have seen that in the past. The large speculators COT (hedge funds, managed futures, etc.) fell to 83% from 85%. They cut their long position by over 6,000 contracts while hiking their short position by about 8,000 contracts.
Source: www.stockcharts.com
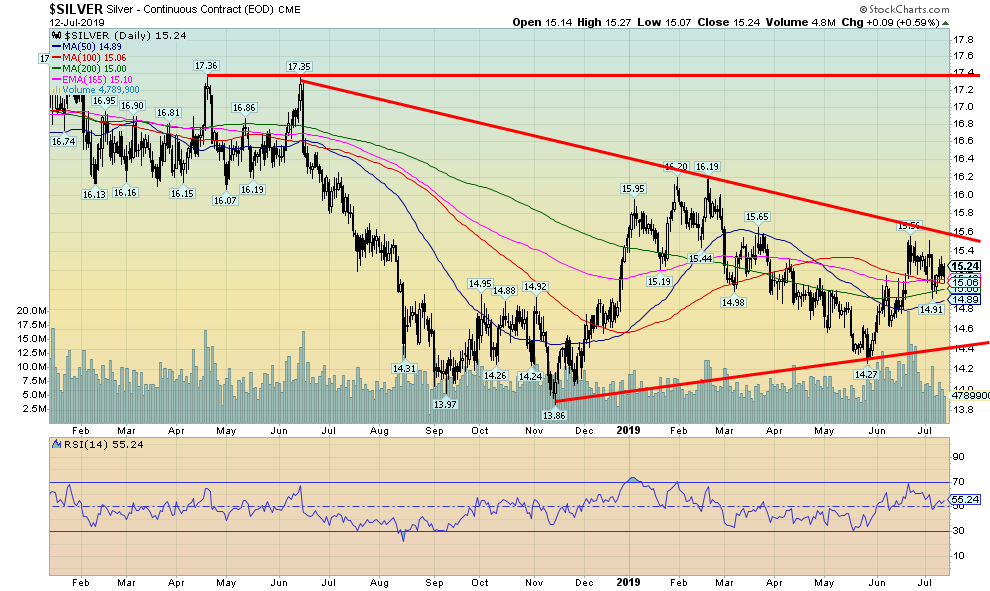
We continue to be concerned about silver lagging behind the gold price rise. This is a significant divergence. Like the stock indices confirming each other by making new highs we also want to see gold and silver making new highs (or lows) together. At $15.24, silver is well off its recent highs of $16.20 seen earlier this year. Gold has broken out of a 6-year base. Silvers breakout point remains some distance away at $18. Even the 200-day MA is up at $16.25. Silver has a lot of work to do to catch up to gold. The gold/silver ratio at almost 93 is in the stratosphere when compared to past levels. Even to get it at least down to 70, which is somewhat more reasonable, would require silver today to be at $20. By all measurements silver is grossly undervalued compared to gold. Silvers failure to lead gold is worrisome because it could suggest a sudden failure for both gold and silver down the road.
Source: www.cotpricecharts.com
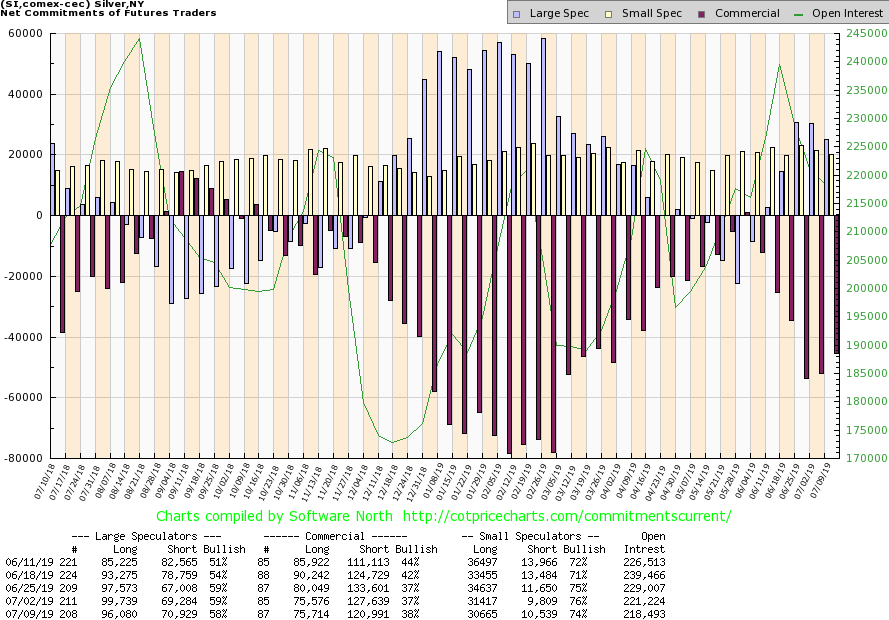
The silver commercial COT remains bullish and improved to 38% from 37% this past week. Long open interest remained steady as short open interest fell almost 7,000 contracts. The large speculators COT slipped to 58% from 59%. The silver commercial COT remains bullish despite coming down from its recent highs.
Source: www.stockcharts.com
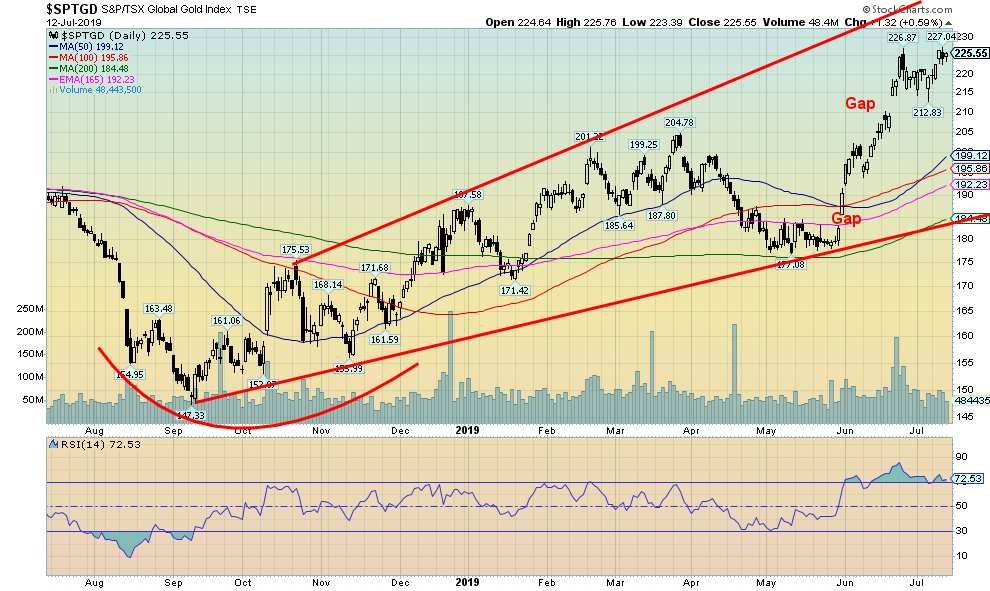
Silver may not be leading, but maybe the gold stocks are leading. The TSX Gold Index (TGD) gained almost 3% this past week, making new 52-week highs in the process. The Gold Bugs Index (HUI) fared even better, gaining almost 4% and firmly making new 52-week highs. The TGD is now up almost 21% on the year and the HUI up almost 25%. Considering both were at one point down on the year, the turnaround is encouraging. We note the two gaps on the TGD. The first gap appears as a breakaway gap while the second gap appears as a measuring or running gap. In technical analysis, a measuring gap may mean that the stock or index is only at its half-way point. That implies the TGD has the potential to rise to 250 or higher another 10% + from current levels. Individual stocks may rise even more. After seeing volume rise on the breakout volume has tailed off as the market pauses. Still the RSI remains too high over 70, so it may still need a bit more consolidation. Wed only be concerned if the TGD fell back under 210 closing the gap. Note what appears to be a rising megaphone pattern. This suggests that the TGD has considerable room to rise further.
Source: www.stockcharts.com
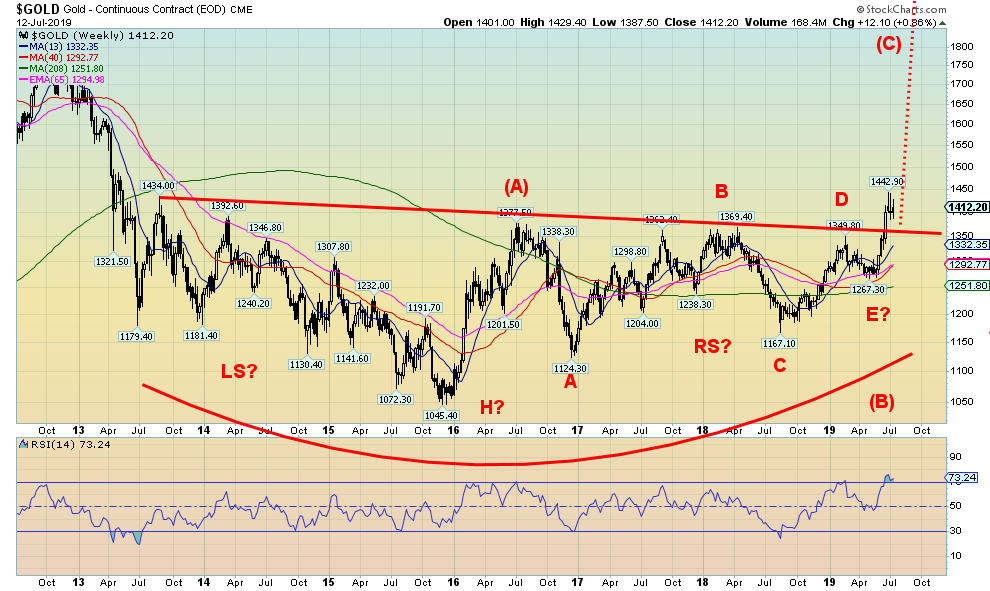
We continue to show this 6-year chart of gold and the huge base that formed. It appears to us as a huge head and shoulders bottom with the left shoulder forming from 2013 and the right shoulder forming since 2016. The head was seen in 2015 when gold bottomed at $1,045. That most likely was golds 7.8-year cycle low. It was last seen in October 2008. The next one would be due October 2022 with a range of December 2021 to July 2023. The major breakout suggests a potential run by gold to $1,725$1,750 with a minimum objective of $1,442. Currently $1,442 stands as the high but, as we noted, we appear once again poised to go higher. The next target would be $1,500 to $1,550.
Source: www.stockcharts.com
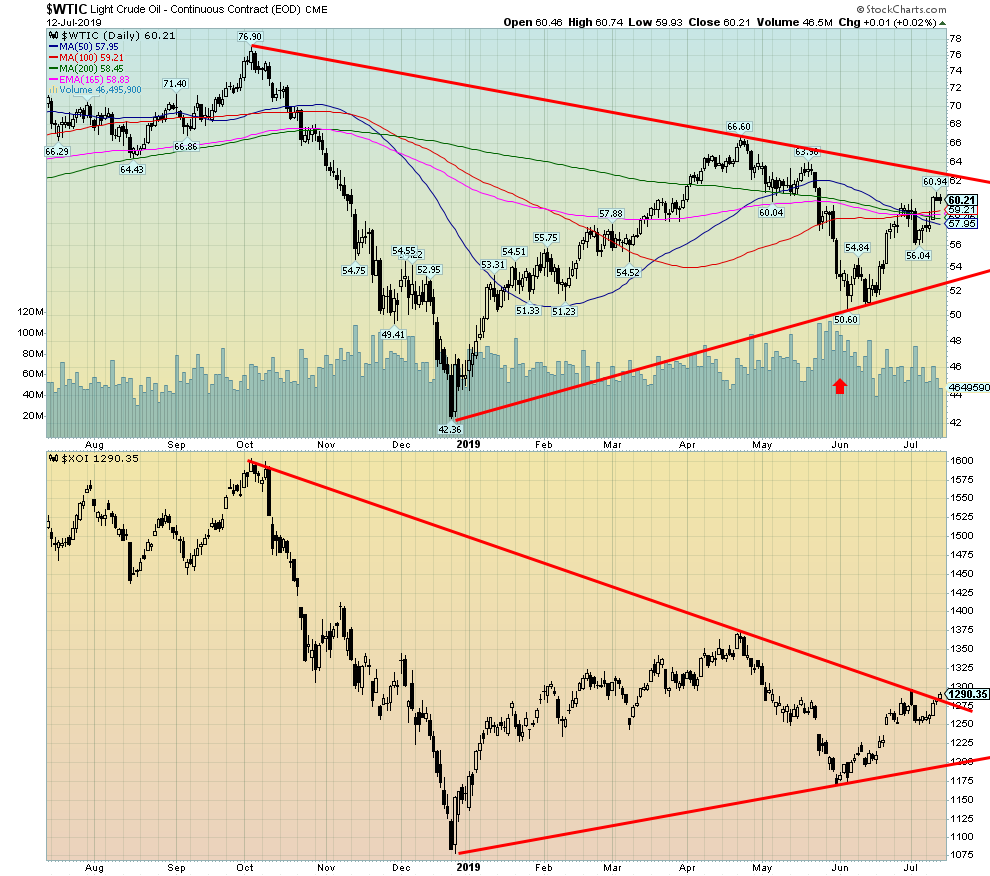
Tensions in the Persian Gulf with Iranian speed boats buzzing British oil tankers and a hurricane in the Gulf of Mexico headed for the Louisiana coast and the oil refineries helped to spark a rally in WTI oil this past week. WTI oil rose 4.7% to $60.21. That remains short of a major breakout seen above $62. The U.S. Oil & Gas Index (XOI) gained 2.3% on the week and appears to be trying to break out over its downtrend line. Canadas TSX Energy Index (TEN) gained 2.7% on the week but remains well off any breakout. We have to be concerned by the high volume on the recent decline to $50.60 and the feeble volume seen on the recent rise. It would appear by volume that the downside is favoured over the upside. We remain cautious on oil and energy stocks.
Chart of the Week
Source: www.stockcharts.com
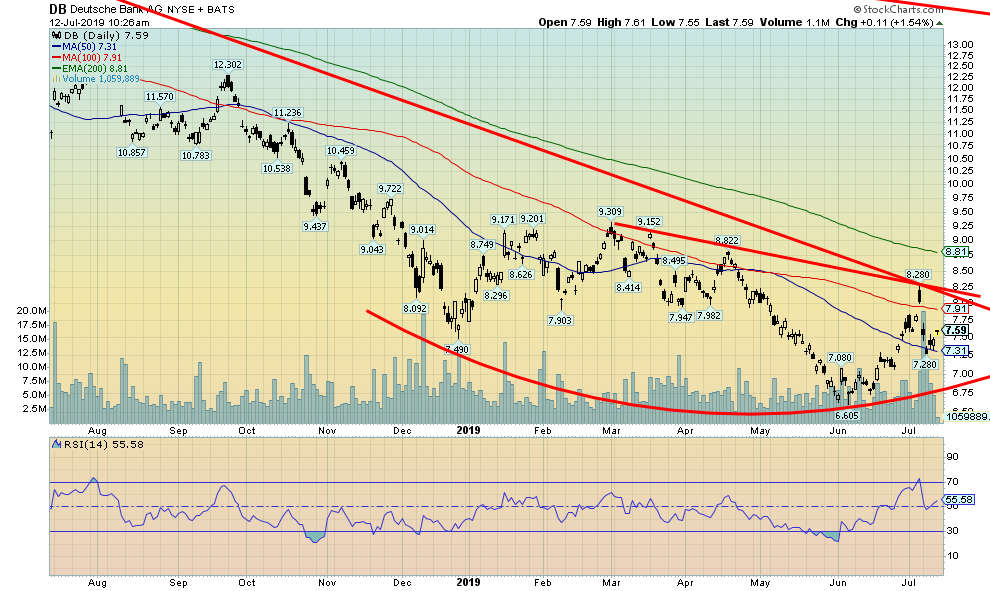
Bye, bye, Deutsche Bank (DB/NYSE). Or maybe not. Deutsche Bank has been relentlessly pounded down for years. The sick bank of the EU. Deutsche Bank has experienced a downward spiral of declining revenues, expenses they cant get rid of, lowered credit ratings, and rising funding costs. It is plagued with outdated technology, acquisitions that didnt work, top people leaving, and heavy fines$17 billion in the past decadefor misconduct. It has also gone through an attempt at a merger that failed. And finally, it has been connected with money laundering and what is proving to be an embarrassing connection to U.S. President Donald Trump and his son-in-law Jared Kushner through loansbillions of dollars worth.
Deutsche Bank is the worlds 15th largest bank by assets, but it is a mere shadow when one considers revenue and profit. Losses pop up everywhere, especially in its investment banking arm. It has siphoned off its bad loans into a separate unitthe bad Deutsche Bank. Deutsche Bank has been called the next Lehman Brothers waiting to happen. It has a monstrous derivatives portfolio, one of the largest in the world.
Maybe it feels like Lehman Brothers all over again with its announcement that they are shedding 18,000 employees, one-fifth of its workforce. A big chunk of it will be in their investment banking arm in New York. There was the iconic picture of an employee leaving carrying her plant, just like a comparable picture seen at the Lehman Brothers collapse in 2008. A collapse of Deutsche Bank would make Lehman Brothers look like a Sunday school picnic. But that probably wont happen. Instead, Deutsche Bank will just continue to bleed to death.
Maybe everyone should just watch a movie about the financial collapse of 2008. They are illuminating. Some of the best are:
1. The Big Short (2015)
2. Too Big to Fail (2011)
3. Inside Job (2010)
4. Capitalism: A Love Story (2009)
5. Wall Street: Money Never Sleeps (2010)
6. Margin Call (2011)
7. The Queen of Versailles (2012)
TECHNICAL SCOOP Charts and commentary by David Chapman Chief Strategist, Enriched Investing Inc. Phone: 416-523-5454 Email: david@davidchapman.com dchapman@enrichedinvesting.com Twitter: @Davcha12 July 15, 2019 |


