

Keith Weiner
Last week, we looked at the idea of a national balance sheet, as a better way to measure the economy than GDP (which is production + destruction). The national balance sheet would take into account both assets and liabilities. If we take on another $1,000,000 debt to buy a $1,000,000 asset, then we have not added any equity. This is so, even though assets have gone up. But unfortunately, as a consequence of assets going up, consumption goes up. This is the much-vaunted wealth effect.
The Wealth Effect
However, we abandoned this approach due to a problem that the falling interest ratewhich is going on just about 40 years!causes assets to rise in value. The Fed cannot print real wealth of course (though people certainly feel richer!) But its falling interest rate causes asset prices to rise. And this gain in nominal dollar value is misleading, the perceived gain in wealth is illusory.
Unfortunately, belief that this is real wealth is reinforced by two factors. One, is simple confirmation bias and wishful thinking. Everyone sees the rising value of their properties or shares and wants to believe they are richer. Two, the purchasing power paradigm encourages them to think of the liquidation value of their assets divided by the cost of living. They think to measure the dollar as the inverse of consumer prices. So if consumer prices are not rising too much, but asset prices are skyrocketing, they feel richer.
If we are to take a proper scientific approach to this field of monetary economicsdare we say monetary sciencewe cannot take a gain in nominal value of assets as an increase in wealth or equity on the national balance sheet. And we cannot fix this, by adjusting for consumer prices, for the many reasons we have been discussing in recent months and numerous times before that.
So we moved on to revisit Marginal Productivity of Debt. Which we still think is a proper approach the decline of irredeemable currency. If we get less and less GDP juice for each dollar of debt squeeze, that is a harbinger of Armageddon to come.
Net Present Value of the Debt
However, a reader in Switzerland suggested that we revisit the concept of net present value of debt, as a way to compensate for rising asset values.
Suppose Wile E. Coyote, CFO of Super Genius Enterprises LLC, sells a $1,000,000 10-year bond to finance the purchase of a $1,000,000 rocket launcher asset. The prevailing market rate of interest is 10%, and thats what SGE is paying. To keep things simple, there are 10 annual interest-only payments and a balloon payment of the principal amount with the last interest payment.
There are 10 interest payments of $100,000, totaling $1,000,000. Plus the principal amount of $1,000,000. So the total paid over the life of the bond is $2,000,000. Alas, this is not the right way to think about this.
SGE is paying over 10 years. All future payments must be discounted. A bird in the hand is worth a bit more than a bird who wont come out of the bush for a year. Or ten years. We use the prevailing market rate of interest to discount future payments.
The NPV of the interest payments is:
$90,000 + 81000 + 72,900 + 65,610 + 59,049 + 53,144 + 47,830 + 43,046 + 38,742 + 34,868
The NPV of the principal amount of $1,000,000 to be paid in ten years is $383,546. So the total NPV of the bond today is $934,868.
Look at what happens if the market rate of interest is cut the next day, to 5%. The present values of the interest payments jump up to $95,000 + $90,250 + And the present value of the principal payment to be made in 10 years is also higher, $658,611. The NPV of the bond is now $1,361,137. That is 46% higher.
This is not a bogus adjustment, like in the game of inflation-adjusted interest rates. In this charade, the rate at which actual lending and borrowing occurs is dismissed as nominal. And the fictitious rate which is interest inflation (itself a fiction), at which no market activity occurs, is called real.
No, unlike real interest rates, the NPV is the price that SGE must pay if it wishes to retire its debt, recapitalize, be acquired, etc. The NPV of the debt, not the face value, is the real overhang pressing down, like a burden on the company.
Anyways for comparison, a 30-year bond issued at 10% has NPV of $904,239. And if the interest rate is cut to 5%, the NPV jumps to $1,706,825, or 89% higher. If the bond was a perpetuity, the NPV would double.
The National Balance Sheet, Revisited
A good first approximation of the national balance sheet would use mark-to-market (i.e. NPV) of all liabilities. This would remove a lot of the illusory gain in wealth. If assets and liabilities both go up, you did not get richer. You did not add equity. You just expanded your balance sheet. And leverage (which has its own dangers and risks).
But there are two problems with this. Consider the case of Road Runner Bank. RRB borrows from its depositors to buy SGE 10-year bonds. Being due on demand, RRB deposits do not go up as the interest rate falls. Of course, the SGE 10-year does. So it would appear that RRB has increased its equity.
The gimmick of duration mismatchborrowing short to lend longhas other problems which we have discussed in the past (including that it is certain to blow up sooner or later). And it should not be used to indicate a gain in equity due to falling interest rates.
The second problem goes deeper. There is no extinguisher of debt in an irredeemable currency. We pay debts using irredeemable currency, which is just an I.O.U. This shifts the debt, but does not extinguish it.
Therefore, we argue, all debt should be treated as perpetual. The price that RRB must pay to get out of debt may not be rising. But the debt itself never goes out of existence. It is merely shifted from party to party. The national balance sheet carries that debt in perpetuity. Therefore, we argue that it should be treated as a perpetuity.
Each time the rate of interest is cut in half, the NPV of all debt extant doubles.
Adjusted GDP
We now have a calculable formula. Add up all assets (which automatically go up, as rates fall). And add up all liabilities, manually adjusting them for falling interest rates.
Note that most assets do not double when rates fall. Thats because most assets are not perpetual. They have a finite life.
The change in the equity account may be used to adjust GDP. That is, if GDP is $10,000,000 but the equity account dropped by $1,000,000 then we could restate GDP as $9,000,000.
Boy, wouldnt that upset the apple cart! Many peoples heads would explode, if they are forced to reckon with the fact that pasteurized, homogenized American Cheese Food is not cheese, that a sea horse is not a horse, that if a Southern Belle says bless your heat she is not giving you a benediction, that iron pyrite is not gold, and that the wealth effect is not wealth.
Bond speculators, stock speculators, and real estate speculators do not know that they are not getting richer. That the farm is not producing a more bountiful harvest, and they are merely eating the seed corn. One of our hardest problems in teaching a rational view of economics is that many of these folks to not want to know.
They want not to know.
We are gratified that our audience is global, and growing. However, though we consider ourselves of the mainstream (we upset the gold bugs as much as we do the Fed apologists) we are not in the mainstream. To say that gold is money already puts you well outside the Overton Window. To say that falling interest rates cause capital consumption, well, one may as well make a lewd bodily noise at a wedding reception.
Why Interest on Gold Matters
We reiterate that in gold, unlike in irredeemable currency, the interest rate is stable. This evil creature of falling interest lives only in Fed World, not in Gold Land. Thats why our mission is to pay interest on goldto make it profitable to invest in the gold standard.
We end with a quote:
That which can be destroyed by the truth, deserves to be destroyed by the truth. widely but falsely attributed to Carl Sagan. It may be from a novel by P.C. Hodgell.
Supply and Demand Fundamentals
The prices of the metals went up +$15 and +$0.23. We will be brief this week, as Keith just got off a 17-hour flight from Perth to London.
Stocks continue their march upwards. And hence the gold price seems stalledor is it?
It may seem like gold goes up, when stocks go down and vice versa. Thats been the recent pattern. Why should people own money without return, when stocks are where the action is? But actually, we have done some research recently. And put together a white paper, to look at what gold does for a dollar-denominated portfolio. We replicate the same research that many others have done before: it reduces volatility and drawdowns, and improves the Sharpe Ratio (we also add analysis of what a yield on gold doessurprise, it enhances overall returns).
Anyways, the point being that gold is not particularly correlated to stocks or bonds.
There is a tension between stocks are where the action is vs stocks are risky here. Between falling interest and rising assets vs if they dont offer much interest, its better to own money with no risk.
Is now the turning of the trend? The price action sorta suggests it. But anecdotally, talking to several dealers, we hear that retail owners of coins and small bars have been taking advantage of the now-higher prices to dump their gold, to get out. Indeed we see bids on 1oz gold Eagles below spot price.
This is what chartists call resistance. Long-suffering holders (HODLers?) waited for their opportunity to exit a speculation that was long underwater and now hated. Its hard for the price to go higher, until that wave of selling abates. Some of them have been suffering a long time, as the price of gold peaked eight years ago, in 2011.
The prices of the metals fell, with that of gold -$9 and silver -$0.32. Of course, it was a week of stock market exuberance. Why would anyone want to own money, or seek safety when the Fed can seemingly push interest down / assets up indefinitely? As the old TV ad for Lotto proclaimed you gotta be in it, to win it!
In the meantime, we saw a fascinating graph comparing the bitcoin price to the market cap of USD Tether. We are not entirely sure what to make of it, but it suggests that the more dollars which pour into tether, the more the price of bitcoin is pushed up.
Monetary Metals is excited to be bringing the first gold bond to market. Please contact us if you are interested in investing.
Now lets look at the only true picture of supply and demand for gold and silver. But, first, here is the chart of the prices of gold and silver.

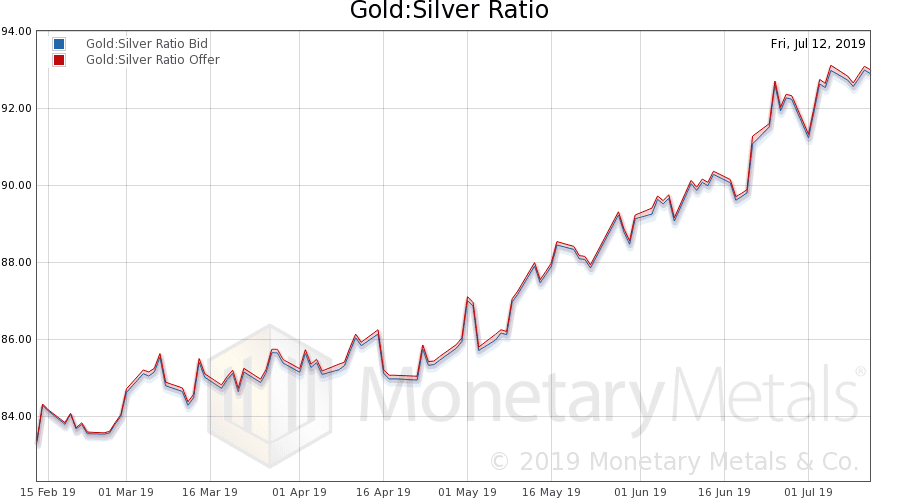
Next, this is a graph of the gold price measured in silver, otherwise known as the gold to silver ratio (see here for an explanation of bid and offer prices for the ratio). The ratio dropped back a bit.
Here is the gold graph showing gold basis, cobasis and the price of the dollar in terms of gold price.
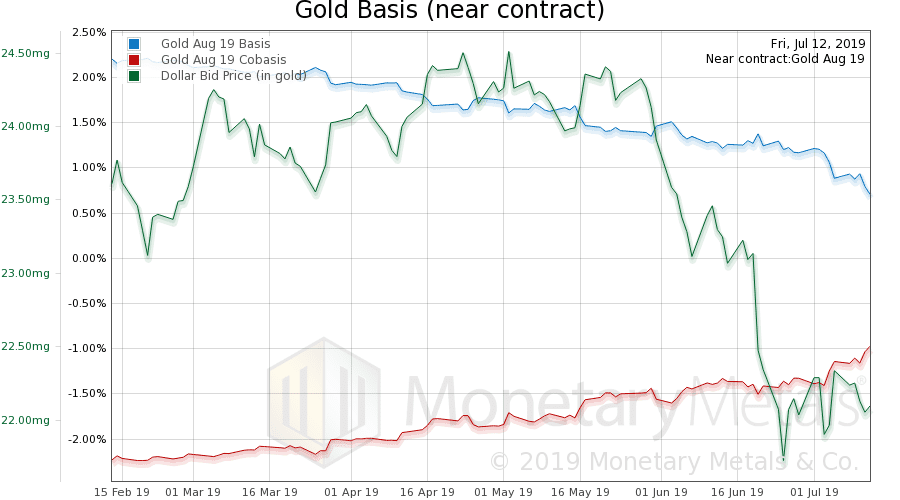
Take this chart with a grain of salt, as the August contract is close to First Notice Day. Scarcity (i.e. cobasis) looks strong, but its an artifact.
The Monetary Metals Gold Fundamental Price fell another $12 to $1,407.
Now lets look at silver.
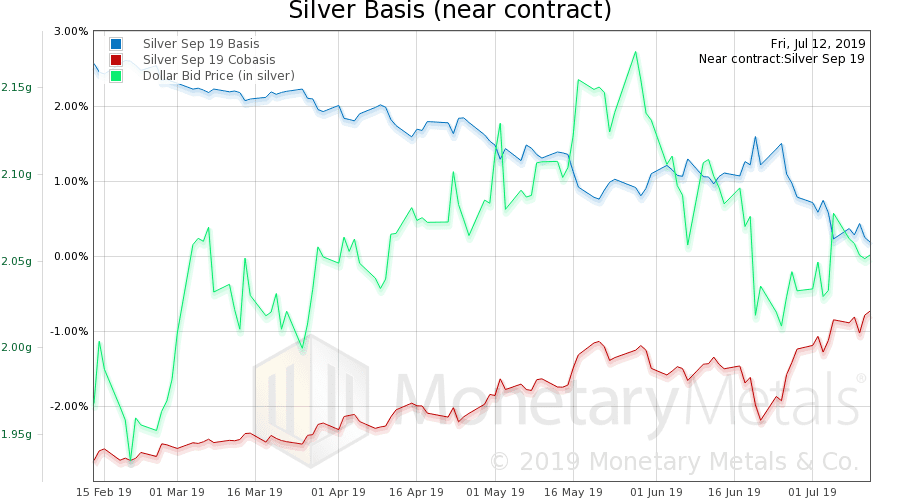
With silver, we see same pattern. Except this contract is not so close to expiry.
The Monetary Metals Silver Fundamental Price went up 8 cents to $15.52.
© 2019 Monetary Metals


