-- Published: Friday, 20 September 2019 | Print | Disqus
Gary Tanashian, NFTRH
The signals have persisted since the May lows in the Semi sector and in the broad markets. Nominal Semiconductor (esp. Semi Equipment) stocks and the sector’s market leadership have remained intact into our window for a projected cycle bottom, which was the 2nd half of 2019.
This post shines a favorable light on the Semiconductor sector while at the same time acknowledging that may have little to do with the broad market’s fortunes as Q3’s reporting begins next month. In other words, while we have been projecting new highs for the S&P 500 on the very short-term, there are fundamental and technical reasons to believe the stock market could be significantly disturbed in Q4. But the Semi sector is an economic early bird. Let’s remember that.
Reference first…
Nearly $50 Billion in Fabs to Start Construction in 2020
By the end of the year, 15 new fab projects with a total investment of US$38 billion will have started construction and 18 more fab projects will kick off construction in 2020. Of the 18, 10 fab projects with a total investment value of more than US$35 billion carry a high probability. The other eight, with a total investment value of more than US$14 billion, are weighted with a low probability of materializing.
See also…
Semiconductor Industry Upturn by Early 2020?
Taiwan-based wafer foundry sales are often a leading indicator of global semiconductor shipments (Chart 7). They turned up significantly in August. Per Chart 8, SEMI equipment and semiconductors will likely be led by foundry sales, reinforcing the prediction of a resumption in semiconductor chip and capital equipment growth in late 2019 or early 2020.


As a side note to the above, I do not see an indisputable tendency of Foundry sales to lead Equipment and Semiconductors, but let’s work with the author here, as he is an industry analyst and I am not.
Moving on to this old NFTRH chart showing the leadership (up through 2017, down through 2018 and up for the entirety of 2019 so far) of two premier Semi Equipment companies vs. the broad Semiconductor sector. We have long viewed the leadership of these companies as important to future economic cycles.

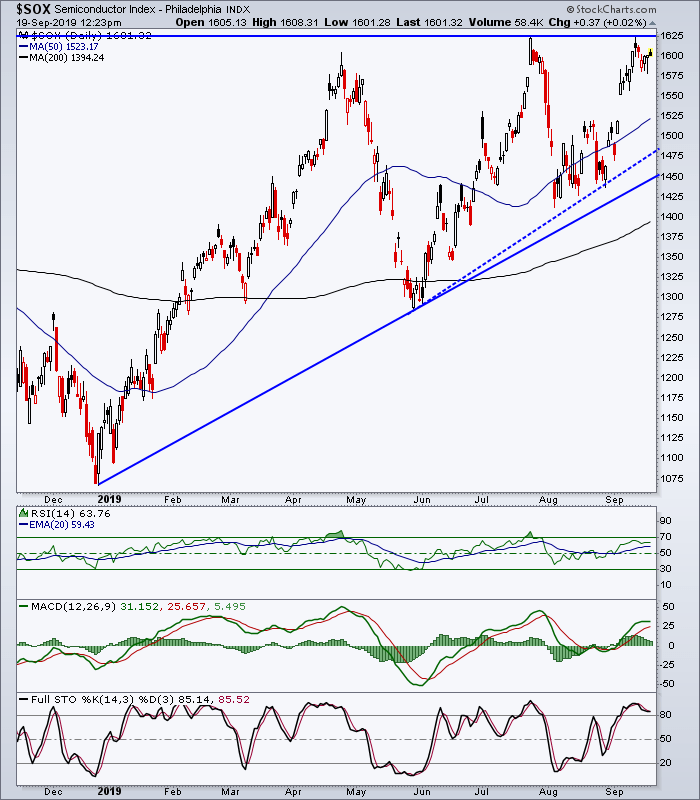
As for the sector as a whole, the charts are not begging to differ with a positive 2020 in the least. The daily SOX index is in up trends by both its 50 and 200 day moving averages and is also in something of a bullish ascending triangle.

Listen market and economy bears, I am reporting what I see. That is what Men Who Stare at Charts must always do, regardless of their bias (mine happens to be a desire for a hard bear market).

The weekly chart shows thick support between 1400 and 1450. Could some upcoming Q4 market turbulence knock it down that far? Sure could. Would it still be bullish? Sure would.

Here is a giant Cup & Handle on the monthly chart. Those are bullish you know. Now of course an even larger one on Silver proved fatal in 2011, so there is a caveat to this post and to any Man (or Woman) staring at charts and trying to transfix you with the deep and mysterious things they see. The fact is chart patterns change, Elliott Wave counts change and conveniently the chartists change with them.
But taken at face value the Semi sector has made a higher right side to the Cup, made a Handle consolidation in 2017-2018 and has broken to new all-time highs. The 2000 high happens to be just below the thick support area shown on the weekly chart above. Short of a break and hold below 1350, the Semiconductor index is bullish on its big picture.

Bottom Line
- Semiconductor industry analysts have been projecting an H2 2019 bottom for the Semiconductor sector cycle, after extreme growth followed by inventory buildup whacked the industry in 2018.
- In 2013 we used the sector as a canary in the economic coal mine. It chirped and we projected an economic up phase out ahead. The economy then ground upward over a span of months and years culminating in 2018’s ‘as good as it gets’ economy (ref. the economic laggards, payrolls and unemployment levels).
- The canary has been on life support, but he’s not dead yet and the charts currently say he’s going to chirp again. Industry data are still preliminary and tentative, but the balance of the picture indicates a strong Semi sector in 2020.
- This would paint any coming stock market correction, mini or maxi, as a blip before a bullish resumption into the next US presidential election.
- As for the various ‘reflation trades’, they should participate if cyclical inflation is at the root of it, which I think stands a good chance of being the case. The counter-cyclical gold stock sector would no longer be uniquely featured in such a situation (as it was this past summer and could be again in Q4), but it could participate if we echo the 2003-2008 phase where its fundamentals degraded and its prices kept rising.
Subscribe to NFTRH Premium (monthly at USD $35.00 or a discounted yearly at USD $365.00) for an in-depth weekly market report, interim market updates and NFTRH+ chart and trade setup ideas. You can also keep up to date with actionable public content at NFTRH.com
| Digg This Article
-- Published: Friday, 20 September 2019 | E-Mail | Print | Source: GoldSeek.com

