-- Published: Monday, 23 September 2019 | Print | Disqus
By: Avi Gilburt
The pundits and the media were debating for several weeks leading up to the last Fed meeting about what the Fed was going to do and the effect they thought it would have on the market. And, it amazes that the great majority of the market does not realize how much of a waste of time these debates really are.
But, as I often note, many market participants and analysts are simply not burdened by the facts. If they really would review the facts of market history, they would learn that there is no one that can control the market. PERIOD.
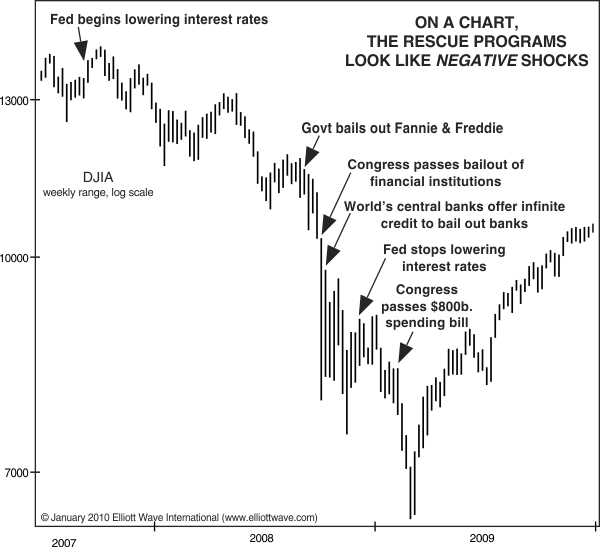
For those that believe otherwise, and are so certain that the government or the Fed can control our markets with their actions, please review this chart. Hopefully you will see just how powerless any entity is if they attempt to prevent market declines.
In fact, I have written about this many times and have outlined many periods of time during which it was abundantly clear that no entity can prevent market declines.
Within past write ups, I even highlighted how we have seen more double digit market declines since the advent of the Plunge Protection Team than before:
In fact, the following instances are just some of the highlights of volatility since the supposed inception of the Plunge Protection Team:
- February of 2001: Equity markets declined of 22% within seven weeks;
- September of 2001: Equity markets declined 17% within three weeks;
- July of 2002: Equity markets declined 22% within three weeks;
- September of 2008: Equity markets declined 12% within one week;
- October of 2008: Equity markets declined 30% within two weeks;
- November of 2008: Equity markets declined 25% within three weeks;
- February of 2009: Equity markets declined 23% within three weeks.
- May of 2010: Equity markets experienced a "Flash Crash." Specifically, the market started out the day down over 30 points in the S&P500 and proceeded to lose another 70 points within minutes. That is a loss of 9% in one day, but the market did manage to close down only 3.1% in one day!
- July of 2011: Equity markets declined 18% within two weeks
- August 2015: Equity markets decline 11% within one week
- January 2016: Equity markets decline 13% within three weeks
- January 2018: Equity market decline 16% within three weeks
- October 2018: Equity market decline 12% within three weeks
- December 2018: Equity market declines 13% within 3 weeks
Based upon these facts, you can even argue that significant stock market "plunges" have become more common events since the advent of the Plunge Protection Team, especially since we have experienced more significant "plunges" within the 20 years after the supposed creation of the "Team" than in the 20 year period before.
In fact, in a prior article, I even outlined how central banks have clearly been unable to control their own currencies, as I have noted the US and China currencies as historical examples.
This now brings us back to Treasuries. And, the great majority still erroneously believe that the Fed controls our interest rates. Yet, over the last year, I think anyone who has been paying close attention should realize that the Fed has no control over that market either.
Back in November of 2018, I faced this issue head on. In fact, I noted to my subscribers that I was going long TLT when it dropped into the 112/113 region. And, many of my own subscribers told me I was crazy because the Fed was still raising rates. But, I take my cues from the market, not the Fed. And, I was proven correct again that it is the market that dictates direction, and not the Fed.
For those of you who have not seen my history regarding bonds, I just want to repost a recap I have provided in past articles:
Let me take a moment to recap my recent history and perspective on bonds. For those that followed our work over the years, you would know that we called for a top to the bond market on June 27, 2016, with the market striking its highs within a week of our call. Right after that top call, TLT dropped 22%, until we saw the bottoming structure develop in late 2018.
So, in November of 2018, I noted to my subscribers that I was going long TLT just as it broke below the 113 level. At the time, many were telling me that I was crazy to go long bonds, as the Fed was still raising rates. The main reason many thought I was crazy was that you cannot fight the Fed.
Well, in my case, I recognized that the Fed cannot fight the market. And, the market was suggesting to me that it was bottoming out and about to turn up quite strongly. In fact, back in the fall of 2018, we set our minimum target for this rally at the 135/136 region. As the market rally developed in structure, we began to look towards the 139/140 region. And, when the market struck the 140 region, I took my profits on the longs we entered at 112/113.
Admittedly, I did not capture the further rally in TLT from 140 to 149. But, I also recognize that I will never be able to capture every point the market offers. So, I was quite satisfied with banking the gains we earned from 113 to 140. For those that may not realize it, I raised cash when the stock market broke below the 2880SPX region last year, and placed that money into TLT. Since then, the market is 4% higher than when I took out my cash, whereas I earned 24% on that cash in the TLT.
Moreover, I also recognized that the market was going to come back down to my exit point and I would then be able to determine if I want to re-enter the market. In fact, on September 1st, I wrote the following:
At this point in time, I am seeing a structure developing a top in the TLT. While the TLT may see a bit higher before it turns down, I think the market can drop back down to the 137-140 region in the coming months. And, depending upon how the market pulls back into this target region will tell me if I should consider another long position to target the 151+ region. But, that will be a game time decision in the coming months, as it will all depend upon market structure.
The very next day that the market opened, the TLT began a decline which has seemingly bottomed at the 136.54 level. Since that time, the market seems to have provided us with a 5-wave rally off that low. So, what do we do now?
Well, as long as the market remains below the 143 region, I would want to see a corrective decline take us back down into the 138-140 region. Should we see a corrective a-b-c structure down into that support region, I would consider taking another long position, with a target of 151 for TLT in the coming months. So, the manner in which the market reacts over the coming weeks will be quite important to tell me whether I want to try one more long trade in bonds or not.
See original article with chart illustrating the wave counts on the TLT.
Avi Gilburt is a widely followed Elliott Wave analyst and founder of ElliottWaveTrader.net, a live trading room featuring his analysis on the S&P 500, precious metals, oil & USD, plus a team of analysts covering a range of other markets.
| Digg This Article
-- Published: Monday, 23 September 2019 | E-Mail | Print | Source: GoldSeek.com


