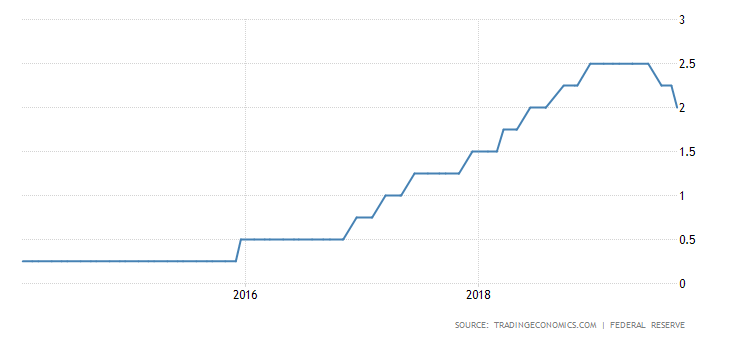
As expected, the Fed cut the key banking rate another quarter point this past week to 1.75%-2.00%. It is the second cut this year. Expectations by many are for one more, but there are many who expect the Fed to be done for the year. The Fed as usual was ambiguous. If there is one more, we would not expect it to happen until the December FOMC.
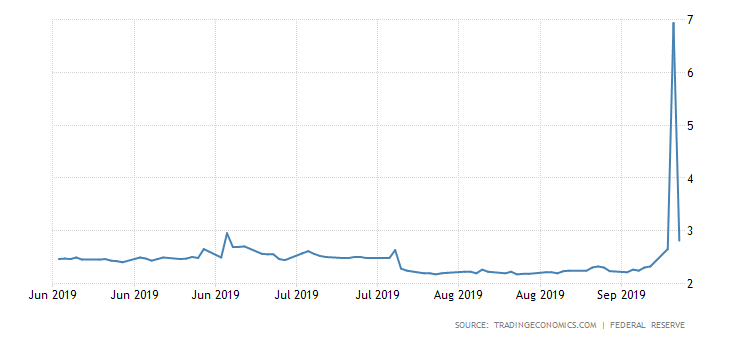
But the real story of the week may have been the action in the overnight repo market. The term may throw off non-market people, but for the short-term money markets it is a very key market. For starters, what is the repo rate? Simply, it is defined as the discount rate at which a central bank repurchases government securities from the commercial banks, depending on the level of money supply it decides to maintain in the country's monetary system. ...Repo is short for repossession.
It is, however, not just limited to the central bank as banks and dealers are active in the overnight repo market as well, lending overnight funds against collateral. Depending on the credit of the collateral the repo rate can vary. Many securities may not be eligible for repo due to a low credit rating. The repo market is huge. In the U.S., average daily volume is estimated at $3.9 trillion. Repo dealing desks exist not just in the U.S. but in major money markets around the world, including Canada.
So, what happened? The overnight repo rate leaped to a high of 10% this past week from its normal 2-2.25%. It only fell once the Fed pumped roughly $75 billion into the markets, not just once but every day for four days. The last time markets had been this violent in the overnight repo market was 2008. We all know what happened then.
In 2008 markets were violent because of the fear of financial collapse surrounding the Lehman Brothers debacle. This time it appears to be have been a gross mismatch of funds in the markets. U.S. companies withdrew apparently upwards of $100 billion for tax payment deadlines. The U.S. Treasury had to settle a $78 billion issue of coupon bonds and bills. Add in the demand for funds because of the surge in oil prices, coupled with ongoing distortions because of the Fed unwinding QE and what happened was a classic cash squeeze in the market. Rates soared.
The fact that the Fed had to get involved to calm the markets is a sign, we believe, of growing instability in markets. The world, as we know, is highly indebted with an estimated $250 trillion or more of debt outstanding. Most of it is outside the money markets as loans and many other forms of debt are not marketable so they do not trade. It is the market for securities, bonds, bills, notes, commercial paper, bankers acceptances, and many others. It includes paper of governments, corporations, and financial institutions. Active participants include banks, investment dealers, and brokers but also many corporations with large money market requirements.
Interest rates globally and historically are low including, as we have noted, $17 trillion of negative rate debt primarily in the EU and Japan. Interest rates have to stay low. The world would not be able to withstand a rise in interest rates. Central banks around the world would be forced to intervene to try and push rates down if dislocations and mismatches occur. The Fed is lowering rates in response to a potential global economic slowdown. But the central banks influence primarily short interest rates while long interest rates are market oriented. If rates start to rise to even 3% or higher for 10-year bonds and notes it could cause a bond collapse resulting in a market panic as a debt crisis spreads.
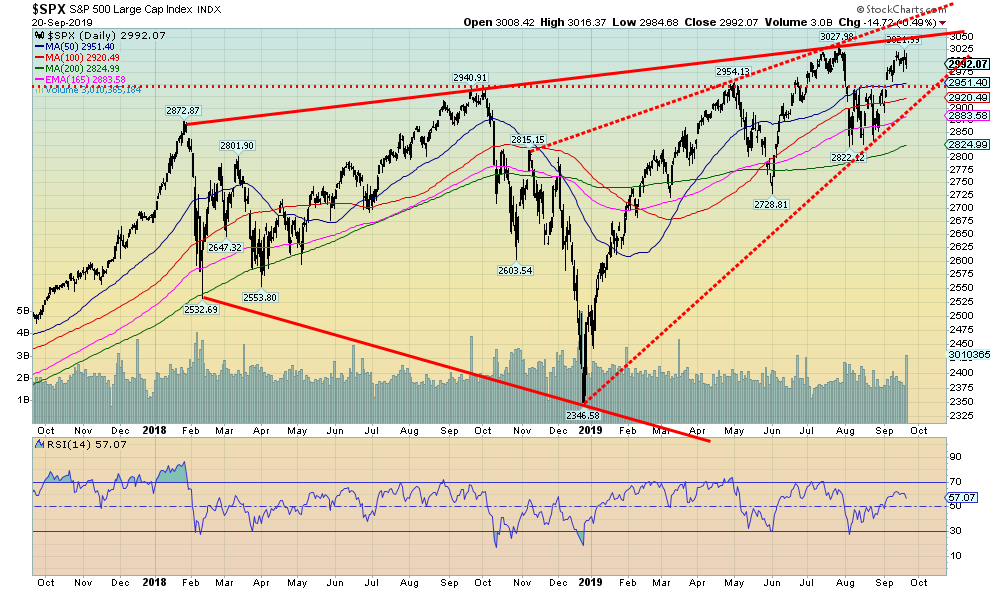
For the first time in four weeks, markets closed lower this past week. The S&P 500 fell 0.5% while the Dow Jones Industrials (DJI) was off 1.1%. Hardest hit was the Dow Jones Transportations (DJT), losing 3.3%. Gainers were rare this past week. The TSX Composite soared to new all-time highs, gaining 1.3% this past week while the Tokyo Nikkei Dow (TKN) was up 1.3% as well.
More tensions between China and the U.S. surfaced over trade and that was enough to put a damper on the markets irrespective of the Feds rate cut. Concern remained over the drone bombing against Saudi Arabias oil fields as the U.S. was sending troops to the kingdom. The Fed cut rates as expected, but questions remained about further rate cuts and there was a sense as to just how much this would accomplish against a backdrop of a slowing global economy. There was concern about the Feds operations in the repo markets where cash shortages had developed. These repo operations are now expected to continue into October. There are more bond and bill auctions coming up and the volume, coupled with the settlements, is weighing on the market. If weak demand develops for the bond auctions, interest rate yields would rise again and bond prices fall (prices move inversely to yields).
The picture above of the S&P 500 shows it is once again up against the top of the broadening channel. Failure to make new highs or break through the top of the channel could set up a potentially dangerous double top on the charts. This pattern is being repeated elsewhere. A gap down through 2,950 would be dangerous and suggest an island top. If the ascending wedge pattern is correct, a breakdown through 2,900 suggests a big drop ahead. Confirmation comes with a breakdown under 2,800. While the NYSE advance decline remains positive, it is beginning to roll over with the market. There is little encouragement elsewhere where numerous charts are failing at channel tops, and, experiencing declining volume typical of a topping pattern. Put buying is growing and normally that might be a positive sign. The market, however, has not yet fallen.
The fall equinox can often bring trend changes in markets even if it is not immediately obvious. We have seen numerous highs in September, including last year, along with famous ones in 1929 and a lower high in 1987. Tops in September saw crashes in October in 1929, 1987, but also 1978 and 1979. Some highs waited until October. There were key highs in October 2000 and 2007 before significant drops in the months to follow.With so many non-confirmations, potential double tops, reaching tops of channels against declining volumes, weakening economic conditions, the potential for rising interest rates, chaos in the repo markets, and, the volatile China/U.S. trade war, caution is advised at this juncture.
As noted, a breakdown could occur under 2,950 S&P 500 and confirmed under 2,800. The TSX Composite doesnt break down until below 16,000. With the TSX Composite up against a channel as well caution is advised there as well. For the S&P 500, a decline into October could last into December/January and fall as low as 2,200 to complete what we believe is either an E wave or a C wave. Either way, a decline of some significance appears to be in the works and should become evident soon.
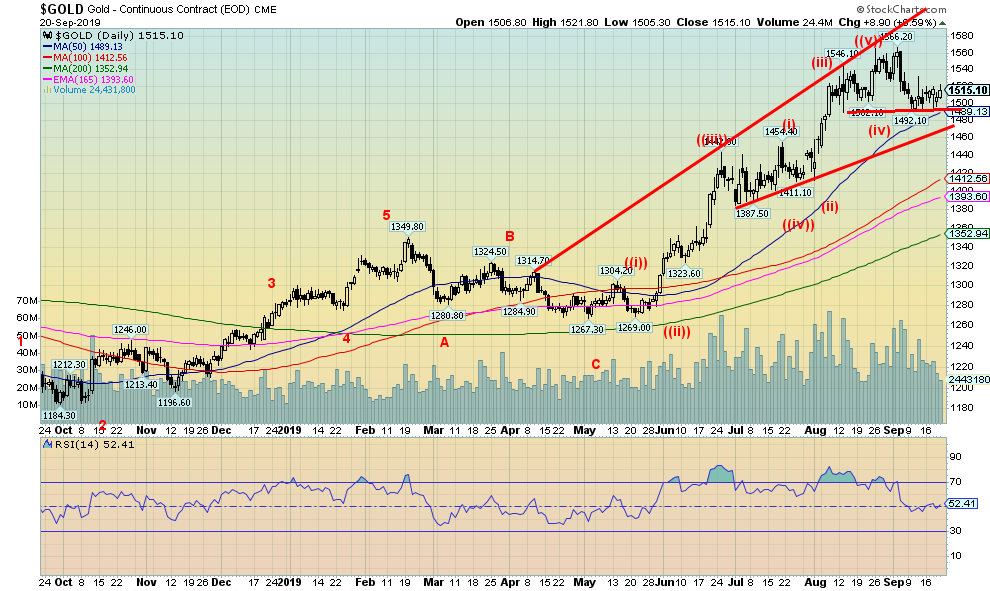
Gold, silver and the gold stocks as represented by the Gold Bugs Index (HUI) and the TSX Gold Index (TGD) enjoyed an up week. Gold gained 1% and silver was up 1.6%, while the HUI jumped 6.9% and the TGD gained 6.5%. Despite the positive week, we are not enamoured with what appears as a potential head and shoulders top forming on the gold chart. Volume tailed off this week even as the market rose. Not necessarily a positive sign. The US$ Index gained a small 0.3% this past week, but it too looks toppy. Normally that would be positive for gold but with a negative pattern forming on the gold chart we are somewhat suspicious as to what actually might happen. The US$ Index could still move higher to unfulfilled targets up around 100.80. Gold breaks under $1,490 and has potential targets down to $1,415/$1,420. There is some interim support at $1,480 down to $1,470. Below that the targets should be achieved.
The silver chart continues to look negative. Its next break would occur under $17.50 and target down to $16.90/$17.00 support. Ultimately, silver could fall to retest levels down to $16. The upcoming period is often difficult for gold and silver. Weakness can last into November or December before the early year rally gets underway. We believe we have a completed a 1 or A wave up and this is the 2 or B wave to form. Even when gold was rising from $680 to $1,900 from 2008 to 2011 there were several corrections along the way, including some that saw gold fall 1015%. So, a correction now would not be unusual.
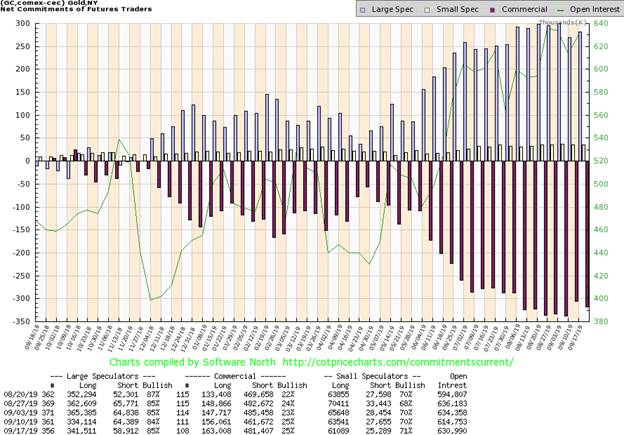
The commercial COT for gold shown below remains at 25% this past week. While long open interest rose roughly 7,000 contracts short open interest jumped roughly 20,000 contracts. That suggests to us that the commercials remain negative and have yet to cover their shorts. Silver is in the same position. Profit-taking on gold stocks would raise cash for buying opportunities that should arise over the next couple of months. An updated Markets & Trends is on the next page.
Note: For an explanation of the trends, see the glossary at the end of this article.
New highs/lows refer to new 52-week highs/lows.
Copyright David Chapman, 2019
Disclaimer
David Chapman is not a registered advisory service and is not an exempt market dealer (EMD) nor a licensed financial advisor. We do not and cannot give individualised market advice. David Chapman has worked in the financial industry for over 40 years including large financial corporations, banks, and investment dealers. The information in this newsletter is intended only for informational and educational purposes. It should not be considered a solicitation of an offer or sale of any security. The reader assumes all risk when trading in securities and David Chapman advises consulting a licensed professional financial advisor before proceeding with any trade or idea presented in this newsletter. We share our ideas and opinions for informational and educational purposes only and expect the reader to perform due diligence before considering a position in any security. That includes consulting with your own licensed professional financial advisor
The content on this site is protected
by U.S. and international copyright laws and is the property of GoldSeek.com
and/or the providers of the content under license. By "content" we mean any
information, mode of expression, or other materials and services found on GoldSeek.com.
This includes editorials, news, our writings, graphics, and any and all other
features found on the site. Please contact
us for any further information.
Live GoldSeek Visitor Map | Disclaimer
The views contained here may not represent the views of GoldSeek.com, Gold Seek LLC, its affiliates or advertisers. GoldSeek.com, Gold Seek LLC makes no representation, warranty or guarantee as to the accuracy
or completeness of the information (including news, editorials, prices, statistics,
analyses and the like) provided through its service. Any copying, reproduction
and/or redistribution of any of the documents, data, content or materials contained
on or within this website, without the express written consent of GoldSeek.com, Gold Seek LLC,
is strictly prohibited. In no event shall GoldSeek.com, Gold Seek LLC or its affiliates be
liable to any person for any decision made or action taken in reliance upon
the information provided herein.