-- Published: Wednesday, 2 October 2019 | Print | Disqus
Jordan Roy-Byrne CMT, MFTA
Several weeks ago both Gold and gold stocks hit major resistance after strong but extended moves. A correction or pause was to be expected. Clearly, we can now say, the sector is in correction mode.
Corrections tend to have three legs: a simple down up down or A-B-C pattern. The gold stocks (and Gold) appear to be on the C leg of that A-B-C pattern.
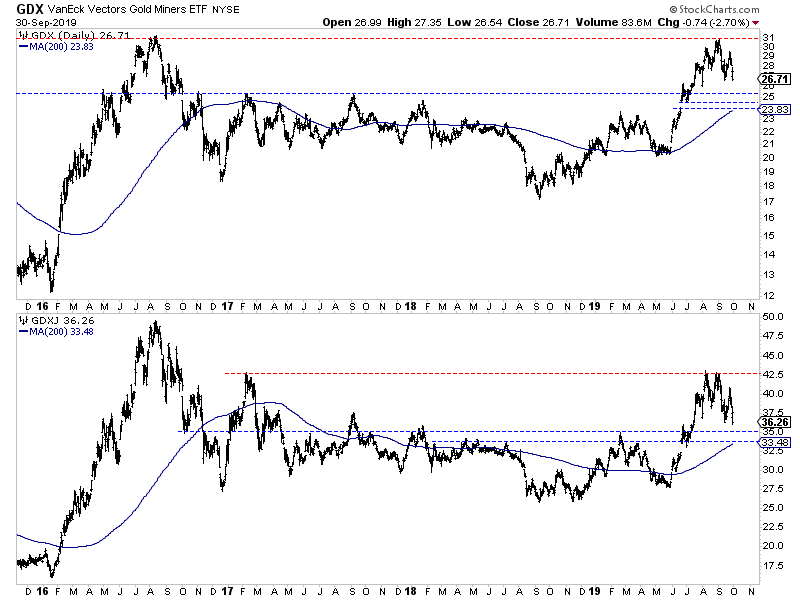
Below we plot the daily bar charts for GDX and GDXJ.
GDX has a confluence of strong support at $24-$25 while GDXJ has support at $34-$35 but could fill its open gap at $32.50 to $33.00.
GDX (top), GDXJ (bottom)
As the correction continues, another thing we will follow is our custom breadth indicators. In the chart below we plot GDXJ along with the percentage of GDXJ stocks that closed above their 200-day moving average, 50-day moving average and 20-day moving average.
At the recent short-term low during the Fed meeting, the percentage of GDXJ stocks trading above the 50-day moving average and 20-day moving average showed a very oversold condition.
Before Monday, the percentage of GDXJ stocks trading above the 200-day moving average was 87%. That needs to decrease quite a bit before we get a sustainable rebound.
GDXJ w/ Breadth Indicators
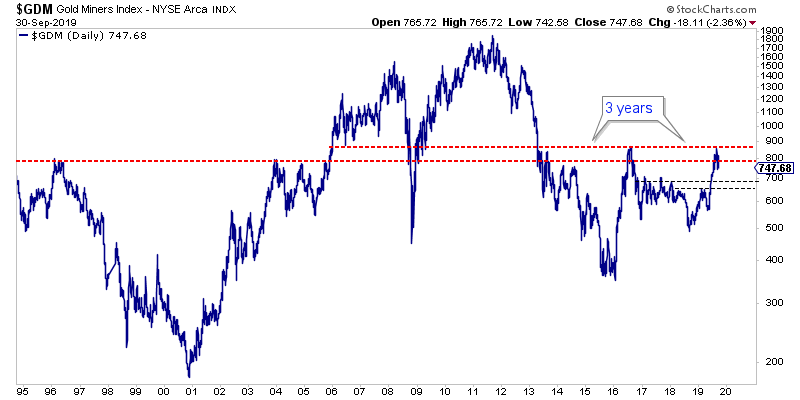
Circling back to GDX, it is critical to understand GDX long-term technical position. Below we plot the NYSE Gold Miners Index, which is the parent of GDX and has a history of 25 years.
The large-cap gold stocks (as evidenced by GDX) are correcting around resistance that dates back over 20 years.
After the 2013 crash and ensuing selloff, it took GDX three years to rally back to that level. Following that peak, it has taken another three years.
While it will not take another three years for the gold stocks to bust through that resistance, its unlikely to take only a few months. It could be anywhere from a few quarters to a year.
That will depend on the fundamental developments, which we have discussed in our past missives.
For now, look for more selling in the gold stocks but then a decent rebound into November that could eventually morph into a consolidation. What follows from there will depend on Fed policy and inflation.
In the meantime, better value and new opportunities will continue to emerge. Dont panic. Instead, use this time to tweak your portfolio and err on the side of buying quality at a discount.
The content on this site is protected
by U.S. and international copyright laws and is the property of GoldSeek.com
and/or the providers of the content under license. By "content" we mean any
information, mode of expression, or other materials and services found on GoldSeek.com.
This includes editorials, news, our writings, graphics, and any and all other
features found on the site. Please contact
us for any further information.
Live GoldSeek Visitor Map | Disclaimer
The views contained here may not represent the views of GoldSeek.com, Gold Seek LLC, its affiliates or advertisers. GoldSeek.com, Gold Seek LLC makes no representation, warranty or guarantee as to the accuracy
or completeness of the information (including news, editorials, prices, statistics,
analyses and the like) provided through its service. Any copying, reproduction
and/or redistribution of any of the documents, data, content or materials contained
on or within this website, without the express written consent of GoldSeek.com, Gold Seek LLC,
is strictly prohibited. In no event shall GoldSeek.com, Gold Seek LLC or its affiliates be
liable to any person for any decision made or action taken in reliance upon
the information provided herein.