-- Published: Monday, 6 January 2020 | Print | Disqus
"The best is yet to come."
- Frank Sinatra, American singer, actor, producer, 1915-1998
"You are never too old to reinvent yourself."
- Steve Harvey, American comedian, businessman, entertainer, b. 1957
"It is never too late to be what you might have been."
- George Eliot, (Mary Ann Evens), English novelist, poet, journalist, translator, a leading writer of the Victorian era, 1819-1880
2019 The Year in Review by David Chapman
| |
North American Stock Indices | Percentage Gain (Loss) |
S&P 500 | 28.9% |
Dow Jones Industrials (DJI) | 22.3% |
Dow Jones Transportations (DJT) | 18.9% |
NASDAQ | 35.2% |
S&P 600 | 20.9% |
S&P 400 | 24.1% |
Wilshire 5000 | 27.7% |
S&P TSX Composite | 19.1% |
TSX Venture Exchange (CDNX) | 3.7% |
International Stock Indices | |
Europe | |
London FTSE 100 | 12.1% |
Paris CAC 40 | 27.5% |
German DAX | 24.2% |
Italy FTSE/MIB | 28.2% |
EuroNext 100 | 24.8% |
Asia | |
China Shanghai Index (SSEC) | 23.7% |
Tokyo Nikkei Dow (TKN) | 17.8% |
Hong Kong Hang Seng | 12.2% |
India CNX Nifty Fifty | 12.0% |
Taiwan TWII | 23.3% |
South Korea Seoul Composite (KOSPI) | 7.7% |
Australia All Ordinaries | 19.1% |
| |
Source: www.stockcharts.com, www.tradingeconomics.com
2019 The Year in Review
| |
Latin America | Percentage Gain (Loss) |
Mexico Bolsa IPC | 4.6% |
Brazil Bovespa BVSP | 31.6% |
Argentina Merval Index (MERV) | 37.6% |
World Indices | |
MSCI World Index (ex USA) | 19.0% |
MSCI Emerging Markets (EEM) | 18.2% |
| |
Crypto | |
Bitcoin (BTC) | 92.5% |
Ethereum (ETH) | (14.9)% |
Ripple (XRP) | (45.7)% |
| |
Precious & Industrial Metals | |
Gold | 18.9% |
Silver | 15.3% |
Platinum | 22.9% |
Palladium | 59.5% |
Copper | 6.4% |
| |
Energy | |
WTI Oil | 30.5% |
Brent Crude | 20.6% |
Natural Gas | (27.3)% |
| |
Indices | |
Gold Bugs Index (HUI) | 50.7% |
TSX Gold Index (TGD) | 39.9% |
ARCA Oil Index (XOI) | 9.6% |
TSX Energy Index (TEN) | 5.9% |
Baltic Dry Index | (15.0)% |
CRB Index | 11.4% |
| |
Currencies | |
US$ Index DXY | 0.3% |
Canadian Dollar CAN$ | 4.9% |
Euro | (2.2)% |
Swiss Franc CHF | 1.5% |
Pound Sterling (UK) £ | 4.0% |
Japanese Yen ¥ | 0.9% |
Chinese Yuan ¥ | 1.2% |
Source: www.stockcharts.com, www.tradingeconomics.com
2019 The Year in Review
| |
Interest Rates (Yields) | Percentage Gain (Loss) (Does not include coupons) |
U.S. | |
Fed Funds | 31.7% |
2-year Treasury Note | 36.3% |
5-year Treasury Note | 32.7% |
10-year Treasury Note | 28.6% |
30-year Treasury Bond | 20.9% |
| |
Canada | |
Overnight Rate | 0.8% |
2-year Gov of Canada | 9.1% |
5-year Gov of Canada | 10.6% |
10-year Gov of Canada | 13.3% |
20-year Gov of Canada | 19.3% |
Source: www.stockcharts.com, www.tradingeconomics.com, www.bankofcanada.ca
(Rest of page deliberately blank)
Source: www.stockcharts.com
The New Year started off with a bang. One cannot ignore politics when it comes to markets. And some like the assassination of Irans most powerful general Qassem Soleimani touched off a market firestorm. At one-point WTI oil was up almost 5%. It settled up 3.1%. Gold leaped settling up $24 for the near futures contract. That the U.S. dollar leaped was probably not a surprise. But it didnt last long and the US$ Index closed unchanged and flat on the week. Bonds rallied as the U.S. 10-year Treasury note fell 8 bp to 1.80%. Canadas 10-year Government of Canada bond (CGBs) also fell 5 bp on the week and also 8 bp overnight closing at 1.54%. Finally, the stock markets as the Dow Jones Industrials (DJI) dropped 234 points or 0.8%. The DJI along with the S&P 500 and the NASDAQ had closed the prior day at all-time record highs.
No doubt it could have been worse. But then what this has sparked is a leap into the unknown. No one knows what is going to happen next. Maybe everything and maybe nothing. Although the latter is unlikely given Irans statement vowing harsh revenge. Trouble is we dont know when, how or against what. And that brings us market uncertainty. It has raised security concerns all around the world.
Political risk is nothing new. From Brexit to the election of Trump to the trade wars with China, the EU and others, the protests in Hong Kong, Chile and many more. The first year of the new decade promises to be one filled with political risk particularly leading up to the U.S. election in November. Markets may embark on a roller coaster ride if the start to the New Year is an example. Yes, it could have been worse but the possible muted reaction may just be a cautious one to the events and further assessment is required of the risks involved.
. there are known knowns; there are things we know we know. We also know there are known unknowns; that is to say we know there are some things we do not know. But there are also unknown unknownsthe ones we don't know we don't know. And if one looks throughout the history of our country and other free countries, it is the latter category that tend to be the difficult ones.
- Donald Rumsfeld, American politician, Secretary of Defense 1975-1977, 2001-2006, U.S. congressman 1963-1969, Director of the Office of Economic Opportunity 1969-1970, counsellor to the President 1969-1973, U.S. permanent representative to NATO 1973-1974, White House Chief of Staff 1974-1975, American businessman b. 1932
We are reminded of Donald Rumsfelds famous saying. The assassination of Soleimani is a classic example. Will the markets shrug it off figuring nothing will come of it? Or will the markets take a turn for the worse realizing that this is a serious threat? The problem is we dont know and that makes the markets a potentially risky endeavour going forward. Global shipping is already in a decline. It could get even worse. A third of the worlds liquified natural gas and a quarter of the worlds oil goes through the Straits of Hormuz. The straits are only 39 km wide bordering Iran on one side and Qatar and the U.A.E. on the other. Attacks have previously taken place against tankers. 64.5% of the worlds proven oil reserves lie in the vicinity of the Middle East. A reminder that sharply rising oil prices have preceded every recession since the 1970s.
The ISM purchasing managers Index peaked back in August 2018. It has been falling ever since. For the past five months it has recorded steady readings under 50 indicating that the U.S. manufacturing sector is already in a recession. In December 2019 the ISM PMI came in at 47.2 the lowest since June 2009.
U.S. ISM Purchasing Managers Index (PMI)
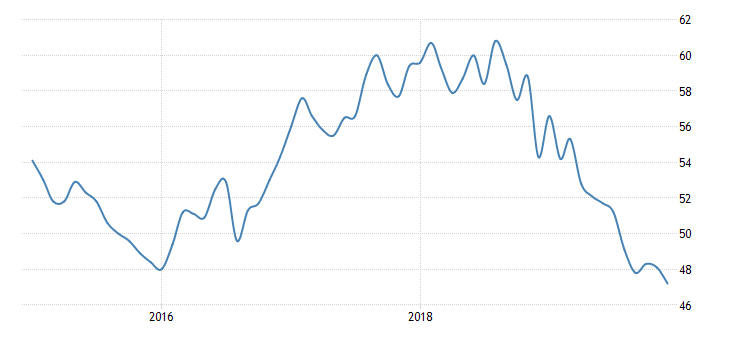
Source: www.tradingeconomics.com
This coming week well get our first sense of the U.S. economy going into 2020 with the release Friday of nonfarm payroll and unemployment for December 2019. The market consensus is a gain of 160,000 vs. Novembers surprise gain of 266,000. The unemployment rate (U3) is expected to remain at 3.5%.
The decade may also see the bills come due as a result of climate devastation. The world is watching Australia burn. Fires have already consumed an area the size of Massachusetts and the summer is just beginning. The death toll and economic devastation is just starting to be realized. And the smoke has cast a pall over the continent and beyond even covering the glaciers of New Zealand that would hasten melting. In Indonesia rains have flooded cities including one of the worlds largest Jakarta along with others. The death toll is mounting. One cannot live in such conditions. The region holds millions. The real costs of fighting climate devastation are just getting underway and it will be in the trillions. The question is what, who and where will it hit next. No area of the world is immune.
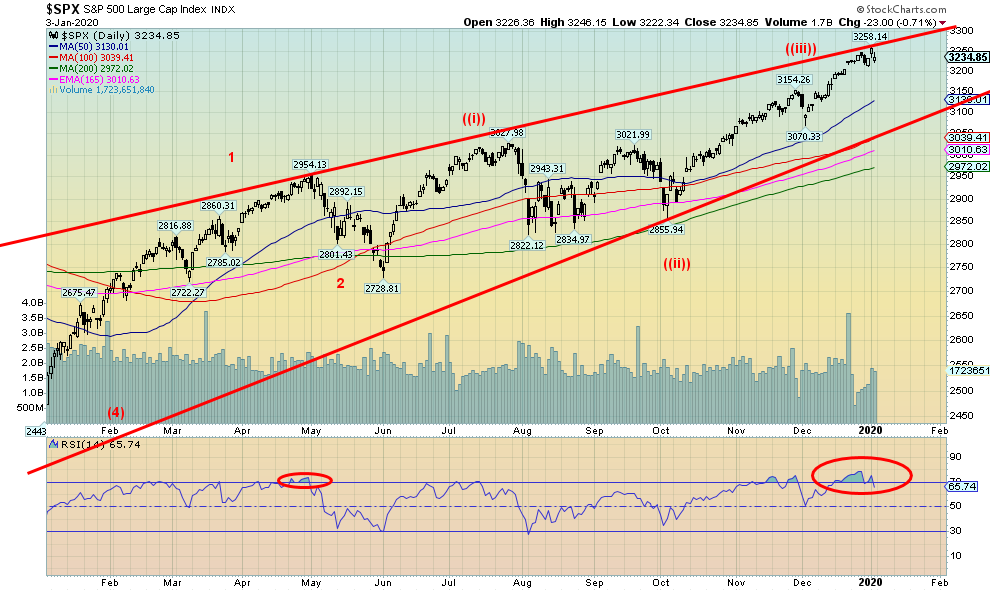
With those cheery thoughts behind us we couldnt help but notice that the spike to new all-time highs on the S&P 500 came right at the top of the channel on January 2, 2020. In looking back, it reminded us of the final high of the Tokyo Nikkei Dow (TKN) that came you guessed it on January 2, 1990. Its never been close since a period of 30 years. On January 3, 2020 the S&P 500 opened below the low of January 2, 2020. We sense that the markets are about to leave a little island above behind. The first good sign of a breakdown would be break under 3,200. Bigger fireworks and downside erupt under 3,100 and 2,950. Note how the RSI held over 70 throughout the latter part of December. We also note that CBOE put/call ratio was at a level favouring calls over puts rarely seen over the past 20 years. Those levels were always seen at significant market tops.
For the past twenty years seasonality patterns have shown that January is not a very good month for markets. Seasonals show that rallies get underway in October and tend to peak the first week of January before bottoming late in the month and another rally gets underway. The unanswered question of course is this a temporary top or is this something bigger. If the S&P 500 were to breakdown under 2,950 it might be moving into something bigger. Confirmation would come under 2,850 and especially under 2,700.
Source: www.mcoscillator.com
The bulls will argue that there is probably nothing to be worried about. This will just be temporary. The NYSE advance-decline line was still making record highs suggesting that the bull is alive and well. The McClellan Summation Index (RASI) is back over 500 although it has made a lower high. A number of markets only recently broke out and despite some areas of slowing (i.e. manufacturing) the U.S. economy continues to chug along. But the warning signs are there and the unknowns that could set the market just grew.
And then there is the repo crisis. We still dont know what is going on. What we do know is that interest rates were starting to creep higher and the Fed wanted to keep them under control. As well the Tweeter in Chief continued to hammer the Fed crying out for lower even negative interest rates. If negative interest rates were such a panacea then the EU and Japan should be jumping for joy. Except people are becoming increasingly reluctant to hold all those negative interest bonds. The negative interest rates are undermining the euro as a reserve currency. There is also the potential of liquidity crisis somewhere and our suspicion falls heavily on the EU banking system. The repo program is not as many claim QE4.
We are moving into a period of unknowns and it is going to come back and haunt global stock markets.
Source: www.stockcharts.com
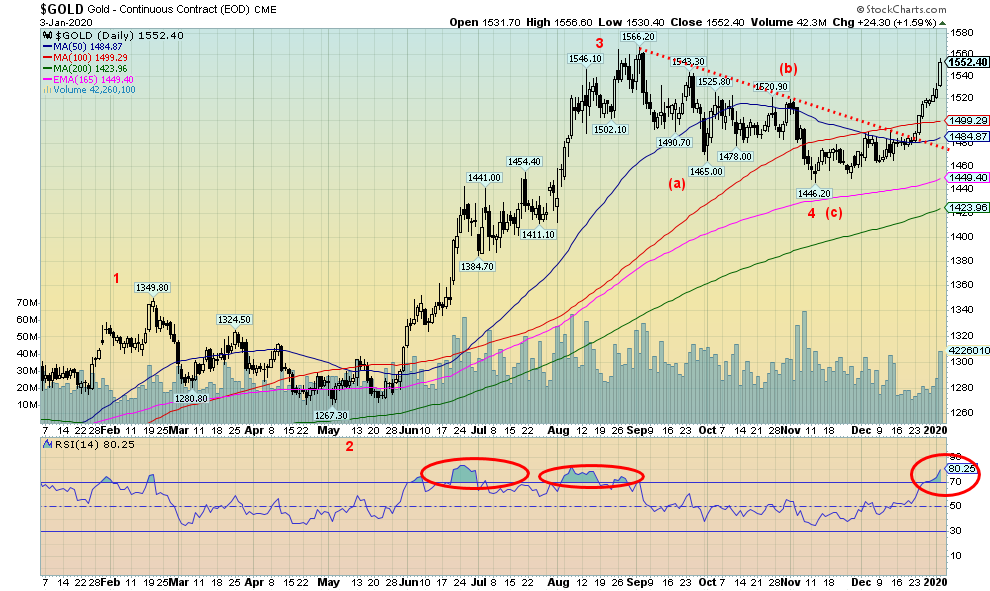
Gold was a significant beneficiary of the hit on January 3, 2020 soaring $24 on the day for the near futures contract. Gold was a beneficiary of a rush to safe havens that also included bonds. In closing over $1,550 we have taken out the next resistance line. Follow through this coming week will be key as we need to see it gold continue to hold $1,550 with key support now at $1,520/$1,525. The next move needs to take out the September high of $1,566. A move and confirmed closes above that level could target us eventually to new all-time highs above $1,920 the September 2011 high. Our initial target is $1,605 and beyond that $1,725.
Short-term there are a few negative signs. Silver did not perform as well as gold this past week. Silver hit a high of $18.33 on Friday before settling back closing at $18.15 up a rather muted 10 cents on the day. We need to see silver take out and close over $18.35 to convince us that we are firmly moving higher with initial targets up to $20.50. The gold stocks acted as if they dont believe this. For the past two days both the Gold Bugs Index (HUI) and the TSX Gold Index (TGD) put on early gains and were positive on the day only to see the gains erode and, on both days, closed lower. The HUI has been making new 52-week highs, however, the TGD has not yet made new 52-week highs. Still both indices look positive despite the weakness seen over the past couple of days.
As well the commercial COT has been weakening further. This past weeks report wont be out until Monday but the previous report showed that the commercial COT for gold slipped to 27% from 28% as some 21,000 contracts were added to shorts. The silver commercial COT also slid to 31% from 33% as short open interest rose by roughly 16,000 contracts. In both instances the large speculators COT became more bullish. Should we be concerned? Well, yes and no. It was telling that through the long run for gold 2009-2011 the commercial COT became increasingly short even as gold kept rising. If there is anything different this time is that the commercial has never been as short as we are currently seeing. It is a cautionary note. As well we note that golds RSI has moved firmly above 70 although caution that the RSI can remain overbought for sometime as gold moves higher and before it turns down.
Gold should continue to act as a safe haven given the unknowns that exist. We are referring here to physical gold not gold stocks or gold derivatives including ETFs. In a market meltdown the gold stocks may well follow even as gold itself holds up. Our key support zone for gold is $1,510 to $1,525. As long as we hold above that zone gold should move higher. Seasonals are favourable with tops occurring anywhere from late January to early March before a corrective period invariably steps in. Gold is a safe haven in times of economic, geopolitical and political uncertainty. We note the U.S. dollar is beginning to weaken as the US$ Index broke under a key support zone at 96.50 and continues to stay at or under that zone. Next key support for the US$ Index is at 95.50. The US$ Index is in a downtrend as long as it remains under 97.50.
(Markets & Trends on the next page)
Copyright David Chapman, 2019
About MARKETS AND TRENDS
| | | % Gains (Losses) Trends |
| Close Dec 31/19 | Close Jan 3/20 | Week | YTD | Daily (Short Term) | Weekly (Intermediate) | Monthly (Long Term) | |
Stock Market Indices | | | | | | | | |
S&P 500 | 3,230.78 | 3,234.85 (new highs) | (0.2)% | 0.1% | up | up | up (topping) | |
Dow Jones Industrials | 28,645.26 | 28,634.88 (new highs) | flat | 0.3% | up | up | up (topping) | |
Dow Jones Transports | 10,936.70 | 10,911.40 | (0.2)% | 0.1% | up | up | up (weak, topping) | |
NASDAQ | 9,006.62 | 9,020.77 (new highs) | 0.2% | 0.5% | up | up | up (topping) | |
S&P/TSX Composite | 17,063.53 | 17,066.12 | (0.6)% | flat | up | up | up (topping) | |
S&P/TSX Venture (CDNX) | 577.54 | 587.44 | 4.2% | 1.7% | up | neutral | down | |
S&P 600 | 1,021.18 | 1,020.93 (new highs) | 0.2% | flat | up | up | up (topping) | |
MSCI World Index | 2,033.60 | 2,040.33 (new highs) | flat | 0.3% | up | up | up | |
NYSE Bitcoin Index | 7,255.46 | 7,253.68 | 1.0% | flat | down | down (weak) | up (weak) | |
| | | | | | | | |
Gold Mining Stock Indices | | | | | | | | |
Gold Bugs Index (HUI) | 241.94 | 238.26 | 0.3% | (1.5)% | up | up | up | |
TSX Gold Index (TGD) | 261.30 | 259.25 | flat | (0.8)% | up | up | up | |
| | | | | | | | |
Fixed Income Yields/Spreads | | | | | | | | |
U.S. 10-Year Treasury yield | 1.92 | 1.80 | (6.3)% | (4.3)% | | | | |
Cdn. 10-Year Bond yield | 1.70 | 1.54 | (3.8)% | (9.4)% | | | | |
Recession Watch Spreads | | | | | | | | |
U.S. 2-year 10-year Treasury spread | 0.34 | 0.27(20.6)% | (6.9)% | 38.1% | | | | |
Cdn 2-year 10-year CGB spread | 0 | -0.07 | flat | (70.0)% | | | | |
| | | | | | | | |
Currencies | | | | | | | | |
US$ Index | 96.06 | 96.52 | flat | 0.5% | down | down | neutral | |
Canadian $ | 0.7710 | 0.7700 | 0.5% | flat | up | up | neutral | |
Euro | 112.12 | 111.59 | (0.1)% | (0.5)% | up | neutral | down (weak) | |
Swiss Franc | 103.44 | 102.83 | 0.3% | (0.6)% | up | up | neutral | |
British Pound | 132.59 | 130.82 | flat | (1.2)% | up | up | up (weak) | |
Japanese Yen | 92.02 | 92.52 | 1.3% | 0.5% | up | neutral | up | |
| | | | | | | | |
Precious Metals | | | | | | | | |
Gold | 1,523.10 | 1,552.40 | 2.3% | 1.9% | up | up | up | |
Silver | 17.92 | 18.15 | 1.2% | 1.3% | up | up | up | |
Platinum | 977.80 | 990.30 | 3.5% | 1.3% | up | up | up | |
| | | | | | | | |
Base Metals | | | | | | | | |
Palladium | 1,909.30 | 1,955.70 | 4.0% | 2.4% | up | up | up | |
Copper | 2.797 | 2.787 | (1.5)% | (0.4)% | up | up | neutral | |
| | | | | | | | |
Energy | | | | | | | | |
WTI Oil | 61.06 | 63.05 | 2.2% | 3.3% | up | up | up | |
Natural Gas | 2.19 | 2.13 | (4.5)% | (2.7)% | down | down | down | |
Source: www.stockcharts.com, David Chapman
Note: For an explanation of the trends, see the glossary at the end of this article.
New highs/lows refer to new 52-week highs/lows.
TECHNICAL SCOOP Charts and commentary by David Chapman Chief Strategist, Enriched Investing Inc. Phone: 416-523-5454 Email: david@davidchapman.com dchapman@enrichedinvesting.com Twitter: @Davcha12 January 6, 2020 |
"The best is yet to come."
GLOSSARY
Trends
Daily Short-term trend (For swing traders)
Weekly Intermediate-term trend (For long-term trend followers)
Monthly Long-term secular trend (For long-term trend followers)
Up The trend is up.
Down The trend is down
Neutral Indicators are mostly neutral. A trend change might be in the offing.
Weak The trend is still up or down but it is weakening. It is also a sign that the trend might change.
Topping Indicators are suggesting that while the trend remains up there are considerable signs that suggest that the market is topping.
Bottoming Indicators are suggesting that while the trend is down there are considerable signs that suggest that the market is bottoming.
Disclaimer
David Chapman is not a registered advisory service and is not an exempt market dealer (EMD) nor a licensed financial advisor. We do not and cannot give individualised market advice. David Chapman has worked in the financial industry for over 40 years including large financial corporations, banks, and investment dealers. The information in this newsletter is intended only for informational and educational purposes. It should not be considered a solicitation of an offer or sale of any security. The reader assumes all risk when trading in securities and David Chapman advises consulting a licensed professional financial advisor before proceeding with any trade or idea presented in this newsletter. David Chapman may own shares in companies mentioned in this newsletter. We share our ideas and opinions for informational and educational purposes only and expect the reader to perform due diligence before considering a position in any security. That includes consulting with your own licensed professional financial advisor.


