-- Published: Monday, 3 February 2020 | Print | Disqus
When I have to depend upon hope in a trade, I get out of it.
Jesse Livermore, American stock trader, speculator, How to Trade in Stocks; 18771940
The most important lesson from investing is humility.
Sir John Templeton, American born British investor, banker, fund manager, philanthropist; 19122008
Any fool can buy. It is the wise man who knows how to sell.
Albert W. Thomas, trader, investor, Over My Shoulder, mutualfundmagic.com, If it Doesnt Go Up. Dont Buy It! b. 1927
- David Chapman
The coronavirus continues to cause quite a stir. It appears to be spreading rapidly in China. The count is also starting to pick up outside of China. Over 14,000 cases have been confirmed in China and over 300 have died as of time of writing. Outside of China there now well over 100 cases and one person has died. The problem is no one is able to predict as to when this will peak or how fast it will grow. Apparently, China has another 15,000 suspected cases but there are some reports it could be as high as 75,000. Some countries such as Canada, the U.S., and some EU countries are well prepared for this. Many others, including China, are only somewhat prepared while for many others, particularly in Africa, they are ill prepared. There are no reports of cases in Africa. Thus far, coronavirus has hit 26 countries outside of China (including Hong Kong, Macao and Taiwan countries that are not members of WHO as they are considered part of China). That could rise as could the number of cases.
The World Health Organization (WHO) has declared this a pandemic and a global health emergency. Oddly, it has recommended against travel restrictions, even as the U.S. has now posted a travel advisory to China. Warnings such as that can have a cooling effect on travel and insurance rates for shippers, and, coupled with reduced consumer demand, can have the same effect as outright cancellations.
We should keep this current crisis in perspective. The more recent SARS epidemic only saw about 8,100 cases worldwide. Of these, 774 died or roughly 9.6%. By comparison, the coronavirus currently has a death rate of just over 2%. There were three pandemics during the 20th century. The Spanish Influenza of 19181919 was estimated to have infected upwards of 500 million and killed an estimated 2050 million. The Asian flu of 1957 caused an estimated one to two million deaths worldwide. The Hong Kong flu pandemic of 1968 caused an estimated one to four million deaths worldwide. A major recession/depression followed the Spanish influenza while recessions followed the Asian and Hong Kong flu. More recent epidemics such as SARS did not have the same economic impact.
HIV/AIDS, that got underway in 1980, has infected 60100 million people worldwide and killed an estimated 2448 million. Finally, the common flu or common influenza is estimated to hit 945 million people annually with between 140800 thousand hospitalized and between 1261 thousand deaths every year. It was estimated that, in 2019, up to 42.9 million people got the flu, 647 thousand were hospitalized, and 61 thousand died or roughly 0.14%. And, according to new numbers, influenza has infected some 15 million Americans in the 201920 flu season, resulting in 140 thousand hospitalized and 8,200 deaths. Perspective is everything.
There are economic consequences. The travel, retail, and entertainment sectors have been hit hard in China. Companies like Starbucks have closed upwards of 2,000 outlets, all in China. McDonalds closed several hundred. Foreign companies operating in China have been negatively impacted, having to, at least temporarily, shut down operations. Cinemas, resorts, and Disneyland China have been temporarily closed. Some 60 million people are effectively under lockdown which causes innumerable problems for the people and a sharp contraction in economic activity. The celebrations of the Chinese Lunar New Year have been severely disrupted. The city of Wuhan where all this started is considered one of the most important economic hubs in China. Wuhan is sometimes referred to as the Chicago of China. Over 300 Fortune 500 companies have operations in Wuhan. The city receives over 300 million tourists annually.
It was estimated that the SARS epidemic cost China about 2% points of growth. Globally, the cost was estimated at around $40 billion, pretty small in an $85 trillion global economy. The coronavirus could cause the same contraction. Many are predicting the economic cost will be far higher. Some estimates suggest that China will suffer a $60 billion contraction in Q1. The economic consequences spill over into the rest of the world, given Chinas economic position globally and the fact that the world is interlocked economically. Given the huge amount of trade (exports and imports) involving China, this alone could have a negative economic impact on the entire world.
China may have difficulty in meeting targets outlined in the Phase 1 deal with the U.S. China is committed to purchasing an increase of 88.3% of imports of U.S. manufactured goods in 2021 vs. 2017. A big chunk of those shipments was destined for Hubei province where Wuhan, a major manufacturing hub, is located. As well, China had committed to $200 billion of agricultural products. That might now become a problem too. The trade deal could be collateral damage. Interesting that the trade deal was more about managed trade than it was about free trade. We can see the so-called Phase 1 deal coming apart. The U.S. has not removed tariffs on billions of dollars f goods.
The crisis has reverberated elsewhere as well. Air Canada, British Airways, Lufthansa, Iberia Airlines, American Airlines, and Delta are amongst the airlines that have suspended flights to the mainland due to a drop in demand. More airlines may quickly follow. Italy has suspended flights with Taiwan because WHO considers Taiwan a part of China.
For the airlines, thats quite a cost as Air Canada runs 33 flights a week to China out of Montreal, Toronto, and Vancouver. How long this continues is anybodys guess. If coronavirus accelerates to other countries, more flights could be cancelled. Given the huge growth of Chinese incomes, Chinese tourism has boomed abroad. It is estimated that Chinese tourism abroad has grown from 20 million in 2003 to 150 million in 2018. That alone is going to have a huge negative impact on tourism globally, particularly in North America and the EU.
Fallout is expected to hit other Asian countries, particularly Singapore, Thailand, Japan, and possibly even South Korea as they too receive Chinese tourists and do a large volume of business with China. Outbound tour groups have been banned. Metal prices plunged, with copper down 12.5% since January 16. WTI oil plunged down 10.7% in the past week. The bloom even came off of palladium, a metal in short supply thats key in the automobile industry. China has a large automobile industry. The stock market, after trying to rebound on Tuesday, has turned downward once again. Gold, along with bonds, are acting as a safe haven. The U.S. dollar is also rising as it too becomes the defacto currency of choice along with gold.
All of this, combined with other ongoing world crises, feels like the Four Horsemen of the Apocalypse are hard at work. Disease (coronavirus), pestilence (locust invasion in Kenya), war (the forever war in the Mid-East), and famine (sub-Saharan Africa, Zimbabwe, Yemen, Mozambique (cyclone), Democratic Republic of the Congo, Afghanistan, Ethiopia, and in the Americas Haiti much of triggered by climate change).
It was probably no surprise that in the midst of the crisis the FOMC announced that they will remain on hold with interest rates for the foreseeable future. Furthermore, the impetus for the Fed to make any interest rate moves will be reduced as we get deeper into this election year. The Fed announcement didnt make any mention of coronavirus. Clearly, the Fed isnt too concerned. Although, at the news conference that followed, Fed Chair Jerome Powell noted that the Fed was monitoring the coronavirus. Well, we are all doing likewise.
Lost in all the furor over coronavirus is the repo crisis, the now $12 trillion in negative yield bonds that is effectively crushing European pension funds, the $9$14 trillion of U.S. dollar denominated debt in emerging markets, and the $15.5 trillion of U.S. corporate debt, much of it either below investment grade or BBB-rated, the lowest investment grade ranking. Both Italy and France saw their economies contract in Q4. Germanys economy is barely growing. There is also the impeachment trial where acquittal is all but ensured. Some are calling the trial a descent into constitutional madness, given the defense used that Trump cant be impeached for an action he thought might get him re-elected. Oh yes, and Brexit is officially underway. Focus on Iran/Iraq seems to have fallen off.
The stock market rebounded on Tuesday this past week because of robust earnings and somewhat stronger economic numbers. Gold took a hit. But the bloom didnt last long as more news came out of China. By the end of the week stock markets were falling again and gold was rebounding.
Source: www.stockcharts.com
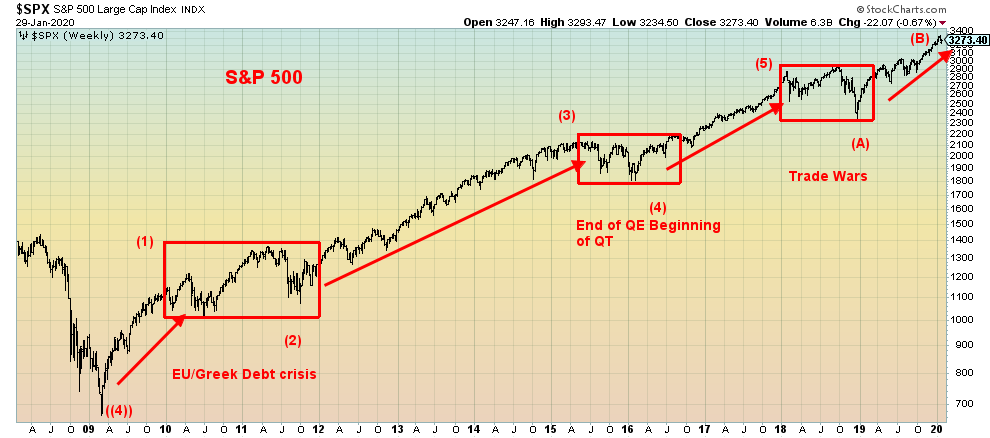
Our long-dated chart of the S&P 500 shows that, following the major low in March 2009, the market embarked on a multi-year uptrend. We have labeled this so that the final top of a 5-wave advance came in January 2018 as the trade wars got underway. We are now calling that the nominal high. Since then, we have embarked on the first two waves of what could be a huge ABC-type pattern, or even an ABCDE-type pattern that will play itself out over the next few years. If this is correct, this may turn out to be the top of the B wave that actually took out the top of wave 5.
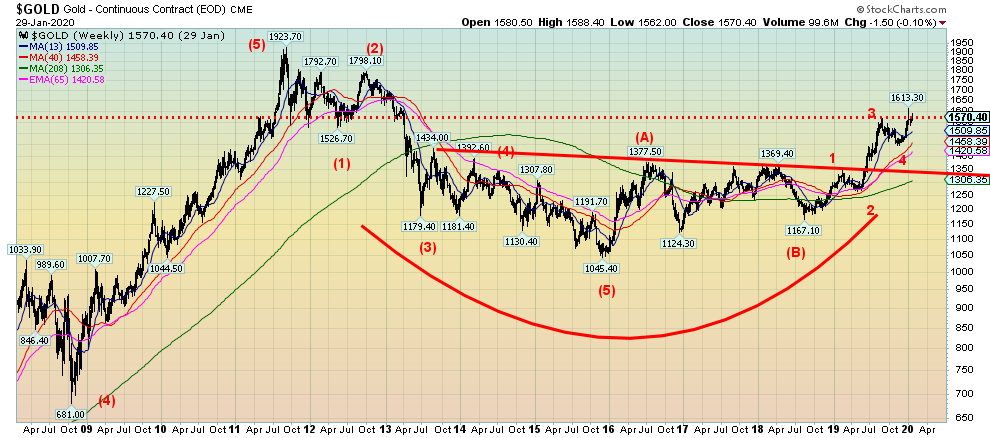
The second long-dated chart is gold covering the same period. Gold completed a major five wave advance from the lows of 1999/2001, culminating in the major top seen in September 2011. Since then, gold has embarked on what may turn out to be a huge ABC pattern to the upside. The A wave completed in 2016 was followed by a B wave that bottomed in 2018. We are now embarking on the C wave that could actually take us new all-time highs. Our minimum objectives for this wave are around $1,725.
Source: www.stockcharts.com
With numerous signs pointing to a slowing global economy, the coronavirus scare could help push the world into a recession. The outbreak of coronavirus was the spark that has sent the stock market tumbling, but a reminder that the all-time highs were accompanied by record bullish sentiment and clear signs of overvaluation. The unanswered question going forward is, this the start of a more significant decline or will the coronavirus scare peter out and the market continue its record climb? Or will the Feds operations in the repo market save the day?
MARKETS AND TRENDS
| | | % Gains (Losses) Trends |
| Close Dec 31/19 | Close Jan 31/20 | Week | YTD | Daily (Short Term) | Weekly (Intermediate) | Monthly (Long Term) | |
Stock Market Indices | | | | | | | | |
S&P 500 | 3,230.78 | 3,225.52 | (2.1)% | (0.2)% | neutral | up | up (topping) | |
Dow Jones Industrials | 28,645.26 | 28,256.03 | (2.5)% | (1.0)% | down (weak) | up | up (topping) | |
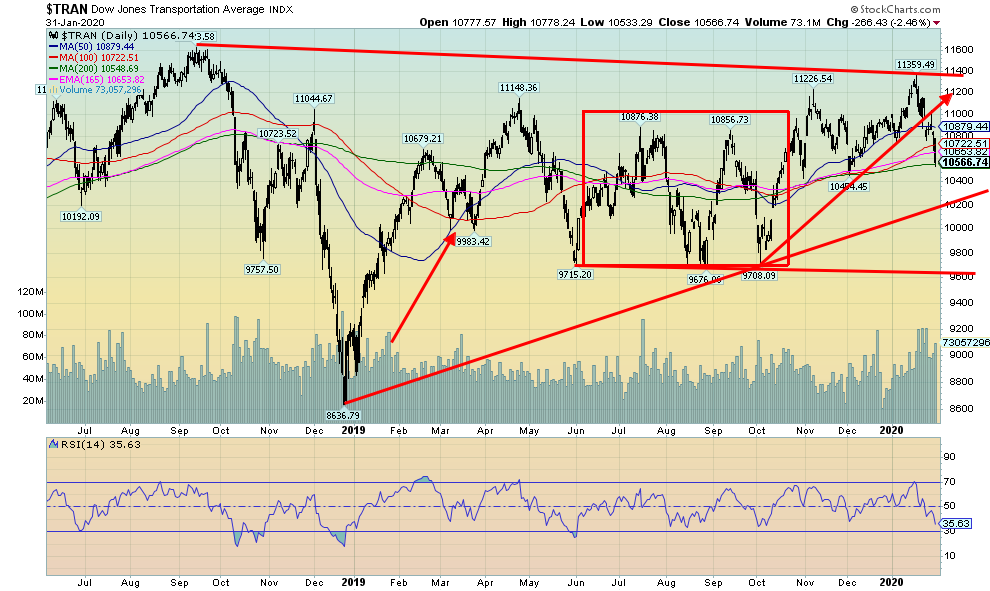
Dow Jones Transports | 10,936.70 | 10,566.74 | (4.5)% | (3.1)% | down | up (weak) | up (weak, topping) | |
NASDAQ | 9,006.62 | 9,150.94 | (1.8)% | 2.0% | up | up | up (topping) | |
S&P/TSX Composite | 17,063.53 | 17,318.49 | (1.4)% | 1.5% | up (weak) | up | up (topping) | |
S&P/TSX Venture (CDNX) | 577.54 | 575.18 | (1.1)% | (0.4)% | up (weak) | neutral | down | |
S&P 600 | 1,021.18 | 979.84 | (3.6)% | (4.1)% | down | up | up (topping) | |
MSCI World Index | 2,033.60 | 1,994.99 | (2.5)% | (1.9)% | down | up | up | |
NYSE Bitcoin Index | 7,255.46 | 9,294.14 | 11.4% | 28.1% | up | up | up | |
| | | | | | | | |
Gold Mining Stock Indices | | | | | | | | |
Gold Bugs Index (HUI) | 241.94 | 236.61 | 3.4% | (2.2)% | up | up | up | |
TSX Gold Index (TGD) | 261.30 | 264.60 | 3.5% | 1.3% | up | up | up | |
| | | | | | | | |
Fixed Income Yields/Spreads | | | | | | | | |
U.S. 10-Year Treasury yield | 1.92 | 1.51 | (11.2)% | (21.4)% | | | | |
Cdn. 10-Year Bond yield | 1.70 | 1.28 | (9.9)% | (24.7)% | | | | |
Recession Watch Spreads | | | | | | | | |
U.S. 2-year 10-year Treasury spread | 0.34 | 0.18 | (14.3)% | (47.1)% | | | | |
Cdn 2-year 10-year CGB spread | 0 | -0.15 | (50.0)% | (150.0)% | | | | |
| | | | | | | | |
Currencies | | | | | | | | |
US$ Index | 96.06 | 97.21 | (0.5)% | 1.2% | up | neutral | up (weak) | |
Canadian $ | 0.7710 | 0.7558 | (0.7)% | (1.9)% | down | neutral | neutral | |
Euro | 112.12 | 110.93 | 0.6% | (1.1)% | down | down | down | |
Swiss Franc | 103.44 | 103.82 | 0.8% | 0.4% | up | up | up | |
British Pound | 132.59 | 132.02 | 1.0% | (0.3)% | up | up | neutral | |
Japanese Yen | 92.02 | 92.29 | 0.8% | 0.3% | up | neutral | up | |
| | | | | | | | |
Precious Metals | | | | | | | | |
Gold | 1,523.10 | 1,587.90 | 1.0% | 4.3% | up | up | up | |
Silver | 17.92 | 17.99 | (0.7)% | 0.4% | up | up | up | |
Platinum | 977.80 | 961.90 | (4.8)% | (1.6)% | neutral | up | up | |
| | | | | | | | |
Base Metals | | | | | | | | |
Palladium | 1,909.30 | 2,224.70 | (4.0)% | 16.5% | up | up | up | |
Copper | 2.797 | 2.517 | (6.2)% | (10.0)% | down | down | down | |
| | | | | | | | |
Energy | | | | | | | | |
WTI Oil | 61.06 | 51.565 | (4.9)% | (15.6)% | down | down | neutral | |
Natural Gas | 2.19 | 1.83 (new lows) | (3.7)% | (16.4)% | down | down | down | |
Source: www.stockcharts.com, David Chapman
Note: For an explanation of the trends, see the glossary at the end of this article.
New highs/lows refer to new 52-week highs/lows.
Source: www.stockcharts.com
It was the week of the coronavirus and stock markets globally took a plunge. At best, we can describe this past week as tumultuous. Besides the outbreak of coronavirus, we had central bank meetings and a raft of economic numbers. Some have estimated that Q1 GDP will be cut by 0.4% because of the drop in Chinese tourists. Yes, they are that significant. As well, as we noted, there is an expectation that exports to China will slow as well. The S&P 500 wiped out its gains for the year this past week, falling 2.1%. The Dow Jones Industrials (DJI) was down even more, losing 2.5%. The Dow Jones Transportations (DJT) took the biggest hit, off 4.5% while the NASDAQ dropped 1.8% and is still up on the year. The small cap S&P 600 lost 3.6% and is now down 4.1% on the year.
Markets elsewhere fell too. The TSX Composite lost 1.4% but remains up on the year. The TSX Venture Exchange (CDNX) also fell, losing 1.1%. The Global MSCI World Index dropped 2.5% while in the EU the London FTSE lost 4.3% in its last week before Brexit. The Paris CAC 40 dropped 2.5% while the German DAX was down 3.1%. China was closed for the Lunar New Year, so it was spared the carnage. But Chinas markets re-open on Monday and the expectation is that it could just gap down. The Tokyo Nikkei Dow (TKN) dropped 2.5% on the week. The Hong Kong Hang Seng lost 5.9% on the week while Singapore dropped 2.7%. Taiwan fell 4.9%.
So, what next? Given a continued rise in the number of coronavirus cases, the stock markets could well just gap down on Monday. Things didnt go well on Friday. The January Chicago PMI, a measurement of manufacturing, came in unexpectedly low at 42.9. The market had expected 48.8. Anything below 50 is recession territory. But Consumer Confidence for January was 90.5 which was above expectations. But maybe that number didnt fully reflect coronavirus. If the number of cases grows in the U.S., then the confidence number could plunge in February. Right now, in the U.S., the number of cases stands at 8 and no one has died. That is pretty low.
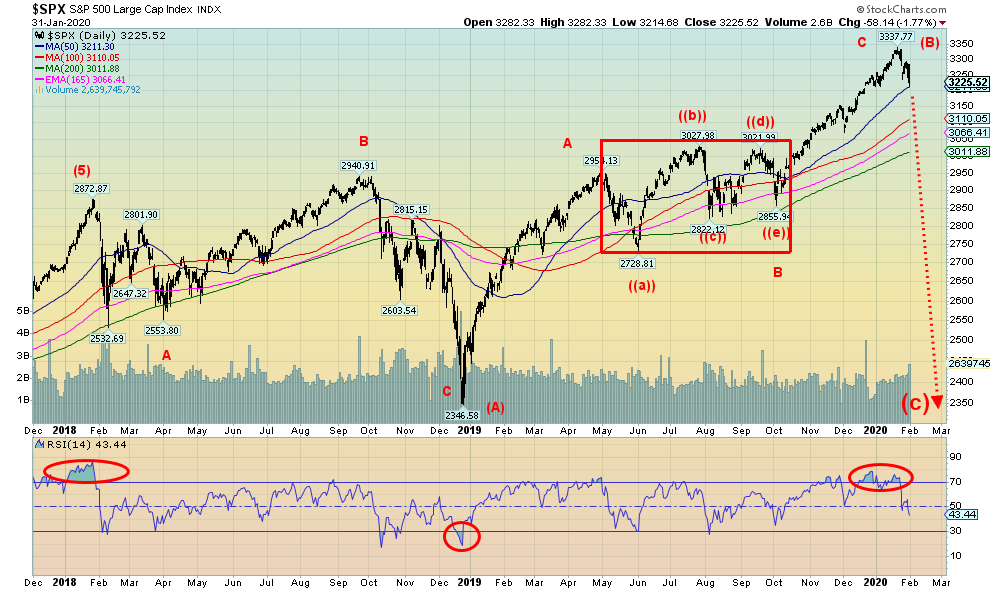
The coronavirus represents the unknown and markets hate unknownsso, it is risk off. For the markets, January was the worst month since August. We are now perilously close to our first support zone at 3,200. A break below that level would send the S&P 500 to the next level, near 3,100. The 200-day MA is near 3,000 and any good break under that level could start a bear market. We have re-labeled our thoughts on the wave count. We believe that the market actually made its nominal high in January 2018. Since then, we have embarked on a huge corrective wave.
The first major wave down bottomed in December 2018 (A). If that is correct, then this is the (B) wave up. It appears to us that it may have unfolded in an ABC fashion with the correction through the spring/summer unfolding in a 5-wave pattern abcde. This up-wave could also be a classic sucker rally, taking us to new all-time highs and fueled by what many like to call QE4 (the repo program). We dont believe the repo program was meant as QE but it has the same effect. We believe it is responding to the spike in interest rates seen in September 2019 and liquidity problems in the banking system, particularly unease over EU banks and possibly even Japanese banks. Chinese banks could be another problem and, as we all know, the global banking system is interlocked. If a big one went down (for example, Deutsche Bank), then it would impact the entire global financial system.
We dont know how this coronavirus is going to play out. So, the markets take the safest course of actionsell and move to safe havens; i.e., bonds and gold. If so, we should see further selling this coming week. February is classically the weakest link in the so-called best six months, ranking 8th out of the 12 months. So how did the January barometer do? Well, the DJI lost 1.0%, the DJT was down 3.1%, and the S&P 500 dropped a small 0.2%. The NYSE was down 2.2%. Based on those results, the January barometer is predicting that 2020 will not be a good year. Were there winners? The NASDAQ was up 2.0% and the TSX Composite gained 1.5%. For the record the January barometer has a 76% accuracy since 1950 when January finished down. There were 8 election years that saw a down January. The record there was not so good as only 3 of the 8 ended the year in negative territory with 2008 being the worst. So, all is not lost.
Source: www.stockcharts.com
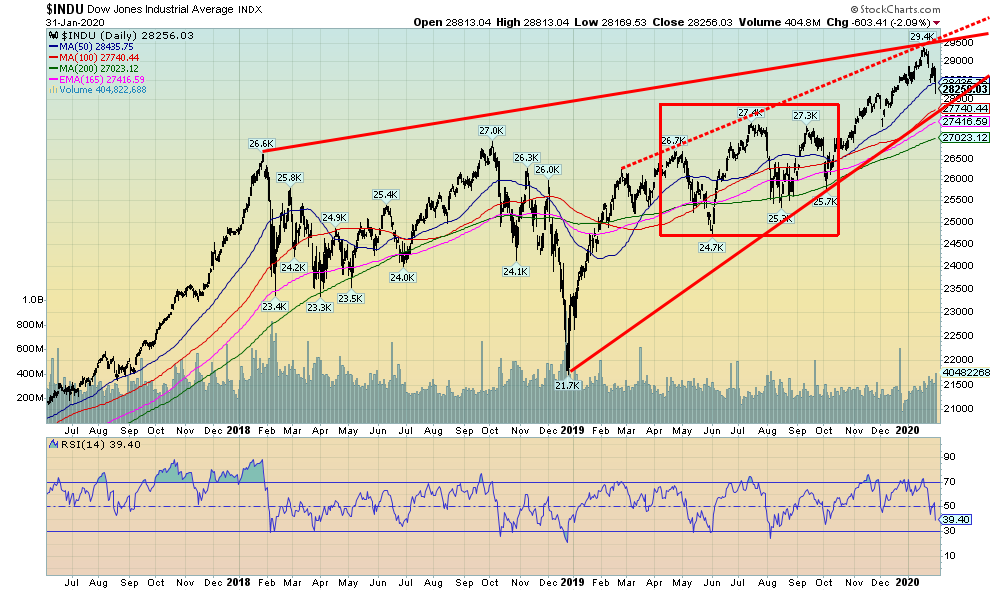
The Dow Jones Industrials (DJI) was hit harder than the S&P 500. Thats odd, considering the DJI holds the bluest of the blue-chip stocks. But then a week ago the S&P 500 made new all-time highs while the DJI did not: a divergence. The DJI is now down 1% on the year, having wiped out earlier gains. Unlike the S&P 500, the DJI also dropped and closed under the 50-day MA. The rising trendline from the December 2018 low could be the next target. Its currently near 27,750. A bear market would potentially get underway below 27,000. We could argue that the DJI has formed a huge ascending wedge triangle. But it is only formed from recent action. Nonetheless, if it is correct, then a return to the December 2018 low near 21,700 cannot be ruled out. The only thing that can save the market right now is new highs and, under the circumstances, that doesnt look possible. 600-point drops are not an everyday occurrence. Its a return to some of the volatility seen in 2018.
Source: www.stockcharts.com
The Dow Jones Transportations (DJT) was hit harder than other indices because of the heavy component of airlines and other travel stocks that are being impacted by the coronavirus. The DJT fell 4.5% this past week and is now down 3.1% on the year. We have continuously pointed out the major divergence between the DJT and the DJI. It may be that the divergence is now coming home to roost. A key tenet of Dow Theory is that the averages must confirm each other. While the DJI kept making new all-time highs, the DJT was nowhere near its all-time high set back in September 2018 before the September/December 2018 collapse. The DJT even fell short of the high seen in January 2018. Now the DJT is on the cusp of entering a bear market, closing Friday near the 200-day MA. The DJT is down 7% from its recent high. Thats not official bear market territory; however, sustained trading below the 200-day MA would constitute a bear market.
Source: www.stlouisfed.org
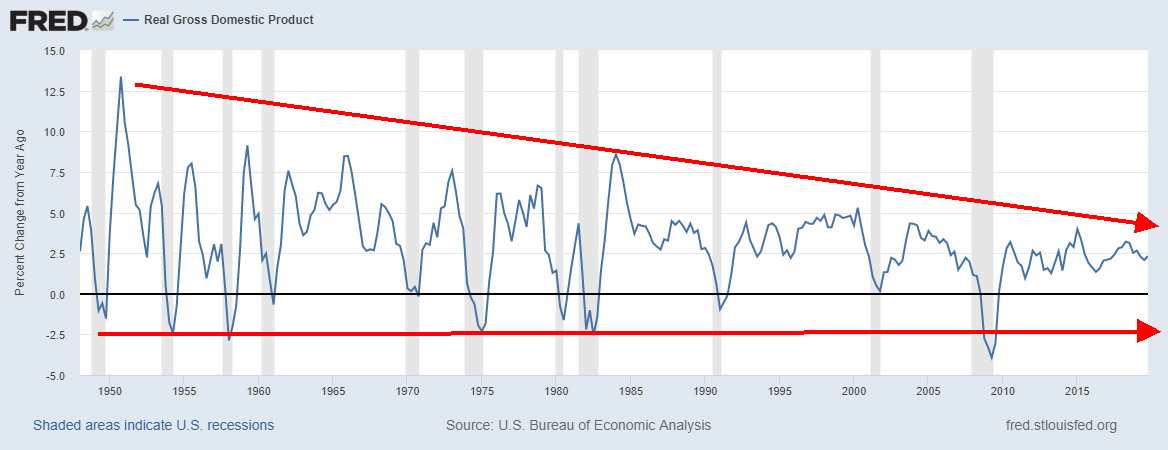
The U.S. reported that the Q4 advanced GDP grew by 2.1%, the same as for Q3. For 2019 as a whole, the U.S. economy grew by 2.3%, its lowest growth rate since 2016. That is well short of the Trump administrations 3% target for the second year in a row. We are sure that will trigger a tweeter storm, demanding that the Fed slash interest rates to zero. These results are interesting, considering that unemployment (U3) is at a 50-year low. The 2.1% for Q4 matched expectations. Consumer spending slowed, but trade made a net contribution due to falling imports. What was hurting was a negative contribution from business investment and non-residential fixed investment. Note how, over a 70-year period, the U.S. has been experiencing a series of lower gains for GDP. The reported Q4 GDP showed considerable weakness and analysts are speculating that revisions will show an even lower number.
Source: www.shadowstats.com
Shadow Stats alternate GDP reflects the inflation-adjusted, or real, year-to-year change in GDP, adjusted for distortions in government inflation usage and methodological changes that have resulted in a built-in, upside bias in the official reporting. SGS has consistently shown GDP to be substantially under-reported, even negative, since the turn of the century, except for a brief period in 20032004. SGS notes on its website that the Atlanta Fed and the New York Fed GDP models indicated growth of 1.7% and 1.2% respectively, based on hard numbers before the governments usual massaging.
Source: www.msoscillator.com, www.bea.gov
Tom McClellan of McClellan Financial Publications posted an interesting chart this week that we are sharing. McClellan asks, why are stocks going up while earnings are going down? Good question. He argues that earnings are supposed to be the primary driver of stock prices. But here he shows that pre-tax corporate profits as a % of GDP are actually falling. This is for all U.S. corporations, not just the S&P 500 companies. Yes, there is a considerable lag. Normally it is 13 years. This one has been going on for five years. Is there an explanation for this? We have constantly noted that the prime reason for the 11-year rally has been the record low interest rates, QE1, 2, 3and, more recently, the repo program that some are calling QE4plus record borrowings and massive tax cuts benefitting mainly corporations and the so-called 1%. Add them all together and we get rising stock prices, but did the economy benefit? Well, no, as all it has been doing is bumbling along with sub-par growth, despite the 50-year low in unemployment. Many of those jobs are minimum wage and part-timeor, as they love to call them, McJobs. This chart is another canary in the coal mine.
Source: www.stockcharts.com
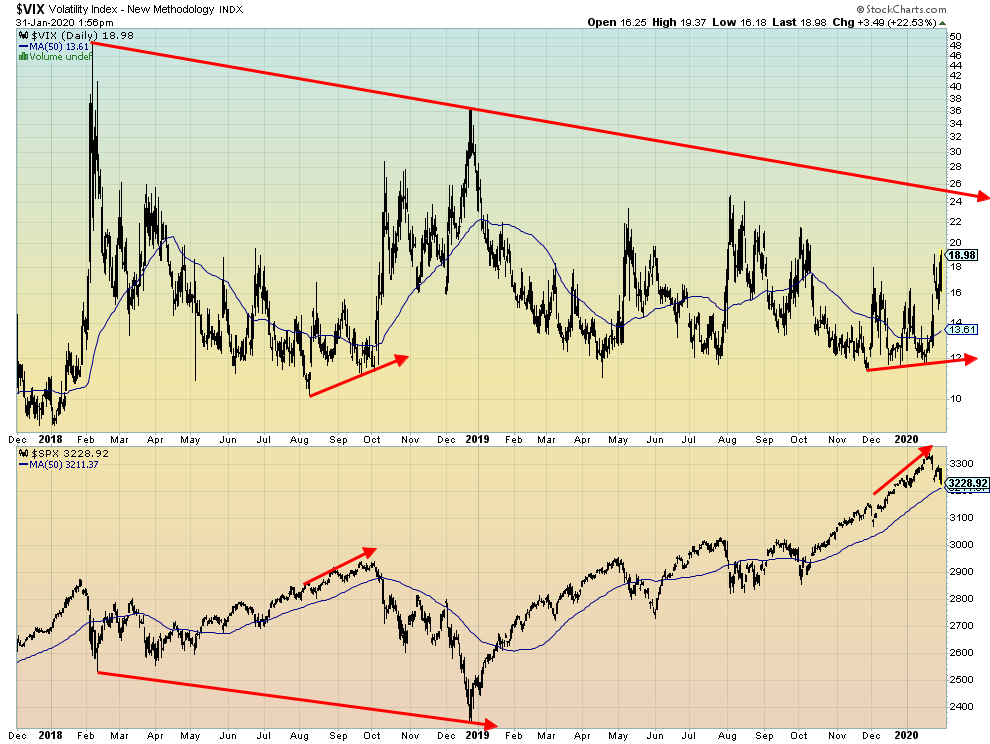
Its no surprise that volatility is rising, as measured by the VIX volatility indicator since the corrective period seen last May to October 2019. We have noted before the divergence seen at the recent top where the VIX made higher lows while the S&P 500 continued to make new all-time highs. This pattern was similar to the one seen in July to September 2018 before the sharp 20% drop into December 2018. We suspect that the downtrend from that high way back in February 2018 when the trade wars broke out will be taken out. Currently, it is near 24 for the VIX. The VIX is the clearest indicator we are currently looking at that suggests the market could have further to fall before a low is seen.
Source: www.stockcharts.com
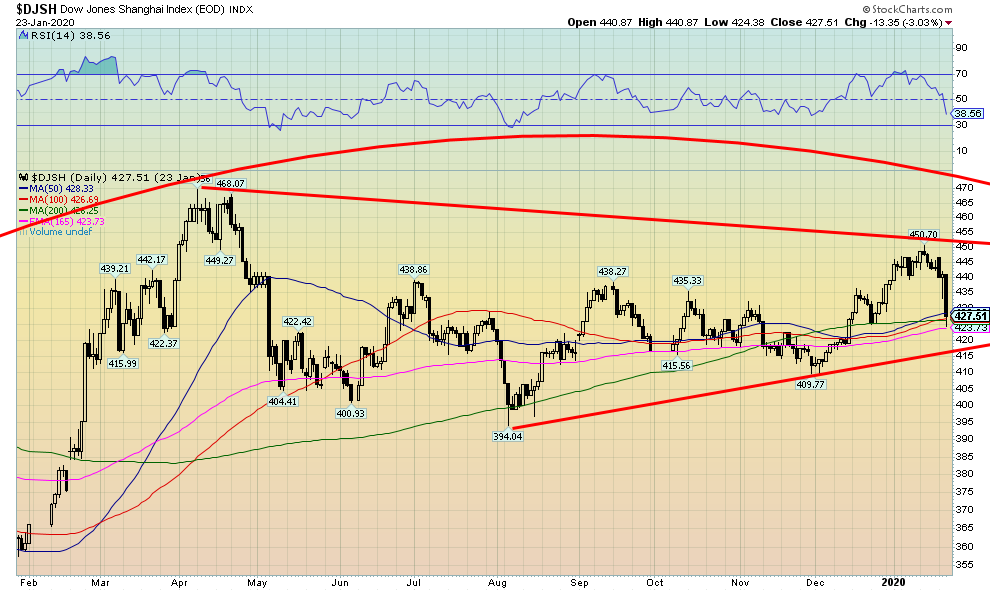
The Chinese stock market was already beginning to crack when it closed down and went on holidays for the Chinese Lunar New Year, with the last trading day on January 23. The Dow Jones Shanghai Index had already fallen over 5% from its recent top. Markets are supposed to open Monday. Given that there are lockdowns everywhere in China for coronavirus, that remains to be seen. The last time the Shanghai Index opened following a holiday break, the market fell 6%. The Chinese stock markets are quite leveraged and that does exacerbate a fall. Monday ought to be interestingassuming the markets open.
Source: www.stockcharts.com
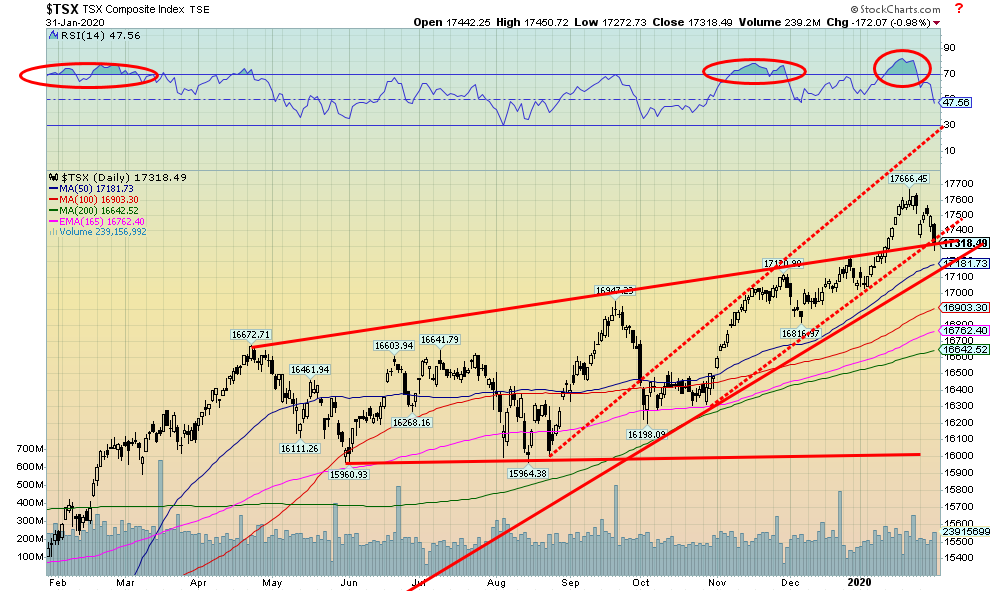
The TSX Composite followed other markets to the downside this past week; however, it actually fared better than most. The TSX Composite was down 1.4% on the week but managed to close up 1.5% on the month. It is helpful that the TSX is somewhat more weighted with gold stocks and other non-correlated stocks. Of the TSXs 14 sub-indices, four actually managed to close up on the week. The big winner was the TSX Gold Index (TGD), gaining 0.8%. Utilities made new all-time highs, gaining 0.6% while Consumer Staples was up 0.3%. Rounding out the winners was Telecommunications, up about 0.1%. Leading the way to the downside was Energy, losing 5.1%, followed by Consumer Discretionary, off 3.6%. The heavily weighted Financials sub-index was down 1.6%. The key support zone for the TSX is seen at 17,100. Below that, the TSX could begin a descent towards the 200-day MA near 16,650. Golds and Consumer Staples might be the safest places to hide.
Source: www.stockcharts.com
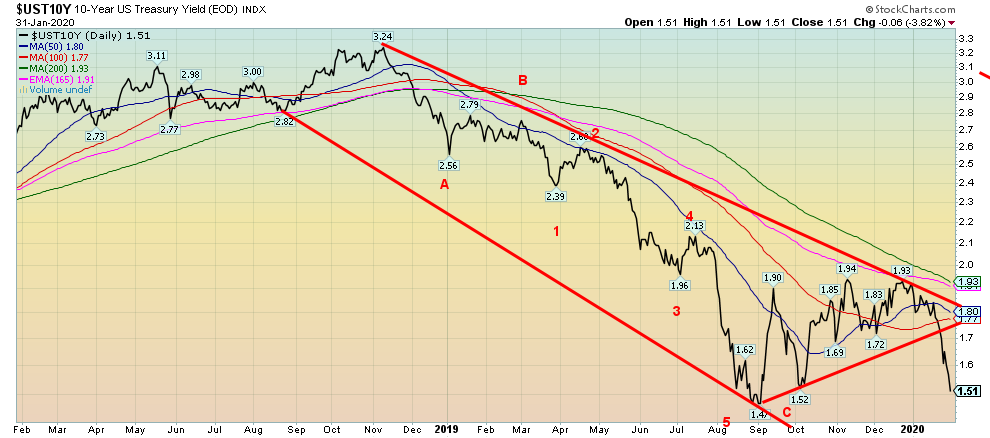
There are two safe havens in time of crisis: gold and U.S. bonds. Gold rallied this past week and so did bonds. Yields (which move inversely to prices) fell to 1.51% for the U.S. 10-year Treasury note. The U.S. 30-year Treasury bond fell below 2% for the first time since October, and yields on the U.S. 2-year Treasury note fell to their lowest level since 2017. At 1.51%, the 10-year is barely above the low in September at 1.47%. The all-time low was set in July 2016 at 1.37%. Thats interesting, considering inflation is pegged at 1.8% for 2019. So, will we see new lows below 1.37%? That is difficult to say, with some further impetus to push rates lower. We are sure that Trump would love to see negative rates, just like in the EU and Japan. But negative rates are very costly to those forced to carry bonds and many look for alternatives. As we have noted, it is better to just take cash and store it in a vault than to pay the price of negative yield bonds.
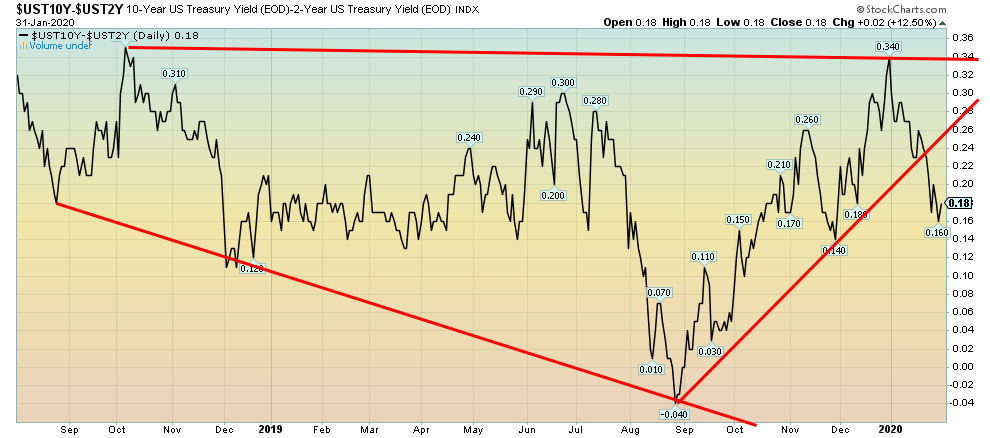
Recession Watch Spread
Source: www.stockcharts.com
Our closely followed 210 spread (U.S. 2-year treasury note less U.S. 10-year treasury note) slipped this past week to 18 bp from 21 bp as both the 2-year and the 10-year rallied. Our other watched spread, the 3-month U.S. treasury bill less the 10-year note, went negative for the first time since October, closing at negative 4 bp, down from +16 bp a week earlier. The signal there is that we are most likely getting closer to a recession even as most economists are not calling for one in 2020. Any thoughts of a recession could trigger another interest rate cut by the Fed. At the Fed meeting this past week, the FOMC held steady. We suspect that they wont do anything in March or April, either. June, however, is another question. The next meeting is March 1718, 2020. There would not be any rate cut for July or September either and, bizarrely enough, the November meeting is just before the election. If a rate cut happened in June, it would likely give another boost to stocks. And it could also help Trumps re-election.
Source: www.stockcharts.com
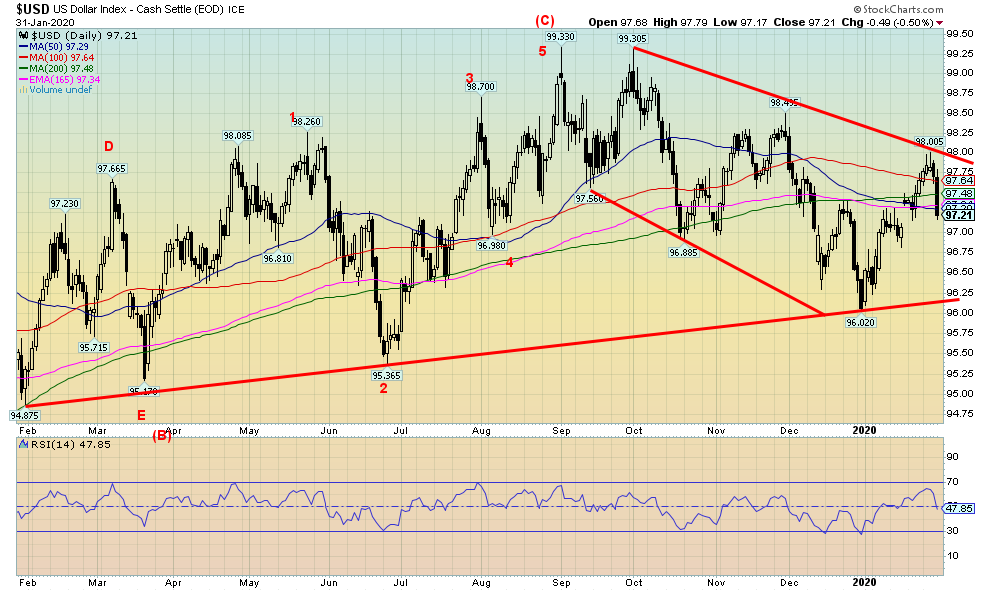
Has the US$ Index topped? The US$ Index hit a high of 98 this week, then right after turned south, falling quickly, especially on Friday as the stock market (DJI) plunged 600 points. The nature of the plunge suggests that the 98 high may be it. The US$ Index fell 0.5% on the week. The euro gained 0.6%, the Swiss franc was up 0.8%, while the Brexit-celebrating pound sterling jumped almost 1%. Despite the coronavirus in China, the Japanese yen gained 0.8% on the week. The big loser? The Canadian dollar fell 0.7%. The U.S. dollar gained about 1% against the Chinese yuan this past week. The US$ Index closed at support this past week, but a break below 96.75 would send the US$ Index down towards major support at 96.25. A break below 95 would signal that the US$ Index is headed a lot lower. Only by regaining 98 would this suggest that the US$ Index is headed higher now. With a falling stock market there is sure to be some repatriation of foreign investments and that could put further pressure on the U.S. dollar.
Source: www.stockcharts.com
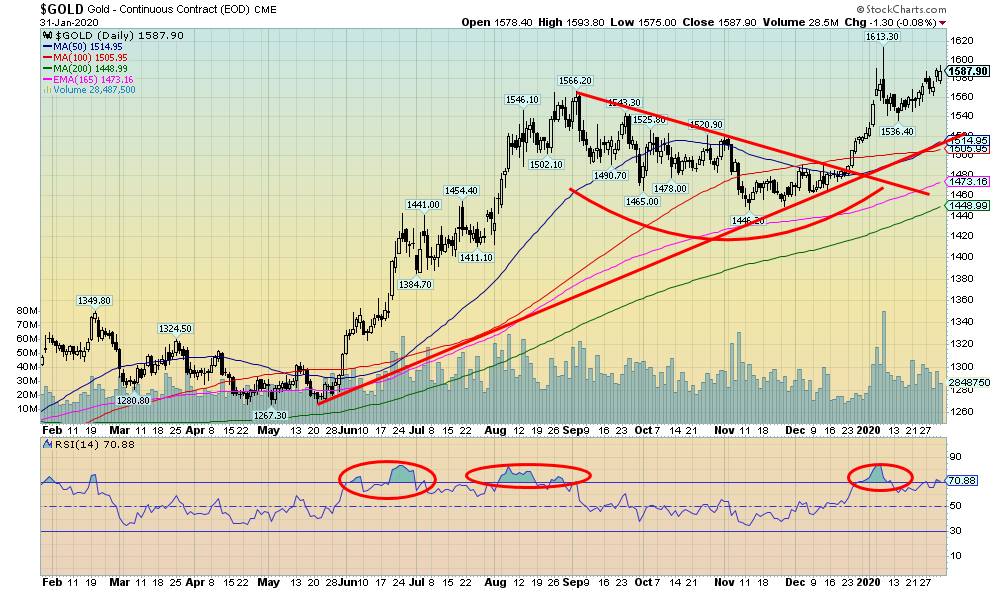
Gold loves adversity. Coronavirus, a weakening global economy, the impeachment crisis, and threats of war all help gold to rise. It is a safe haven in times of financial and economic stress. It didnt look too good for gold earlier in the week. The coronavirus scare was underway, but then on Tuesday out came some positive economic numbers and some earnings that beat the streetand then suddenly coronavirus was the last thing on their minds. Stocks soared while gold fell. By the weeks end, gold regained its lustre and closed the week up 1.0%. Gold is now up 4.3% on the year. Silver did not fare as well and was hit hard on Tuesday. It then recovered but not enough, closing off 0.6% on the week. Platinum fared even worse, falling 4.8% on the week. For the moment, the bloom is off palladium, as for once it didnt make a new all-time high, losing 4.0% on the week. Palladium is still up 16.5% on the month. Metals fared poorly because of thoughts of a recession and reduced economic activity, particularly in China. Copper fell 6.2% this past week.
There were other positives for gold on the week. We closed over $1,570, suggesting we should continue higher into February. A close under $1,570 might have suggested further consolidation. Still, we need to recoup $1,610 to suggest that new highs are in order. As we have constantly noted, we have minimum eventual targets up to $1,725. The $1,540/$1,550 zone is now support. A break below that level would take us down to $1,500. A break under $1,500 would be more negative and suggest a fall back towards $1,440.
Gold is also benefitting from continued strong central bank buying. It was reported that China net gold imports via Hong Kong surged 41.261 tonnes in December from the previous month. It was noted that may not reflect all of Chinas gold purchases as they also import via Shanghai and Beijing. Russia added some 300 thousand ounces in December.
Source: www.cotpricecharts.com
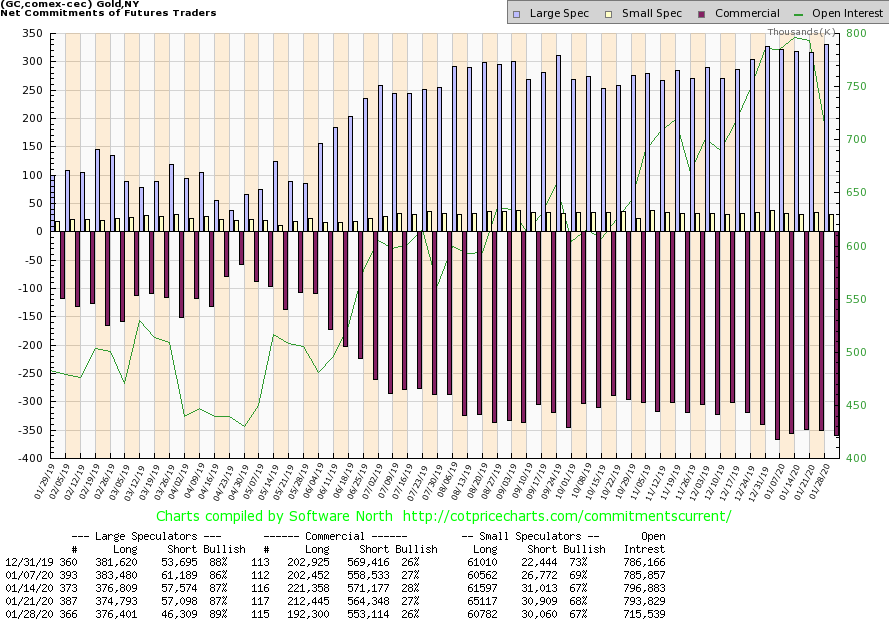
The commercial COT for gold fell to 26% this past week from 27%. Long open interest fell roughly 20,000 contracts while short open interest also fell down about 11,000 contracts. The large speculators COT (hedge funds, managed futures, etc.) rose to 89% from 87%, although it was mostly because of a roughly 11,000 contracts decline in short open interest. The commercial COT is still a bit too bearish for our liking as we find it difficult to believe the commercials would put themselves in this position. However, they may be being overwhelmed by events along with a sharp drop in the US$ Index this past week. We have seen gold go up before, despite a bearish commercial COT.
Source: www.stockcharts.com
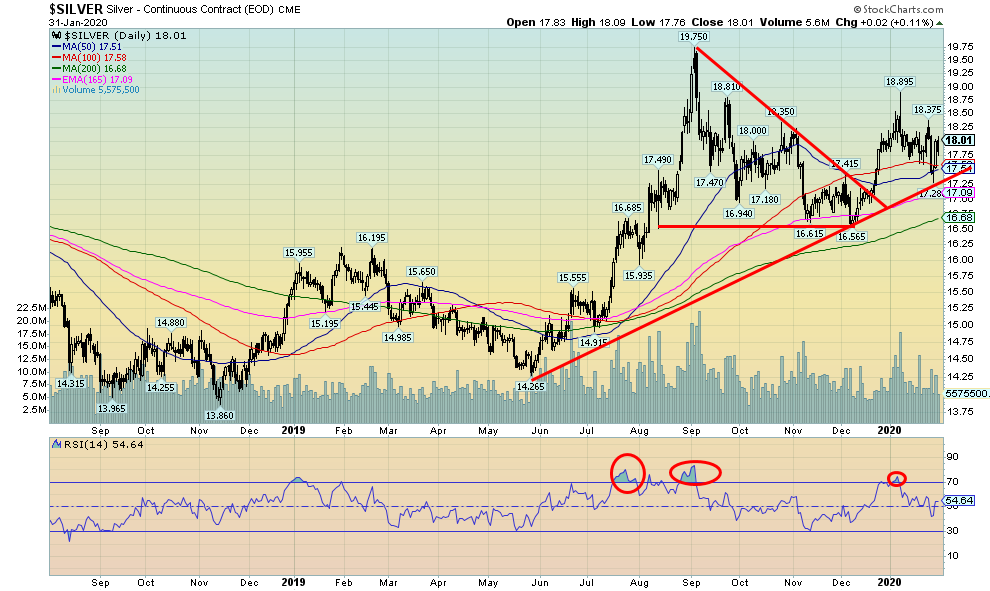
Silver in particular was hit hard on Tuesdays sell-off when it looked like everything was going to be reversed as the stock market jumped on earnings and some good economic numbers and the precious metals were hit to the downside. Silver did manage to recover, but not enough to close the week on a positive note. Silver was down 0.6% on the week. We note that for the recent down move silver made new lows but gold did not, a divergence. Silver is managing to hold onto its gain for January up 0.5%. The reality is we need to silver regain above $18.35 first and then take out the recent high at $18.90. Once that happens, then we should have a clearer route to the August highs of $19.75. We have been continually bothered by the fact that gold made new 52-week highs in the recent run-up but silver did not. A divergence.
The triangle that formed subsequent to that high suggests a potential target of at least $20.25. Silver successfully tested the uptrend line from the May 2019 low and it held. Given that, any breakdown under $17.25 would suggest lower prices for silver targeting down to first support at $16.70. Below $16.70, silver could enter bear territory. The gold/silver ratio currently sits at 88.16 and has been rising since the end of August. We usually prefer to see silver leading, not lagging. This is an unresolved divergence that normally suggests that gold and silver should soon fall. That is why key breakdown points are now quite important to watch and heed.
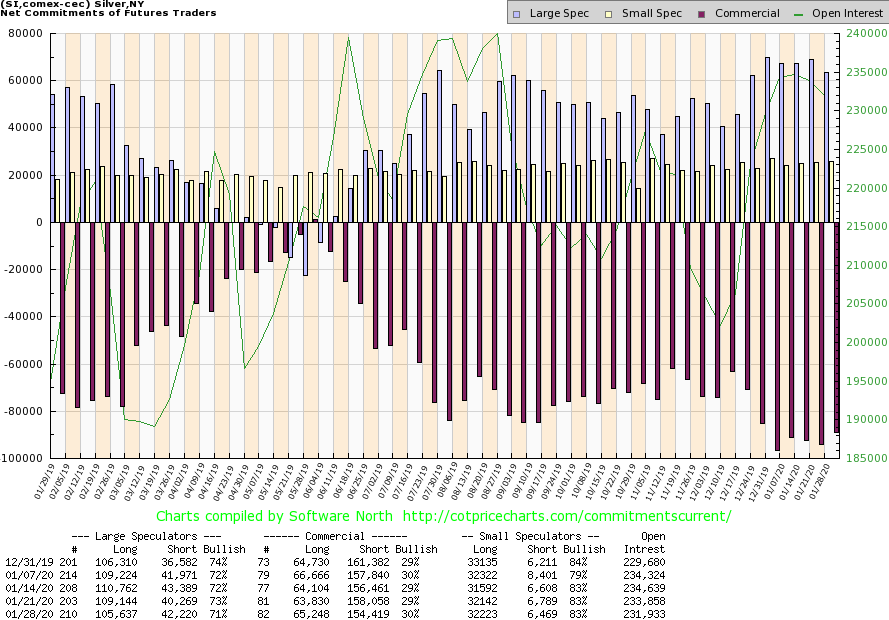
Source: www.cotpricecharts.com
The commercial COT for silver improved slightly this past week to 30% from 29%. Long open interest rose roughly 1,500 contracts while short open interest fell about 4,000 contracts. The large speculators COT slipped to 71% from 73% as they cut their long positions by roughly 3,500 contracts. Silvers poor performance vis-à-vis gold may be forcing the speculators to the sidelines. Still, they are net long. As with gold, we find the commercial COT a bit too bearish but we are pleased by the improvement.
Source: www.stockcharts.com
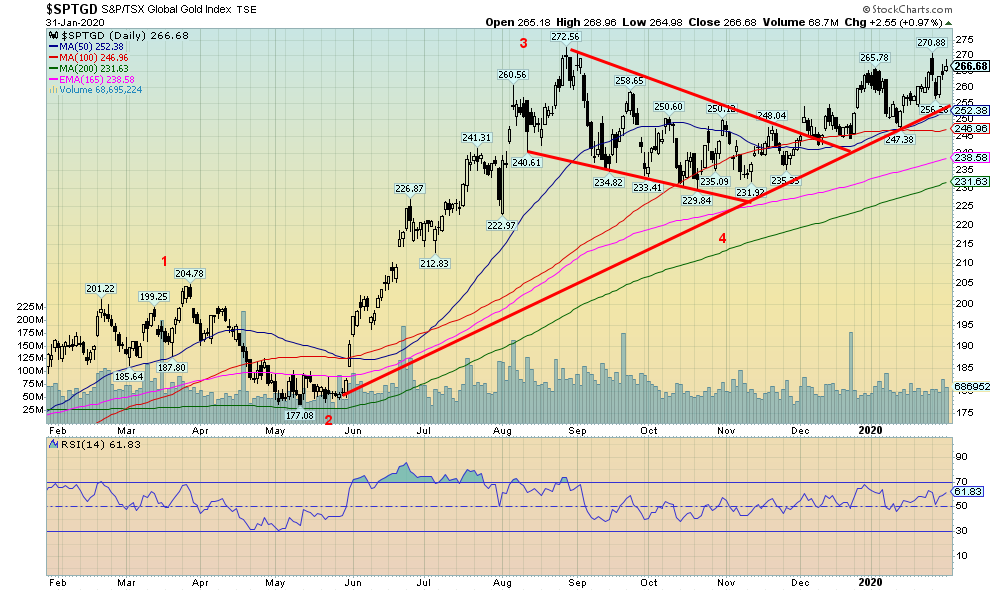
We suspect that the gold stocks were held back this past week because of the weakness in the broader market. The Gold Bugs Index (HUI) was actually down, off 0.8% while the TSX Gold Index (TGD) did manage to rise on the week, up 0.8%. The TGD is up 2.1% in January but the HUI lost 3.0%. A bit of a divergence between the two. Note that while there are a number of stocks that are common to both indices the HUI has metal companies like Compania de Minas Buenaventura (BVN). BVN was off 14.4% in January. The TGD rebounded in the latter part of the week after taking a hit during Tuesdays sharp selloff. The return action does suggest that we could see new highs above 270 and even 272, the August high, soon. The breakdown level is now seen at 252. The RSI has been rising steadily with the market a positive sign. And there are no signs of the market being overbought.
Source: www.stockcharts.com
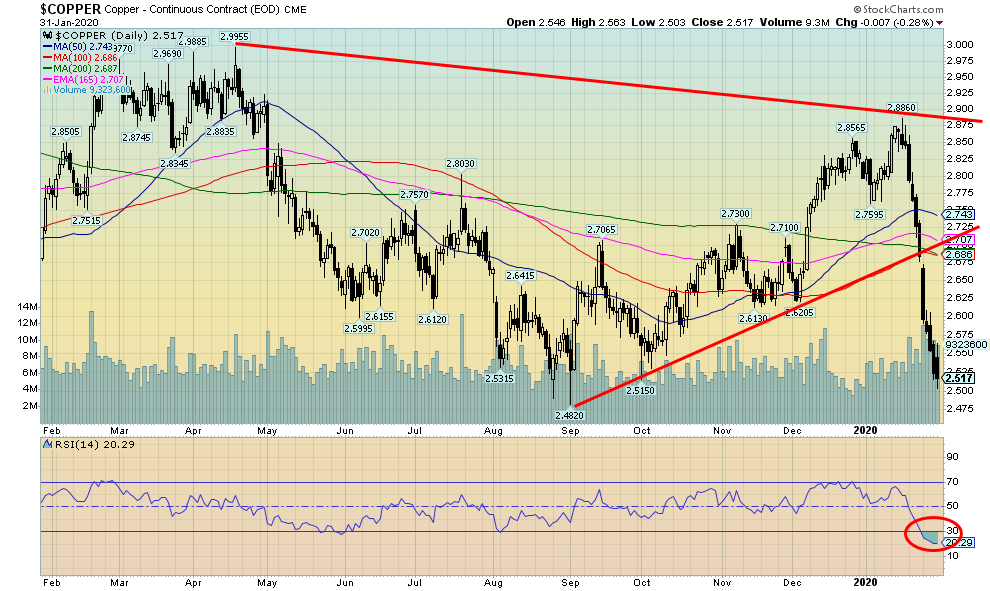
Into the abyss Part 1. Copper prices have plunged in the wake of the coronavirus scare. Thats a 12.8% decline since January 16, wiping out all the gains since September 2019. Note the increase in volume on the plunge. China uses a lot of copper in building, etc. Other metal prices are plunging as well. The CRB Index has fallen about 8% since the beginning of the year. The CRB Index is made up of 19 commodities dominated by petroleum products (33%). We note, however, the RSI for copper has fallen sharply under 30. That suggests to us that there is some potential for copper to find some stabilization here. New lows below $2.48 could be seen before that happens. But suspicions are that a low, or at least a temporary low, could soon be seen. A major copper producer, Teck Resources (TECK.B), is trading at a 2-year low, down 24.1% in January. Potential targets are as low as $7 (current $17.10).
Source: www.stockcharts.com
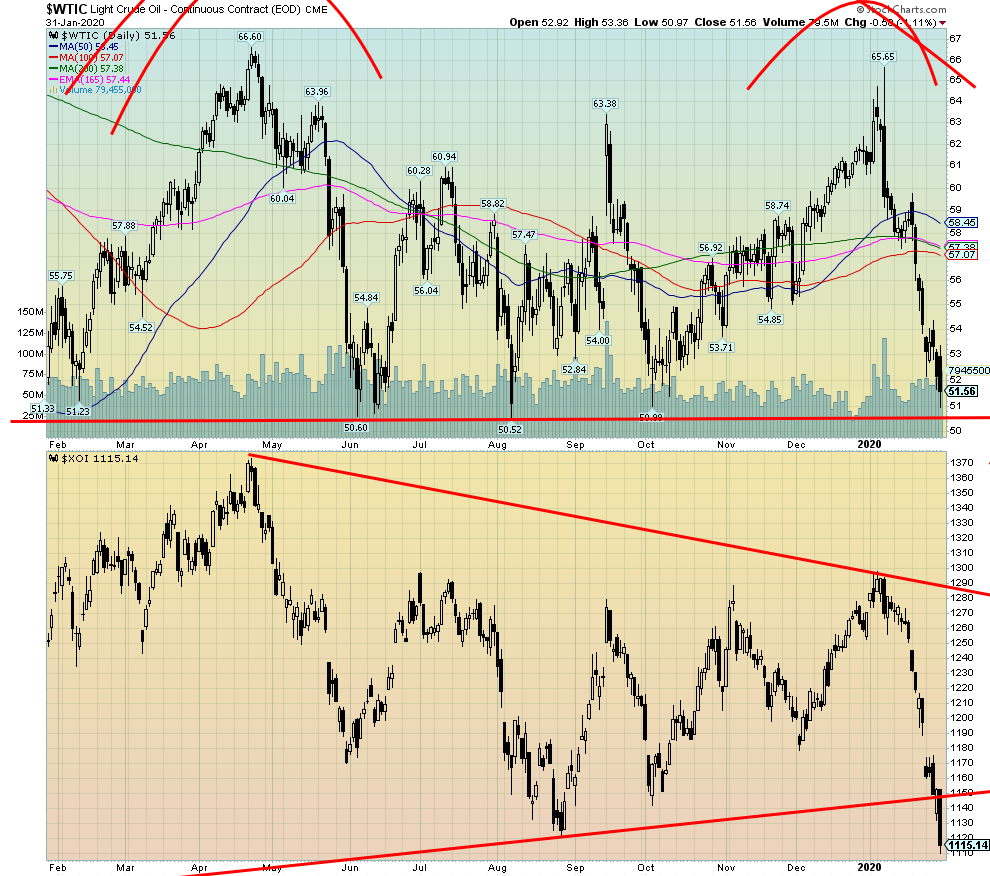
Into the abyss Part 2. As fears of the coronavirus rise, oil prices have plunged. So far, in January, oil is down 15.6% (4.9% on the week). It is the worst January performance since 1991. Besides the coronavirus, oil is plagued with over-supply. Couple this with signs of a slowing economy and oil prices could have further to fallthat is, unless war were to break out tomorrow in the Middle East, involving Iran, Saudi Arabia, and the U.S. with the closing of the Straits of Hormuz. Thats the bad news about oil. The good news is that we are fast approaching significant support at $50, and we understand that Saudi Arabia, along with Russia, is calling an emergency meeting of OPEC. Neither would be pleased with lower oil prices.
We couldnt help but notice that Exxon (XOM) and Chevron (CVX) reported weak earnings this past week. With oil prices down (and natural gas also getting pounded 3.7% on the week and 16.6% on the month), it is no surprise to see the energy indices down as well this past week. The Arca Oil & Gas Index (XOI) lost 6.9% on the week and is down 12.2% on the month. The TSX Energy Index (TEN) fared a little better, off 5.1% on the week and 11.2% on the month. It is no fun being invested the energy sector.
Another interesting tidbit we saw is that companies and institutional investors are being told to ignore, or at least not to take advantage of the Trump administrations de-regulation changes. Companies and institutional investors could face legal challenges or see protections restored by the courts of future administrations. The warning covered not only the oil and gas industry but also forestry and mining. In Alberta, there is already a major battle brewing over stranded wells and who pays for themthe taxpayer or the companies.
Both oil and gas, along with the energy stocks, are grossly oversold at this point. That doesnt mean one should step into them to catch a falling knife. The opportunity will come when things settle down. In the interim, oil and gas could go lower still. A break of $50 for WTI oil could send oil prices into the low $40s.
David Chapman
Copyright David Chapman, 2020
TECHNICAL SCOOP Charts and commentary by David Chapman Chief Strategist, Enriched Investing Inc. Phone: 416-523-5454 Email: david@davidchapman.com dchapman@enrichedinvesting.com Twitter: @Davcha12 February 3, 2020 |
David Chapman is not a registered advisory service and is not an exempt market dealer (EMD). We do not and cannot give individualised market advice. The information in this newsletter is intended only for informational and educational purposes. It should not be considered a solicitation of an offer or sale of any security. The reader assumes all risk when trading in securities and David Chapman advises consulting a licensed professional financial advisor before proceeding with any trade or idea presented in this newsletter. We share our ideas and opinions for informational and educational purposes only and expect the reader to perform due diligence before considering a position in any security. That includes consulting with your own licensed professional financial advisor.
GLOSSARY
Trends
Daily Short-term trend (For swing traders)
Weekly Intermediate-term trend (For long-term trend followers)
Monthly Long-term secular trend (For long-term trend followers)
Up The trend is up.
Down The trend is down
Neutral Indicators are mostly neutral. A trend change might be in the offing.
Weak The trend is still up or down but it is weakening. It is also a sign that the trend might change.
Topping Indicators are suggesting that while the trend remains up there are considerable signs that suggest that the market is topping.
Bottoming Indicators are suggesting that while the trend is down there are considerable signs that suggest that the market is bottoming.
| Digg This Article
-- Published: Monday, 3 February 2020 | E-Mail | Print | Source: GoldSeek.com


