Dow Crashes 2,000 Points in Record Day! The Bear is at the Door.
-- Published: Tuesday, 10 March 2020 | Print | Disqus
By:David Haggith
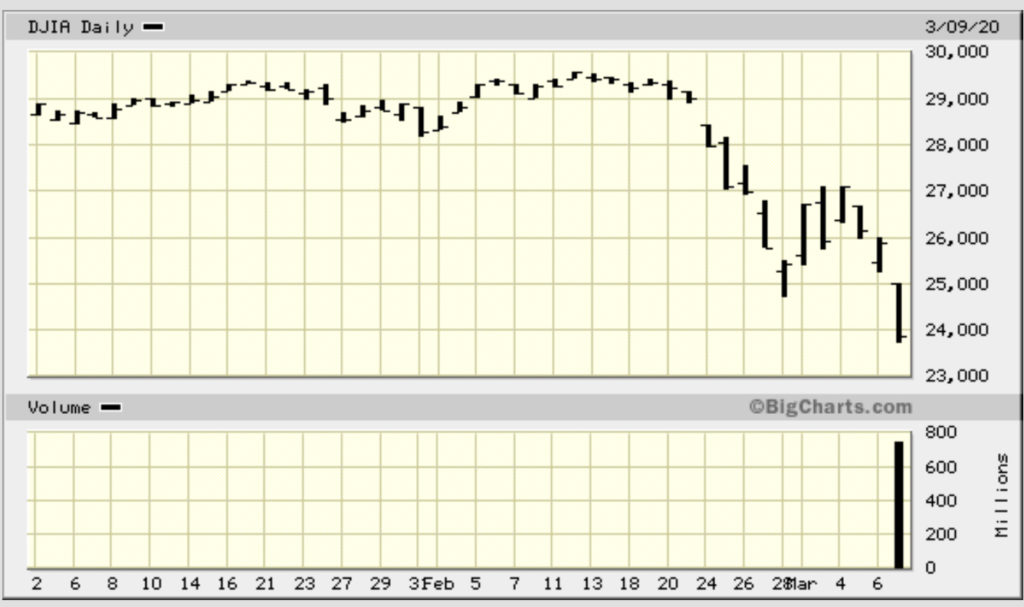
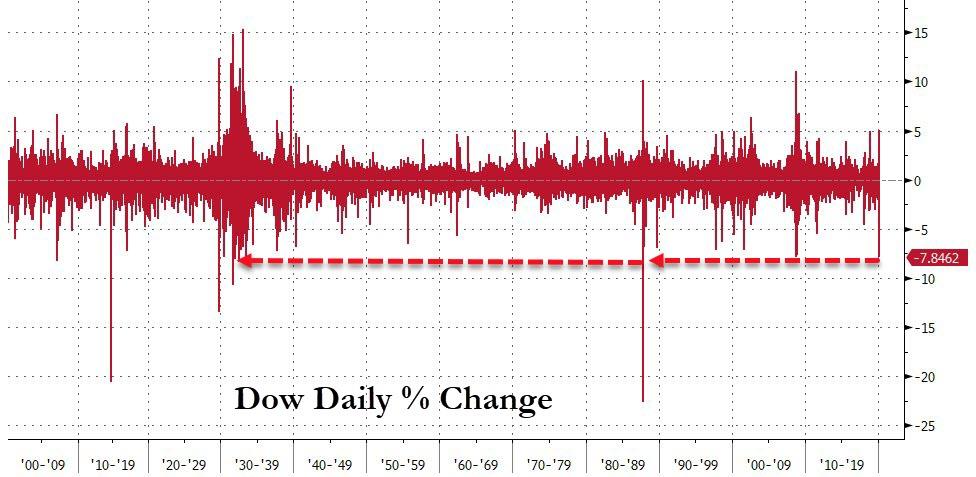
Yesterday was the greatest crash in Wall Street history by one measure, and took down many other milestones.The Dow plunged 2,012 points in its largest single-session drop on record!Percentage-wise it was down 7.8%, which still knocked out decades of lows, leading to Black Monday being the hot search term on Google today as people sought a comparison worthy of this Monday crash.
For comparison, the 1929 event looked like this:
The stock market crash of 1929 considered the worst economic event in world history began on Thursday, October 24, 1929, with skittish investors trading a record 12.9 million shares. On October 28, dubbed Black Monday, the Dow Jones Industrial Average plunged nearly 13 percent. The market fell another 12 percent the next day, Black Tuesday. While the crisis send shock waves across the financial world, there were numerous signs that a stock market crash was coming.
The times leading up to that crash sound like the past year:
After 1922, the stock market had increased by nearly 20 percent each year until 1929 . People bought stocks with easy credit. During the 1920s, there was a rapid growth in bank credit and easily acquired loans. People encouraged by the markets stability were unafraid of debt.
The bear is at the door
The total percentage drop in just five days in 1929 was 22%, but the Dow was already down 30% from its September 3 high.Todays market is down 19% in three weeks from its high, but we dont know how far it has left to fall. Maybe it will get another dead-cat bounce like the last one and will take longer than just tomorrow to go full bear:
Or maybe the news after closing thatallof Italy is now quarantined will rock its boat all over again. There we were floating along the river, and we came to a waterfall, plunged over the edge bounced up over a rapid and plunged over a second waterfall today. Lets get out of the water and assess the damage.
As for the other indices drop today
the S&P 500 lost 7.6%, and the Nasdaq Composite fell 7.3%. Each index registered its largest one-day loss since the financial crisis in 2008 .
[That the] coronavirus caused U.S. stock-market decline of nearly 20% from the February peak doesnt change the grim long-term outlook for U.S. equity returns, says Rob Arnott, founder of the asset manager Research Affiliates.
Still grim means more falls to come in that managers opinion.
The stock market is less than one percentage point from a full-bear retreatfrom the heady days when it I called it the most perilous market in history.In 2018, the stock market took three months to become a bear market in all but one index. Now it has almost made that dive in three weeks.Remember how bad that autumn felt. Well this event went the same distance in about a quarter of that time.
Particularly notable on this journey over the falls was that epochal moment when the Fed gave the market a double-dose of the interest cuts it thought the market wanted, and for the first time the market did the opposite of what the Fed wanted and plunged again. Then, last night the Fed increased its repo operations, which have been providing a form of clandestine QE the market craved, and the market took its biggest point drop ever.
So, the most remarkable thing about this trip over the twin waterfalls is that, with great impact, it marks that time in history I have said since 2012 will most certainly come when all the Feds ammo has gone so far over and down the bell curve of diminishing returns that each action now brings negative results, instead of just smaller and smaller positive results.
Even Krazy Kramer today could see this event marks that time, as I said in my Patron Post yesterday, when the Fed has finally hit the wall. Its old tricks are not going to work:
This day means monetary policy is over.
(Sadly, there is Kramer begging for corporate welfare, begging for businesses that are zombies because they ran their credit high just to do buybacks to now get special additional low-interest loans like helicopter money to carry them through, but well save that topic for another time.)
More fascinating facts about todays big dive
Today was the first time intwenty-three yearsthat the market fell so hard it tripped a circuit breaker that shut the market down for fifteen minutes to cool off!This was not a literal circuit breaker, but a set of rules that state certain percentage points in a major decline when the market must shut of trade and catch its breath. So, this was an exhilarating ride.
Trading was stopped shortly after the markets opened at 9:30 a.m. Eastern time, triggered by a 7% drop in the S&P 500 index. The S&P 500 has three circuit breakers that kick in when stocks decline by 7%, 13% or 20% in a single trading session . Stocks are now in a correction, when the market declines 10% from its most recent high, and are approaching so-called bear territory, or when stocks lose more than 20% of their value.
If you ever wondered what would happen if someone lobbed a hand grenade into a bloodbath, now you know, Tom Holland of investor advisory firm Gavekal, said in a report.Its not pretty. Investors logging onto their screens on Monday have been greeted by a sea of red, the like of which has not been seen for 10 years . One of the few things investors can conclude with any confidence is that market conditions are now likely to get a good deal worse before they get better.
So, it was also the ugliest sea of red in ten years, which takes us, as usual, now to comparisons back to the Great Recession to find a match.
However, the total percentage drop for the day was even bigger than the 23-year-ago circuit-breaker event.This was the deepest percentage crash in 33 years, going back to the Black Monday Crash of 1987. Beyond that, you have to go all the way back to the Great Depression to beat it.
Moreover,
The number of stocks that have hit new 52-week lows has jumped to the highest levels seen since the midst of the financial crisis .
For the Dow, today marked the lowest close in over a year.
In just one day
New lows more than doubled to 1,578 from 722 on the NYSE and to 1,334 from 646 on the Nasdaq. Those are the highest readings for both exchanges since Oct. 10, 2008 . Keep in mind, the indexes didnt bottom during the financial crisis until March 9, 2009.
So, maybe this time has a long way to the bottom, too.
Im not big on charts, but some found this to be a chilling perch to land on:
S&P 500 coincidentally(?) closes right at its 61.8% Fibonacci retracement point: It seemed be guided by the divine ratio . Many chart watchers believe a convincing close below that level would suggest a full retracement of the previous rally becomes the next downside target.
In other words, if it hammers through the line it just came to rest on, traders think it will likely fall, at least, to the bottom of its 2018 trough.
The Fibonacci ratio of 0.618 is also referred to as the golden ratio, or the divine ratio, because it has been found throughout nature, including the patter of a seashell, the DNA double helix and flower petals. Chart watchers have adopted the ratio to help map the ebb and flow of financial markets.
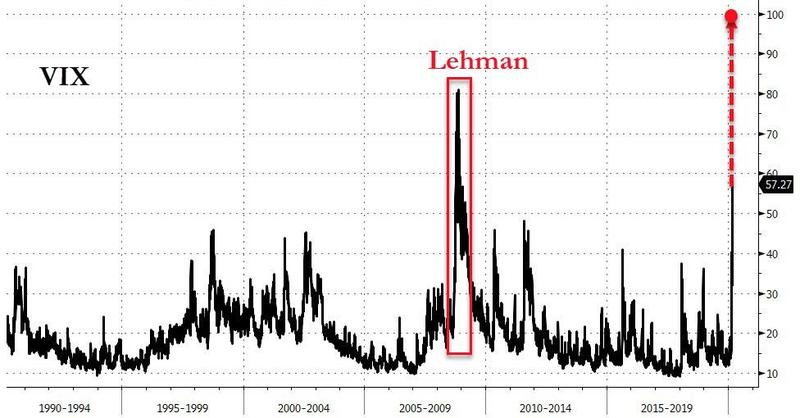
The VIX, that gauge of market volatility most often referenced, is trying to match its Lehman moment:
Its not there yet, butBloombergreports some traders fear it will reach that point tomorrow based on existing trading contracts.
Sven Henrich already noted the day before why VIX was concerning even before it hit this high:
Were faced with the most critical time since the financial crisis. Thats not my opinion, this is what the $VIX says. Its behaving in a very unusual and rare way and everyone better pay very close attention.When I made the $VIX 46 call in January it seemed like an idiotic call to make for $VIX moves into the 40s are extremely rare. But it happened and $VIX hit 46 a week ago and now on Friday $VIX hit 54 before again reverting below the trend line.
Whats the $VIX really saying here? That the Fed and every central bank on the planet are at high risk of losing total control over these marketsin which case $VIX could go to 90 and $SPX could ultimate drop to 1800-2000. Thats not hyperbole, thats what the charts say, the same charts that told you $VIX 46 was coming and that suggested a big drop was coming:
And then today it shot even higher above its trend.
Last weeks panic rate cut by the Fed was a complete failure. Again the Fed misread the market and the incompetence is stunning.On February 20 and 21 Fed speakers were arrogantly cheerleading and arguing no rate cuts were necessary. Two weeks later they panic cut .
Remember, bears were stupid right? That was the sentiment. Retail jumped long. Everybody and their mother were upgrading stocks and markets left right and center, who needs protection right? Well,total disaster and I mean total disaster. Small caps, transports, banks,more than a year of buying completely wiped out in a matter of a couple of weeks.
Thats where we stand.
Morgan Stanleys Michael Wilson says it will get worse:
Last weeks move essentially confirms that last summers cuts werent insurance at all but the start of a full-blown easing cycle.We would argue that the recent cut resembles the January 2001 episode in terms of where we are in the economic cycle and other parallels with todays markets, most notably an extraordinary concentration of market cap in technology stocks.
I always thought the cyclical bear market that began in 2018 had unfinished business once the liquidity surge ended. COVID-19 provided the spark for its completion, which means pricing in a greater likelihood of US recession.We believe equity markets will struggle until policy-makers get back ahead of the curve with more interest rate cuts and an extension of the current balance sheet expansion and/or an official quantitative easing program something we think is likely coming.
Scott Minerd, Guggenheims global CIO sums up the stock markets transformation today this way:
If I had written a commentary on how 4,000 people dying from the flu would topple global financial markets, I think I would have been deemed insane. Yet today that is exactly the story.
After all, the World Health Organization estimates that influenza kills 290,000 to 650,000 people per year. How does this statistically small number of 4,000 versus a global population of 7 billion bring the market to its knees? I dont think I have to explain that right now, but if anyone thinks I need to, feel free to reach out to me in a socially distant fashion once you have washed your hands for 20 seconds and then rinsed them in Purell.
Amazingly, the market is finally waking up to the prospects of not just viral contagion but also to financial contagion .
We arrive at this moment with the overleveraged corporate sector about to face the prospect that new-issue bond markets may seize up, as they did last week, and that even seemingly sound companies will find credit expensive or difficult to obtain .
After a decade of profligate borrowing by corporations, it would seem that any reasonable investor would have realized the fragility of the financial system .
What next? I hate to admit this, but fair value on the 10-year Treasury note will reach50 basis points before year end and the possibility that rates could overshoot to2 percent .
Our estimate is that there is potentially as much as a trillion dollars of high-grade bonds heading to junk .
As for stocks, technical analysis suggests that there should be support around 2600 on the S&P 500, but in a recession scenario a level closer to 2000 could be the ultimate outcome .
I recall the quote from Winston Churchill: This is not the end. It is not even the beginning of the end. But it is, perhaps, the end of the beginning.
So, now I want to show you how badly the Fed failedagaintoday and then ask you where does the Fed go next? To do that I am going to share an excerpt of my latest Patron Post to see if you are interested in knowing the answer to that question:
What Will the Fed Do, Part Two
That didnt take long! After completing my Patron Post yesterday that said the Fed would try to save the stock market with more rate cuts and more QE that wouldnt work, the Fed overnight seriously upped the amperage on its QE repos. And it didnt work spectacularly! That is to say, it was a total face plant in terms of the stock market. There has not ever been a more spectacular financial fail.
I refer to these as QE repos because they are continuously rolling over exactly as I said they would from the start until they are (as of late) converted into quantitative wheezing, which is what we should perhaps call QE that is not QE according to the Fedand that also doesnt work anymore.
The New York Feds statement regarding its shocking not QE jolt to the overnight and term repo desk read as follows:
The Open Market Trading Desk at the Federal Reserve Bank of New York has updated the current monthly schedule of repurchase agreement (repo) operations.
Beginning with todays operation and through March 12, 2020, the Desk will increase the amount offered in daily overnight repo operations from at least $100 billion to at least $150 billion.In addition, the Desk will increase the amount offered in the two-week term repo operations from at least $20 billion to at least $45 billion.
Consistent with the FOMC directive to the Desk, these adjustments are intended to ensure that the supply of reserves remains ample and to mitigate the risk of money market pressures that could adversely affect policy implementation. They should help support smooth functioning of funding markets as market participants implement business resiliency plans in response to the coronavirus.
As the biggest of repos during the entirety of the Repocalypse, last night may have helped stabilize money markets, which subscribed to $112 billion worth this morning, BUT it sure didnt help the stock market, which took its biggest intraday point drop in history Dow down more than 2,000 points!
So, the first count in my case was proven in just one night:Expansion of QE via repo isnt going to save the economy or the market anymore.We are clearly at the critical juncture I spoke of in that last Patron Post.
Meanwhile, the market also priced in a Fed reduction in interest rates of 100 basis points by April, meaning the market is expecting the Fed to hit the zero bound by April. That means anything less than that will be disappointing and will be met with disapproval at the stock exchange.
Therefore, the second count in my case (that interest-rate cuts have hit the level of diminishing returns where they will now be ineffective) has been proven overnight, too.Anything less than plunging to the zero bound on the Feds part will result in further market disturbance; and, of course, interest cuts will do nothing to aid a breakdown in supply chains or stir an economy where people all over the world are being commanded to isolate themselves due to a virus.
So, as I said in that last Patron Post, the Fed may continue to try some of its old ammo because it doesnt know what else to do that it CAN do, but it is now finding the old ammo is all past its shelf life, and its powder is all wet. The Fed is backed up to the Law of Diminishing Returns.
Meanwhile Market halt was reportedly a popular term today, too; but the Donald was enjoying a nice round of golf, so he must have been confident that his Plunge Protection Team would carry out his bidding.But that didnt work either!
With US$2.5 trillion wiped off the face of the earth in global stocks, it may not be long before this crash overcomes that barrier to total Fed manipulation of the market via hostile takeover . Imagine what the Fed could do if congress gave it permission to purchase stocks directly. That might not be an easy sell to congress until the financial situation becomes dire, but the situation will become dire quickly. With unlimited money-creation capacity, the Fed can keep any falling stock market up for as long as it wants . But is the Fed interested in taking the market into receivership by absorbing private industry into the Feds own centrally owned economy like a giant ameba?
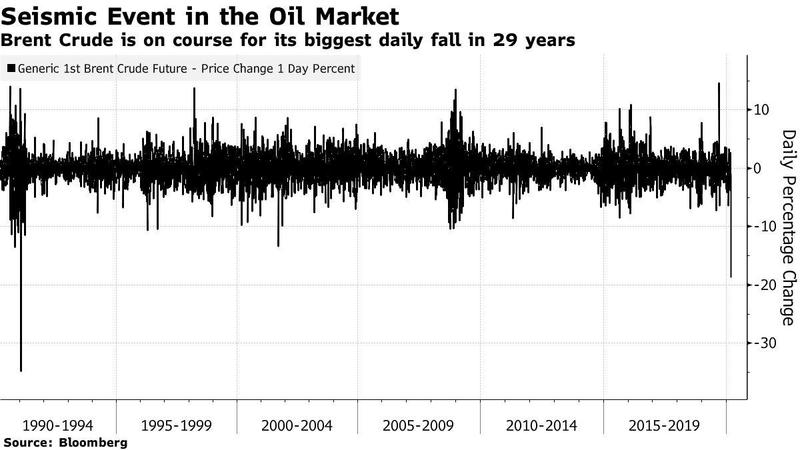
Oil lost $16 a barrel over the weekend, cratering at the open to $27 a barrel. By the end of the day, it settled at $32. That opening number was a 30% plunge overnight! That takes us back to the days of the gulf war to see that kind of price swing. Wow! This was a day of disasters all over the place .
I recall the huge upward price swing of the 1970s oil embargo that sunk the US into a long recession by creating massive inflation in the price of everything. A price swing this size in the other direction can also cause a recession in todays junk market in a much different way, which we saw today. The overnight oil crisis exploded into carnage on Wall Street because many oil-related companies have already taken on all the cheap credit they can afford, so theyll die quickly with oil falling far below what they need to maintain their debts, which were already rated as junk.
And thats how the Fed failed to improve anything with its major overnight and term repo revisions. With economic times overwhelming the diminished potency of the Feds normal tools, weve arrived in one night to the place where we need to look back at what the Fed has said about buying stocks directly (and why not oil, too, while theyre at it or just soak up oil companies and create money for them to pay their debts) .
When you have infinite money creation powers, you can buy as much as you want of everything to rig prices back up. All possibilities are on the table now. Some will require congressional approval.
Where does the Fed stand now on buying stocks directly to prop up its beloved and beholden market?
All of this brings us in just one night back to the question of
What is the Fed planning to do now?
Quantitative easing on steroids?
Helicopter money drops to the general public?
Become the largest US corporate shareholder via direct corporate bailouts?
Turn the dollar into central bank digital currency for greater monetary control?
The Feds failure is in the bag. The past seven days cinched the bags drawstrings around the Feds old medicine. Even the Kramers of this world can see old FedMed doesnt work anymore. The rest of the above Patron Post and the one that came before explains in our central bankers own words what the Fed and other central banks are considering for this critical juncture.
If you want to be in the know about the Feds next moves and decide to become a patron at the $5 level of support or more before April to help keep me writing, Ill make sure you have access to both of those articles in twenty-four hours. You wont have to wait until your first pledge processes at the start of April. Just click the link below to sign up, which also helps assure all these free articles keep coming. These times that may try our souls in the months ahead may also mark the time now to become a volunteer supporter:
The content on this site is protected
by U.S. and international copyright laws and is the property of GoldSeek.com
and/or the providers of the content under license. By "content" we mean any
information, mode of expression, or other materials and services found on GoldSeek.com.
This includes editorials, news, our writings, graphics, and any and all other
features found on the site. Please contact
us for any further information.
Live GoldSeek Visitor Map | Disclaimer
The views contained here may not represent the views of GoldSeek.com, Gold Seek LLC, its affiliates or advertisers. GoldSeek.com, Gold Seek LLC makes no representation, warranty or guarantee as to the accuracy
or completeness of the information (including news, editorials, prices, statistics,
analyses and the like) provided through its service. Any copying, reproduction
and/or redistribution of any of the documents, data, content or materials contained
on or within this website, without the express written consent of GoldSeek.com, Gold Seek LLC,
is strictly prohibited. In no event shall GoldSeek.com, Gold Seek LLC or its affiliates be
liable to any person for any decision made or action taken in reliance upon
the information provided herein.