-- Published: Friday, 17 April 2020 | Print | Disqus
By Marin Katusa
Interest in gold and gold stocks has skyrocketed in the last 2 weeks. And for good reason.
Lets recap what weve just seen in short order
- Explosive price gains check.
- Massive changes in investor sentiment check.
- Retail calling stockbrokers (and vice versa) about highly speculative junior gold stocks check.
Gold surged from $1,470 during the peak of the March Meltdown to over $1,750 this week. Gold is getting hot again.
Stockbrokers that were all cannabis and blockchain oriented the last few years are now calling their clients about the next hot junior gold stock.
Get in now before the exploration this spring and summer.
Oh please.
And bankers are lining up the next big financings to fill their institutional clients with.
Searches for gold stocks are up sharply and the newsletter crowd will follow shortly.
My red flags are going up.
In the long run, Im very bullish on gold. But like all commodities, it is very cyclical.
But Marin, gold is money!
Yes, true but most junior exploration companies have no gold.
And I have a very different take on whats going to happen (which I alerted subscribers to last week).
So far, its unfolding like I thought it would. But from here on out there are 2 scenarios that could happen over the coming weeks and months.
In either unfolding scenario, we are prepared to act.
For those new to the program (and those catching up), lets take a look at how gold does during bad market conditions.
Gold as Crisis Insurance
This is a chart of the S&P 500s largest declines in the past forty years. And it shows golds performance in the same time frame.
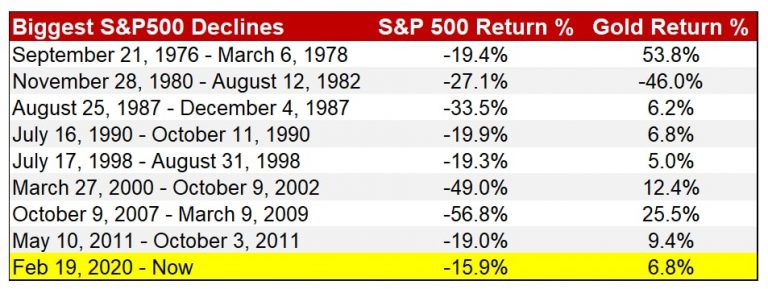
First, youll see that glaring decline in the price of gold in the early 80s.
Gold had just come off its best decade ever, with a 2,300% increase. The cool-off period had to come.
But youll also notice that the length of the decline doesnt matter. Gold nearly inevitably risesat least a littlewhether the recession lasts a few months or a few years.
Think of gold like earthquake insurance.
Your city is destroyed. Suddenly, everyone you know wants earthquake insurance too. After such devastation, banks may require multi-dwelling buildings to have earthquake insurance as part of the mortgage.
Right now, its too late. Gold prices are too high, and dropping stock prices are closing in fast.
- Gold is insurance that can give you insane protection on your portfolio once everything is broken. Thus far, its working.
COT Report What are Gold Traders Saying?
Every week the Commitment of Traders report comes out. It details what positions the large speculators and the commercial side are taking.
Its another tool you can use to make your own bets in the sector.
In the chart below youll see the non-commercial long positions in gold. Youll notice that these traders are reducing their net longs in gold (which was at a 10-year high recently).

On the way down from the 10-year high in long contracts, however, it found some support around the 5-year trend line. This indicates that traders arent quite ready to let go of their safe haven long gold positions just yet.
This is an important point for gold, and we are watching this closely.
Maybe well get another chance to add to our gold stock holdings in the portfolio yet.
In the next chart, lets look at the short positions of the large speculators
Large speculators short positions in gold are at 5-year lows. Meanwhile, the gold price is at 5-year highs. Is there a rapid reversal coming?

Technical Analysis (TA) Corner
From a technical standpoint, a longer-term pattern is forming where gold may test the major resistance band around $1,750-$1,800.

A classic Cup & Handle formation could occur where gold pulls back to test the recent support level. I am not a TA guru, but I do know the best in the business. I dont base any of my decisions on any one fact, which is why I also pay attention to what the TA charts are saying.
The key is this: Can gold consolidate above the $1,750 range for a couple of weeks?
If so, well have created a new base. If not, the short crowd will be slamming gold hard.
But if gold continues to rally, there could be a higher support level formed similarly to what developed back in 2011-2013.
How high gold will go is anyones guess, but a pullback is expected at some point.
Were closely watching this as well as theres been a recent support line forming.
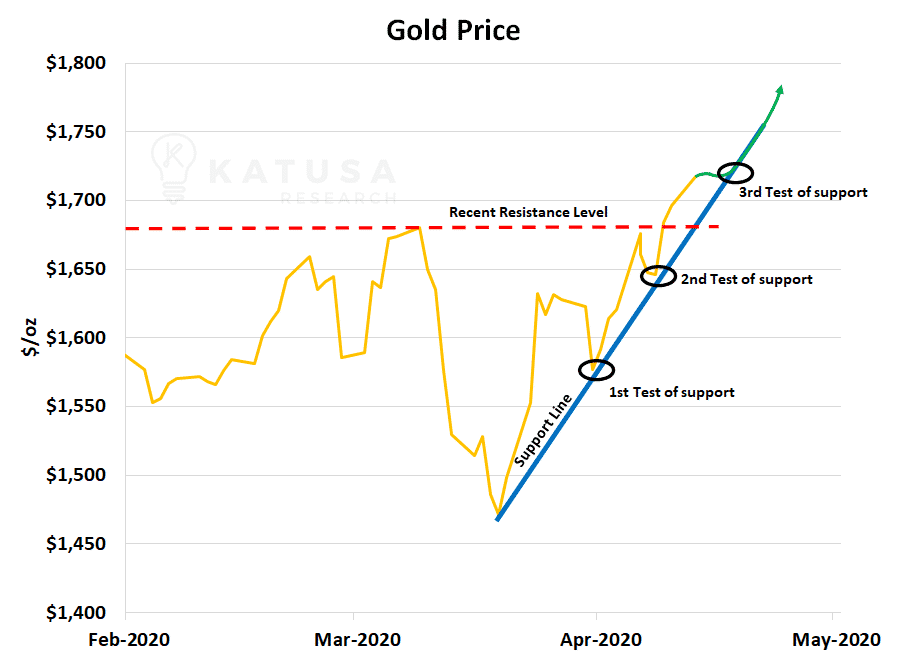
The line has been tested twice already and is shaping up to get tested a 3rd time.
If this forming trend continues the gold price will rise even further. If not, it may fall into the cup and handle formation shown earlier.
The next 90 days will be incredibly exciting and important to the price of gold.
The Importance of the Gold Forward Offered Rate (GOFO) and Lease Rates
What is the GOFO rate?
In simple terms, its the rate brokers in the London Bullion Market are willing to swap physical gold for U.S. Dollars at a future date.
The future date is anywhere from one month to a year later.
- The GOFO rate is used as a benchmark to determine whether the cost of carrying gold is negative (backwardation) or positive (contango).
This is an alternative measure to the spread between gold futures contracts and the spot price.
In contango, theres a lack of liquidity in the gold bullion markets. This often leads to a huge rally in physical gold prices due to arbitrage. And weve been at extreme contango levels the past 2 weeks.
Unfortunately, the LBMA stopped publishing this data back in 2015.
So instead, we look at the Implied Gold Lease Rates which is the cost of storing gold in a bonded and secured vault.
These vaults are same ones which are approved by the CME or the London Metals Exchange for storage and settlement of futures contracts.
As you can see in the chart below, gold lease rates are nearly all negative for maturities under 12 months. Heres what that means
- These gold owners must pay out of pocket for the privilege of letting banks use their gold as collateral in order to lend money to other firms.

This is comparable to an incident at a Danish bank where, for the first time in history, they issued covered bonds with a negative coupon.
That means bond holders had to pay interest to debtors for the privilege of lending them money.
In fact, the short-term gold lease rate went below -5% at one point.
The Coronavirus made it impossible to deliver gold bullion between London and New York.
There were 2 main factors:
- Commercial flights were cancelled, and this is how gold is typically transported.
- The closing down of Swiss refineries, which is where the 400 oz. gold bars traded on the London markets are recast into 100 oz. bars in order to meet the specifications of COMEX gold contracts.
Mine Shutdowns and Offline Gold Production
Our current count indicates that 338 mining operations have been shut down worldwide due to COVID-19.
Ramping up production cannot happen overnight and it can take mines as long as 21 days to resume full production.
To date, 115 gold mines are still offline down from 122 last week.
The chart below shows that 7 gold producing mines will be back online this week.

At least 23 gold producers have suspended their 2020 guidance due to anticipated or actual disruptions to their mining projects.
To date, 115 gold mines are still offline. Last year, those mines produced 12.6 million oz. of gold.
- For companies that issued guidance for 2020: thats 6.8 million oz. of annual production offline.

Bear in mind that while these numbers understate the true amount of gold production thats currently offline, only a fraction of those 6.8 million ounces is likely to remain a production deficit for 2020.
We expect many of these mines to be back online before the second half of 2020, but not without hiccups (remember the Yugoslavian mines I mentioned last week?)
Its difficult to forecast how high the gold production deficit will be for each mine that comes back online it could be anywhere from 50% to as low as 1%.
The implications will be different for each gold miner, but unlikely to move the price of gold either way.
Gold isnt rising because of the mine shutdowns. Gold is rising because its a proven safe haven in uncertain times.
But dont get caught paying through the nose for gold stocks
Many gold royalty companies and gold producers are trading at over 200% above their Net Asset Value.
Gold will do well, but dont overpay.
Regards,
Marin
P.S. I just sent members of Katusas Resource Opportunities an alert on How to Prepare for a Possible Gold Price Shock. Weve uncovered some gold market anomalies that present 2 scenarios where gold is heading and how to prepare your positions. If youre not yet a member click here to learn more.
| Digg This Article
-- Published: Friday, 17 April 2020 | E-Mail | Print | Source: GoldSeek.com


