The pandemic has morphed into an economic crisis far greater than the Great Recession of 2008, because major Western governments response to the coronavirus was late, especially in the U.S. where cases have now topped one million and deaths have now well exceeded those of the Vietnam War.
Niall Ferguson, Scottish-born historian, senior fellow at the Hoover Institute, former professor at Harvard University and NYU, author Civilization: The West and the Rest and others; b. 1964
We have it totally under control. Its one person coming in from China, and we have it under control. Its going to be just fine.
Donald Trump, 45th President of the U.S.A. 2017, businessman, television personality, interview CNBC January 22, 2020; b. 1946
Listen to me, if we break quarantine, we could all die.
Ripley, played by Sigourney Weaver in Alien, 1979
Powell warns; Fauci cautions; Trump frets. Speaking on Wednesday, Fed Chair Jerome Powell warned that the economic risks from the coronavirus were significant. The stock market fell 600 points (Dow Jones Industrials (DJI)). But the day before, Trumps health advisor Dr. Anthony Fauci, speaking before the Senate, warned that if cities, states or what have you prematurely open up, without having the capability of being able to respond effectively and efficiently, my concern is we will start to see little spikes that might turn into outbreaks." The DJI fell almost 500 points. Poll numbers show that most Americans agree with Fauci. Poll numbers are also suggesting that Trump could lose in November.
So, Trump frets and claims that coronavirus rates are coming down in most parts of the country and the country wants to be open and get going again. However, cases have risen where reopening took place too quickly. Yet he insists that we have prevailed on testing and suggests anyone could get a test, all of which proved false. Yet poll after poll shows disapproval for his handling of the crisis, claiming not enough is being done, and shows support for lockdowns despite vociferous and sometimes violent objections. The DJI fell another 500 points. Trump attacked Faucis comments as unacceptable. Trump is pressuring Powell to move to negative interest rates.
That the pandemic has become highly politicized should not be a surprise. Shutting down the economy was controversial right from the start and was sure to trigger both pro and con responses. Chinas command economy made it easy to shut down Wuhan and other parts of the Chinese economy quite easily, even if they were slow to react, including trying initially to keep it under wraps. The slow reaction of the Western economies to the growing pandemic compounded the number of cases and deaths, sending them to unacceptable levels and threatening to overwhelm the health care systems.
Others like Taiwan and Vietnam took action right away with tracking and tracing, testing, and temperature-taking and quickly shutting their borders. The result is, Taiwan and Vietnam remain relatively unscathed. However, both Taiwan and Vietnam stopped short of completely shutting down their economy as China did and took action that was not dissimilar to Chinas, using methods that resulted in the people giving up some freedoms and privacy that might not be acceptable in the Western economies.
There is no easy answer. But the economic impact in the Western economies is stunning. With another 3.0 million initial claims in the U.S. announced on May 14, 2020, the eight-week total is now 36.5 million. Thats at least one-quarter of the entire U.S. labour force. Some 80% were listed as temporary but according to studies, the reality is that upwards of 45% of them could be permanent. Some $6 trillion has been thrown at the COVID-19 crisis in the U.S. and at least $250 billion here in Canada as well, with some studies suggesting it could reach $1 trillion. The numbers are astounding. The fiscal disbursements are not meant to grow the economy, they are meant to try to keep things from completely collapsing. There is already clamoring for austerity measures to combat the growing debt. Austerity measures at this time would only deepen the crisis.
The politicization of the pandemic doesnt stop with those in favour and those opposed to the shutting down of the economy. It has now highlighted by the bitter fight between the U.S. and China over who to blame for the pandemic. Each side accuses the other with little offered in the way of proof. Lawsuits that have no chance of success have been launched against China. Seizure of assets in one country leads to seizure of assets in the other country and on that basis the U.S. has more to lose than China. There are threats emanating from the U.S. that they might tear up the trade deal. The world is not well served with these two economic behemoths going at each other, especially given the dependence each has on the other. The formula was simpleChina produced the goods, the U.S. purchased the goods, and in return China purchased U.S. debt by buying U.S. treasuries. The Chinese even tied their currency (yuan) to the U.S. dollar.
But the relationship has broken down and that ultimately is dangerous. Trade became a bone of contention. It goes beyond trade to who is the most powerful to project global influence. Each stalks the other militarily with U.S. warships in the South China Sea while China spreads its military power through the region and elsewhere. The U.S. wants to stop the Belt and Road (BRI) initiative. History is rife with great power economic conflicts that have ended in war. In the late 18th/early 19th century, it was the British Empire, France, Prussia, Russia, and Austria. Later in the 19th/early 20th century: the British Empire, Austria-Hungary, France, Russia, Germany, Japan, and U.S.A. In the mid 20th century: U.S.A., United Kingdom, Germany, Japan, Soviet Union, China. And in the late 20th/early 21st century: U.S.A., China, Russia, Japan, Germany, France, United Kingdom. Global wars were a common element throughout. Today it is cold wars, but could that become a real war? The last time the world split into warring camps like this we had two world wars and a depression. Does history repeat itself? Or merely rhyme?
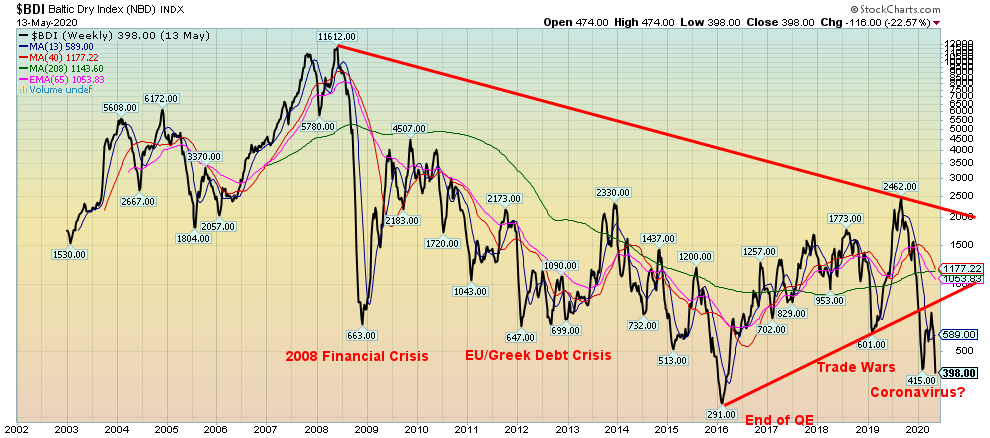
Given all the tensions, it is no surprise that world trade is collapsing and, with it, globalization. As The Economist laments, the open system of trade that dominated the world economy for decades has been damaged by the financial crash and the Sino-American trade war. World trade may sink 1030% in 2020 on top of what has fallen over the past several years. It was noted that South Koreas exports have collapsed 46% year over year in May. The head of the World Trade Organization (WTO) has suddenly resigned, reflecting the uncertainty over the survivability of the organization, primarily due to open fights with the U.S.A. The WTO is on its knees and may soon cease to exist. That would toss us back into the beggar thy neighbour policies of the 1930s that helped deepen the Great Depression. Countries like Canada, caught between the great powers and dependent on exports, could be devastated. The Baltic Dry Index (shown below) has plunged under 400 and appears headed lower, reflecting the collapse in world trade.
A wave of bankruptcies is about to descend on us. You will get business failures on a grand scaleso declared James Bullard, president of the Federal Reserve of St. Louis, on May 12. Firms big, medium, and small are on the bubble. It is the small firms that employ the most people. Already we are faced with a wave of bankruptcies or companies about to go bankrupt: Nieman Marcus, Hertz, J. Crew, J.C. Penney, Chesapeake Energy (and a huge chunk of the shale industryits estimated that 65% of the energy sector has distressed debt) plus numerous firms that are too broke to declare bankruptcy and will just vacate their premises. On the small scale, it is estimated that 50% or more of restaurants here in Toronto could be gone by June. Thousands of households could default on their mortgages. Multiply that around the world. The expectation is already growing that debt default and bankruptcy will far surpass anything seen at the height of financial crisis of 20072009.
And bankruptcy could include U.S. states, municipalities, transit systems, universities. Here in Toronto the Toronto Transit Commission (TTC) is estimated to be out over $500 million by September as ridership has plunged. It is not likely to come back any time soon as more people work from home and more are out of work, and as well more people who dont wish to ride public transit until there is a vaccine. The City of Toronto has also expressed concern over mounting expenses and will need a bailout from the province or the federal government to survive.
Universities are facing falling enrolment, especially international students who made up a good piece of their revenue, having to revamp courses for online, and facing the loss of multitudes of fees that make university and college the experience it is. There is no word on how they are going to make up the difference and many, especially smaller ones, could face permanent closure. For students, it presents a major dilemma in what is one of the most important decisions they will ever make. Professional sports too are in turmoil. This is a multi-billion-dollar industry that includes the TV networks. The losses could be staggering threatening the very viability of the leagues including individual franchises. Despite their efforts to re-open without fans all it would take is one case and the whole thing would be shut-down again. Minor league pro sports is being devastated.
As well, one mustnt overlook the potential for a wave of sovereign defaults. Already on record needing debt relief are Argentina, South Africa, Iraq, Venezuela, Zambia, Lebanon, and Nigeria. There are many others. There are already numerous poor countries, particularly in Africa, in severe financial distress, spending more on debt repayments than on fighting the COVID-19. The fear is that if countries collapse, there is a spike in wars, disease, and refugees that could soon become overwhelming. But, like so many other bankruptcies, it feeds on itself. Debt collapse, bankruptcy, lowered demand leading to more failures and bankruptcies and job losses and inevitably to more violence and revolts. It doesnt matter whether it is countries, companies, or consumers (people). The end result is the same. And along with it is the rise in authoritarian governments. Political extremes go from left to right, from communism/anarchists to fascism/neo-Nazism. Both seek someone to blame; hence, a rise as well of xenophobia.
One of the hardest hit areas is tourism. Airlines, hotels, restaurants, museums, cruise lines, Airbnb, and more are all negatively impacted. Tourism makes up some 10% of global GDP. It is estimated it provides 1 in 10 jobs. For some countries it makes up a significant portion of their GDP, particularly some Caribbean islands where it can constitute upwards of 90% of their GDP. Airlines have seen their bookings decline upwards of 90%. Even if the economies were to open up, their expectations are that bookings would still be down 75% and take more than a few years to recover to 2019 levels.
Besides the Caribbean islands and many other island nations around the world, the regions that receive the highest number of tourists are Europe (51%) with an estimated 27 million working in the tourism industry or its ancillaries, Asia Pacific (25%), the Americas (15%), Africa (5%), and the Middle East (4%). To open up things again, the easing of border controls is paramount. As well, it will require international co-operation. The question is: will travelers return? Polls indicate it could be extremely slow and we would most likely need a global vaccine to bring the numbers back to anything resembling 2019. Overall, it is estimated that, globally, upwards of 100 million workers could lose their jobs permanently, costing the global economy at least $2.7 trillion.
Against this increasingly bleak background that is now beginning to resemble a new Great Depression, we have those that believe the stock market is highly vulnerable to further declines and those who believe, yes, it might pull back but it is headed for new record highs.
The bulls appear to be trying to look past the shutdowns that have been imposed. They look for the time when people return to work and things start to gear up again. They also look at the trillions going into the market as a result of bailouts, support programs, and bond buybacks. All this money has to go somewhere and funds for buybacks are not just going to sit on bank balance sheets and not be put to work. Except, as was the case after the 2008 financial crisis, it wont be going into Main Street; it will be going into Wall Street. Low bond yields and the potential for recovery in corporate earnings will drive them into the equity markets seeking higher returns. And that in turn will drive stock markets to record highs. As for the other 90% Main Street, well, the funds received will help keep them in place until they return to work, if they return to work. The money they receive will be spent. Yes, some, even many, will go bankrupt but others will come in to replace them. Maybe not a V-shaped recovery but instead a good U-shaped recovery. The mantra is the Fed has your back.And, we might add, Trump wants to be re-elected.
But the bears see it differently. They describe a V-shaped recovery or even a U-shaped recovery as fantasy island.Pandemics are rarely one and done. They come in waves. Historically, they have often been seen in three waves with the second wave as the deadliest. Unless a vaccine is found it is highly unlikely that the economy will be able to open up to return, even remotely, to where it was, despite the pleadings and even confrontational efforts of those who want it opened up now. The reopening is an experiment to see how it goes. Wisconsin, it appears, has become the testing ground following a court ruling that said businesses can re-open. But even that, as they have discovered, can vary from county to county. If it goes well, then the calls to reopen will intensify. But if cases and deaths spike, there will be questions to answer.
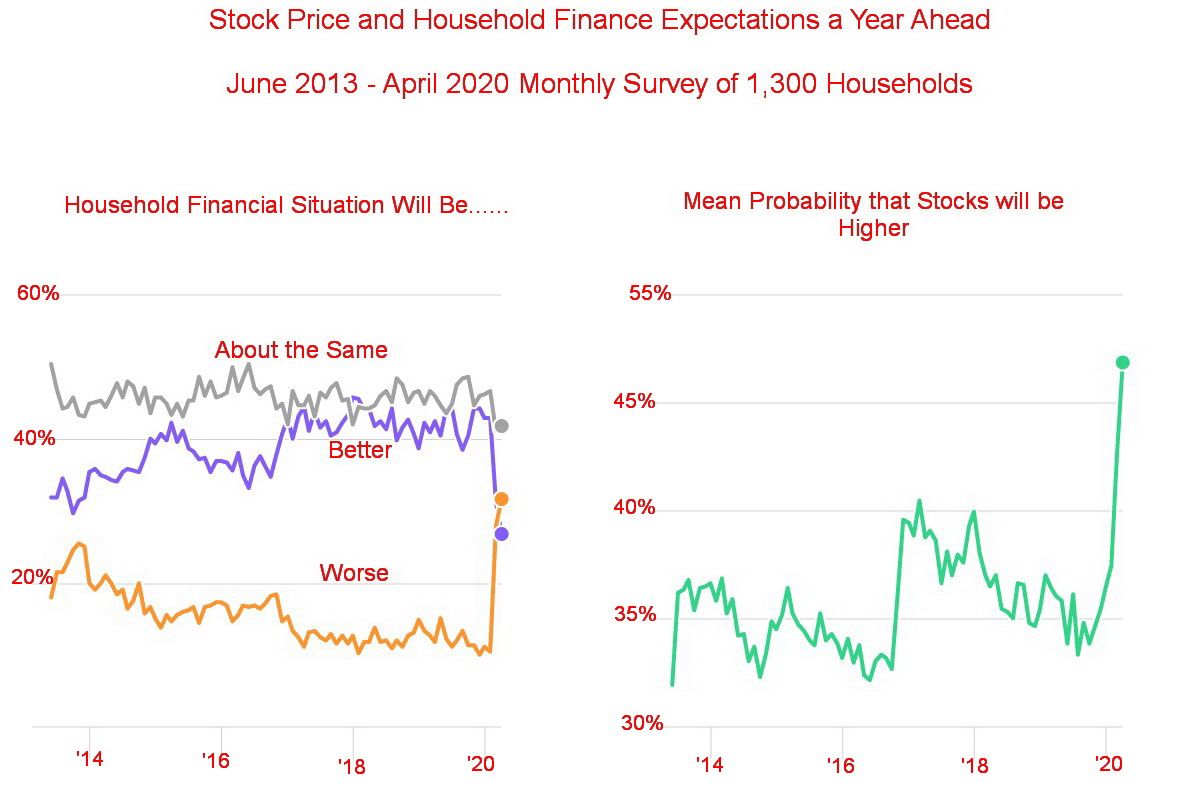
The bull case ended with the collapse in March. The rebound has been a classic bear market rally. Bizarrely, according to a poll some 52% of respondents think stocks will be higher a year from now, the best seen in years. This, despite a backdrop where they see their financial situation deepening. The expectation is that home prices will also fall, especially with lenders tightening credit, and that loan delinquencies and defaults will rise. This also translates into fear of job loss, something that has been taking place with regularity over the past several weeks. This particular survey was started in 2013 and has continued until today.
Other things the bears cite as reasons the stock market rebound is probably living on borrowed time include a sharp jump in funds in money market accounts, a sharply rising savings rate that hit 13.1%, the highest seen since November 1981, and massive outflows out of equity funds the past two months ($1.1 trillion over the past 12 months, flowing mostly into money market and bond funds). All this is happening against a backdrop of deteriorating domestic and global uncertainty, rising bank loan losses and bankruptcies, rising dividend cuts, and the lack of stock buybacks from corporations going forward. Goldman Sachs expects that corporations will post zero earnings in 2020 because of the coronavirus. That could also carry over into 2021, especially if a second wave hits.
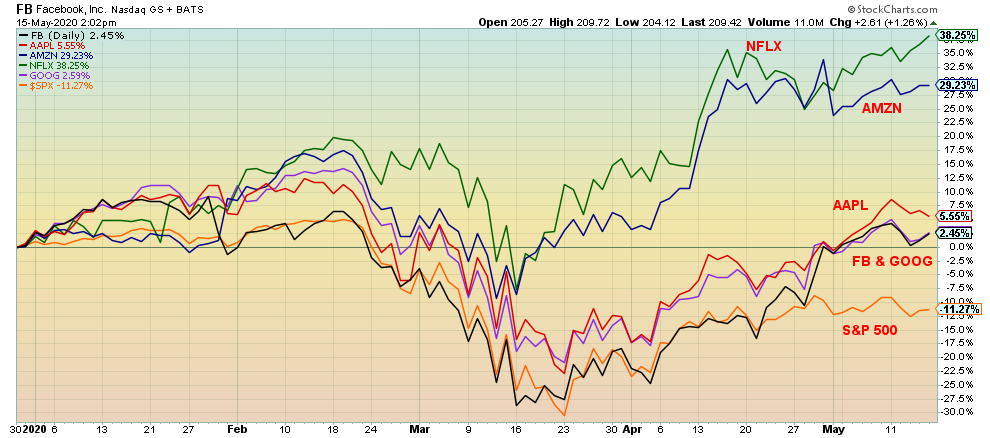
Yes, the March low was a great speculative buy. But one needs to keep in mind that this rally has been largely predicated on the FAANGs (Facebook, Apple, Amazon, Netflix, Alphabet (Google)). Currently, they constitute roughly 20% of the S&P 500. Here is the performance of the group since the beginning of the year. Right now, the only one that is down on the year is the S&P 500. Translation: it is the other 495 stocks that have kept the index down. Without the big five where would it be?
The argument over whether the bulls or the bears are right wont be decided here. That is why we rely on the technicals in markets like this as fundamentals may be suspect and misleading. But one thing has been clear since this market got under it is that gold is the key sector that is rising. Gold remains the canary in the coal mine, effectively saying the financial system has serious systemic issues that are not going to be fixed overnight. All the COVID-19 is doing is revealing the systemic weakness that already exists in the economy and the financial system. The chickens, as they say, have come home to roost. Or is it Humpty Dumpty (the economy) had a great fall, and all the Kings horses (the Fed) and all the Kings men (the Treasury) couldnt put Humpty Dumpty together again.
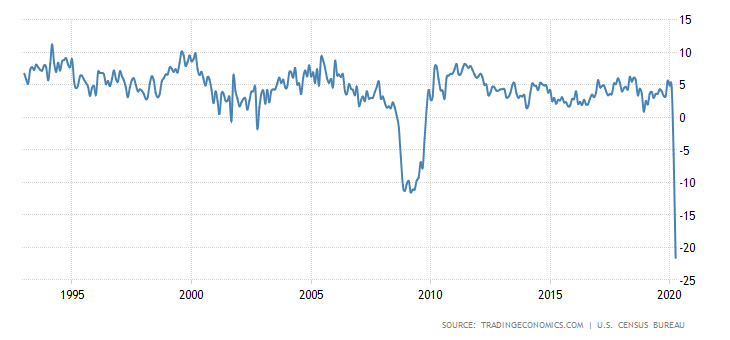
Two charts showing the deteriorating state of the U.S. economy. Yes, it can bounce back, but this is now. Well see if next month improves. The 2008 financial crisis saw what appears to be a V recovery for both. But can this be compared? 2008 was a financial crisis where they threw billions at it in lower interest rates, bailouts, and QE. But pandemics are not the same as a financial crisis. The pandemic triggered the financial crisis and the subsequent collapse in the economy. Pandemics linger, mutate, and come and go in waves. So the V recovery (or at least a U recovery) seen in 2008 is most likely not in the cards this time around.
April 2020 saw a record drop in retail sales. With everyone under lockdown and businesses closed, retail sales plummetted. The drop of 21.6% year-over-year was well above the expected decline of 16.3%. It is subject to revisions. March was revised to down 5.7% from down 6.2%. If things are opening up, then one might expect May to be somewhat better. But will it be positive? Not likely.
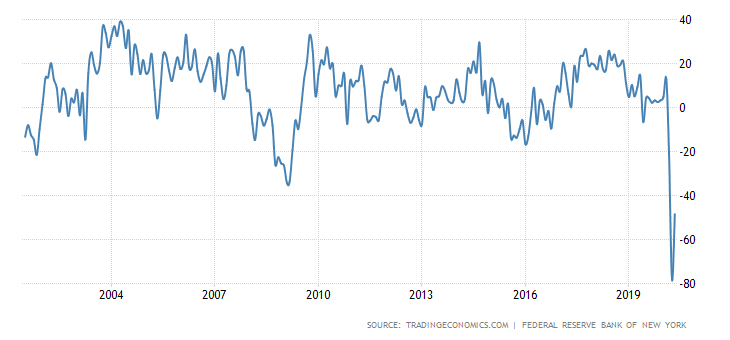
The NY Empire State Manufacturing Index is a measure of manufacturing in the state of New York. It actually rose to negative 48.5 in May from the huge hit in April of negative 78.2.It was well above market expectations of negative 63.5. The expectation is that June might show further improvement. But will it turn posiitve? The index plunged below the lows seen during the 2008 financial crisis. Firms were optimistic that things should be better six months from now. But, as we have noted, our expectations are that this will linger for some time.
Despite opening up the economy, the stock market is now fearing that cases and deaths could rise if they open too soon. That in turn could result in another shutdown. The U.S. remains a hodge podge of openings, ranging from the court-ordered opening-up in Wisconsin to New York remaining largely under lockdown. As well, the U.S./China feud is heating up again over who is at fault for the COVID-19, along with renewed trade tensions triggered primarily by the U.S. and military maneuvres again triggered primmarily by the U.S. The result of all this: uncertainty sent stock markets lower this past week. The S&P 500 fell 2.3%, the Dow Jones Industrials (DJI) was off 2.7%, the Dow Jones Transportations (DJT) dropped 6.9% and is looking increasingly bearish, while the NASDAQ continues to perform comparatively well, falling only 1.2%. The S&P 600 (small cap) was leading the way, down 7.6%. That was a bearish sign.
Here in Canada, the TSX Composite fell 2.1% but the TSX Venture Exchange (CDNX) was a star, rising 3.4%. It continues its hot hand, dominated as it is by the junior mining stocks that have started what could be a strong upward tear. Overseas, the London FTSE lost 2.2%, the Paris CAC 40 dropped 5.0%, the German Dax was off 2.8%, the MSCI World Index dropped 3.3%, Chinas Shanghai Index (SSEC) was off 0.1%, and the Tokyo Nikkei Dow (TKN) was a star, up 1.8%.
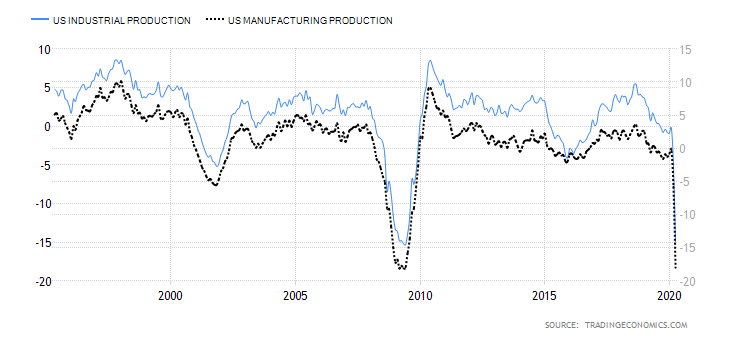
Fed Chair Jerome Powell warned that equities could face a significant hit if the crisis deepens. Health guru Fauci warned about the dangers of opening too soon. Bankruptcies are starting to rise significantly. Malls are empty. Retail sales plunged and factory output fell sharply. Industrial production plunged 16.4% in April to a new record. Manufacturing production plunged 18% in April. Both plunged down to levels last seen during the 2008 financial crisis. And this crisis is still in its infancy. Unemployment is in the stratosphere. Combine all this with a rising savings rate, attempts to pay down loans (if they can), the fear of the coronavirus that keeps people cautious, and the likelihood of a sharp rise in the stock market anytime soon seems fanciful. Oddly enough, against this backdrop the Michigan Consumer Sentiment Index actually went up slightly to 73.7 from 71.8. Maybe some were taking the openings or the potential for openings to heart.
The most telling was the huge drop in retail sales this past month. The consumer is 70% of the economy, and if the consumer isnt spending then it impacts just about everything. Grocers will do fine. But as to many othersnot so well. And that is why there is a belief that upwards of 45% of the unemployment is not coming back at all. That has huge ramifications going forward and could move us from a recession to a depression.
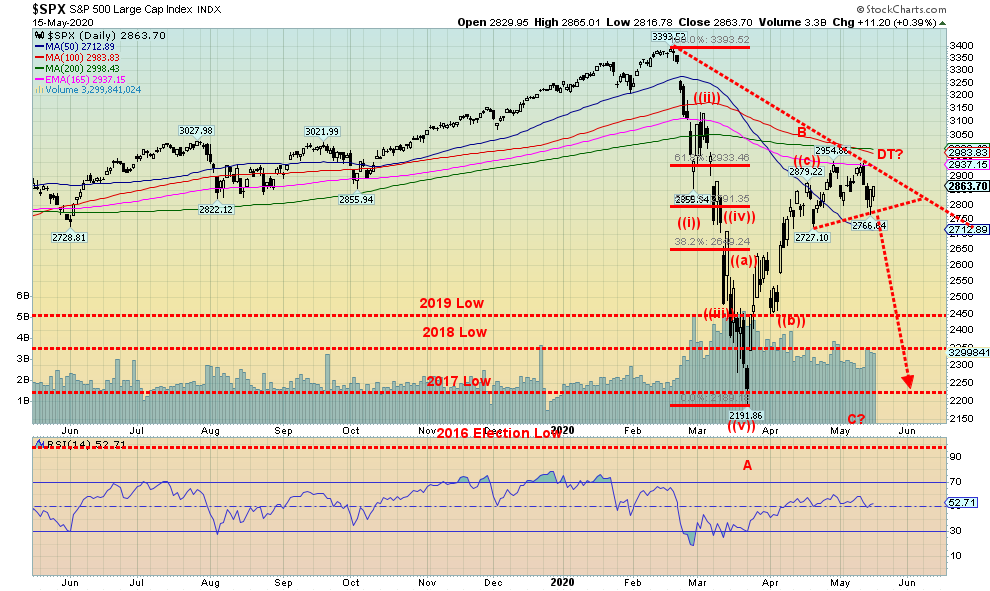
The S&P 500 appears to be forming a double top. The index has failed to regain the 200-day MA, currently near 3,000. Bear market rallies typically rally back to the 200-day MA or maybe slightly above it before plunging again. A break of 2,770 would bust the double top and project down to targets at 2,580. A break below 2,480 would set up a test of the March low and possibly new lows. Only regaining and making new highs above 2,950 might alter this bearish scenario. We are in a bear market. And the first good rebound rally is, we suspect, coming to an end.
The bulls great hope. Oodles of liquidity supplied by the Federal Reserve through QE and interest rates at zero for a long time. Bond yields are also quite low, making borrowing cheap and investing in higher yielding stocks that pay dividends inviting. That works as long as the stock market doesnt fall. We read an interesting article about global equity strategist Andrew Garthwaite of Credit Suisse and his call that following another corrective move to the downside a huge bubble rally will get underway that takes us to new all-time highs. The article can be found here:https://www.theglobeandmail.com/investing/markets/inside-the-market/article-low-rates-to-drive-new-equity-market-bubble-to-rival-the-late-1990s/#comments
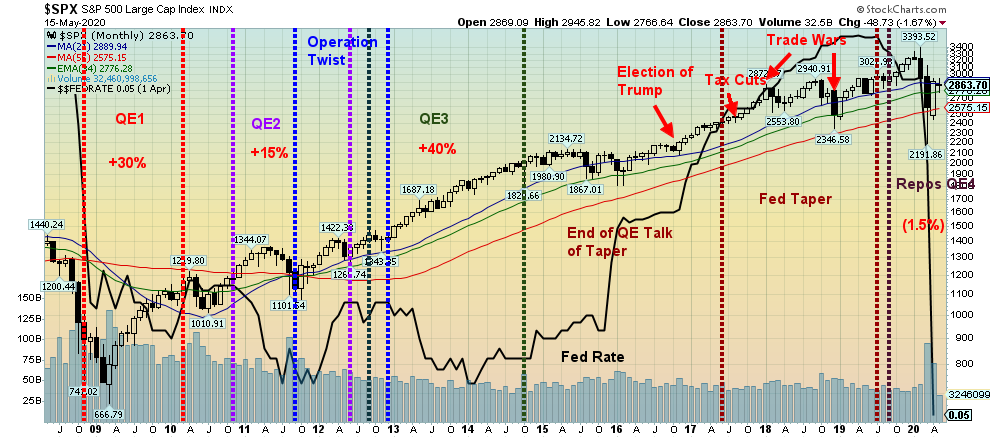
Above is a chart of the S&P 500. We have marked on it the periods of QE1, 2, and 3 along with Operation Twist and the great taper. The S&P 500 rose 30% under QE1, 15% under QE2 (hindered by the EU/Greek crisis), and 40% under QE3. The election of Trump and the Trump tax cuts spurred the market despite the Fed taper, but when the trade wars with China broke out the markets fell. QE4 hasnt done much since the S&P 500 is down roughly 1.5% since the repos and QE4 got underway in September 2019. Who knows? Maybe QE4 will do its magic like QE1, 2, and 3 and the markets will soar once again, especially against the backdrop of zero percent interest rates. Okay, thats just the Fed rate and not the rate to actually borrow in the market. If anything, banks are tightening their credit and the market is putting a higher premium spread on corporations raising funds as well. We dont deny that once we get our C wave down out of the way we could soar to new highs in what will be the Big B wave up. The question is, what will our C wave down look like? Shallow testing the March lows, new lows below the March lows but not significantly or the Great Depression C wave that just went down, down, down, and then down again.
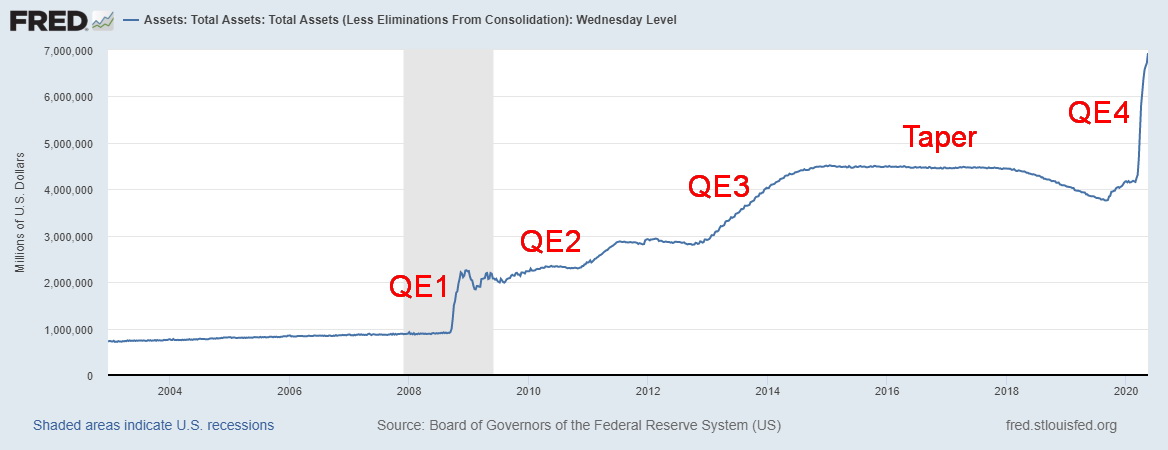
The Fed balance sheet continues to grow, and grow, and grow The Fed balance sheet has almost doubled from the low seen in late August 2019. It is up $3.175 trillion. On August 28, 2019 it stood at $3.761 trillion. Now it is at $6.934 trillion and rising. One can see the growth under each of the QE scenarios since the start of QE1 in November 2008. QE4 has turned into the mother of all QEs, paling all the others. QE1, 2, and 3 added $3.590 trillion. QE4 is quickly catching up, equaling all the other QEs put together. We might also call this how to monetize the debt. Can the Fed purchase everything? Well, we dont know as it has never happened before. We are, as they say, in unknown territory. All sorts of dire predictions are being seen and any one of them is possible. The Feds purchasing treasuries means it just disappears into the Fed balance sheet. We do note that bank reserves have jumped $1.5 trillion in the same time period, so a lot of the funds used to purchase bonds from the banks are remaining with the Fed as reserves. Where does the rest go? Well, quite possibly into the stock market. It certainly doesnt go out in loans to Main Street as the banks have sharply curtailed credit, worried as they are over loan losses.
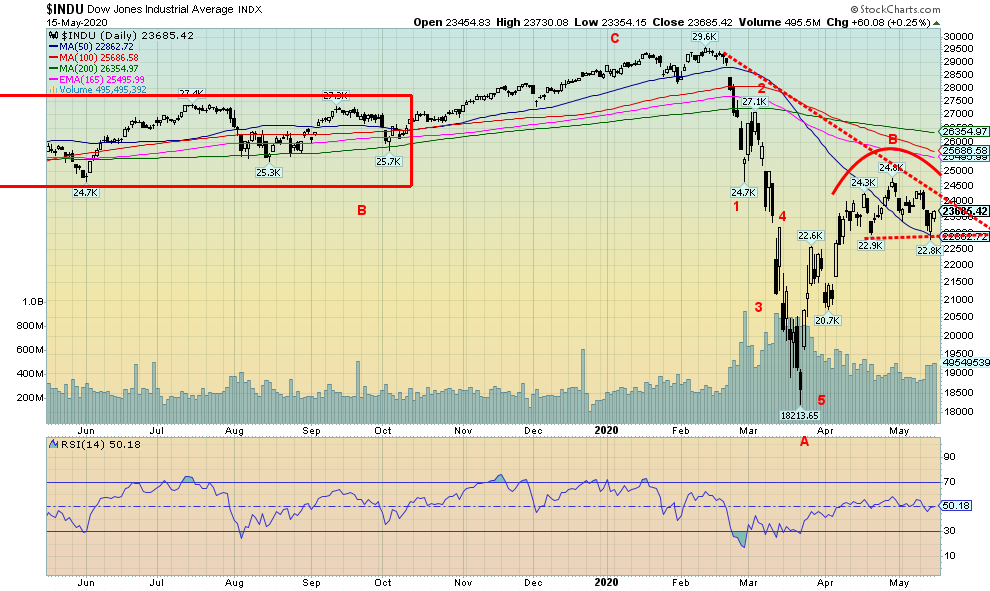
The DJI looks vulnerable to a downside break as well. It could be a small head and shoulders top forming. If so, the neckline can be seen at 22,900 and could project down to targets at 20,900. A break below 20,700 could set up a test of the lows and even new lows. The DJI has remained well below its 200-day MA (currently at 26,354), so there is no thought here that we are in a bull market. All this is, is a bear market rally. That being said, as we noted previously, this wave down which could bottom into June or July should then see a possible sharp move to the upside. But we need to get this low out of the way first. Only new highs above 25,000 could change this scenario.
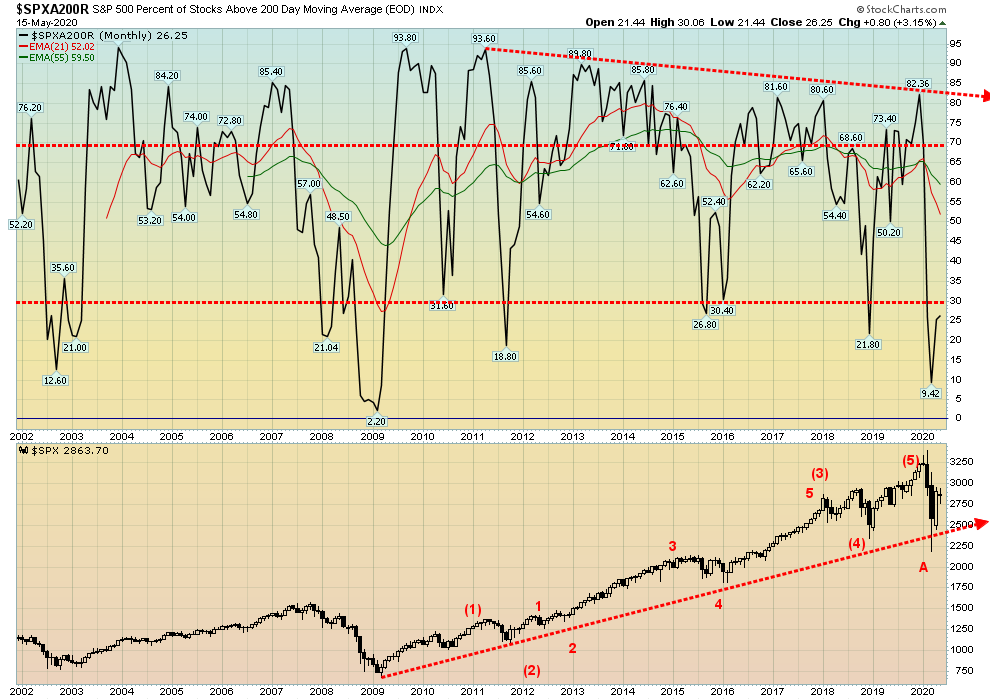
Given that the S&P 500 itself is not over its 200-day MA, it should not be a surprise that the percentage of stocks in the S&P 500 above their 200-day MA is not exactly robust. Only 25% are holding above that key MA. The other 75% are below the 200-day MA including, as we note, the S&P 500. As long as we remain under the 200-day MA we cannot say we are in bull market. Failures in bear markets are often seen following a low a run-up to the 200-day MA. But usually if the bear is right the market fails to establish itself over the key MA. Usually it fails and falls back towards the lows. Another break this time of 2,500 for the S&P 500 could be terminal.
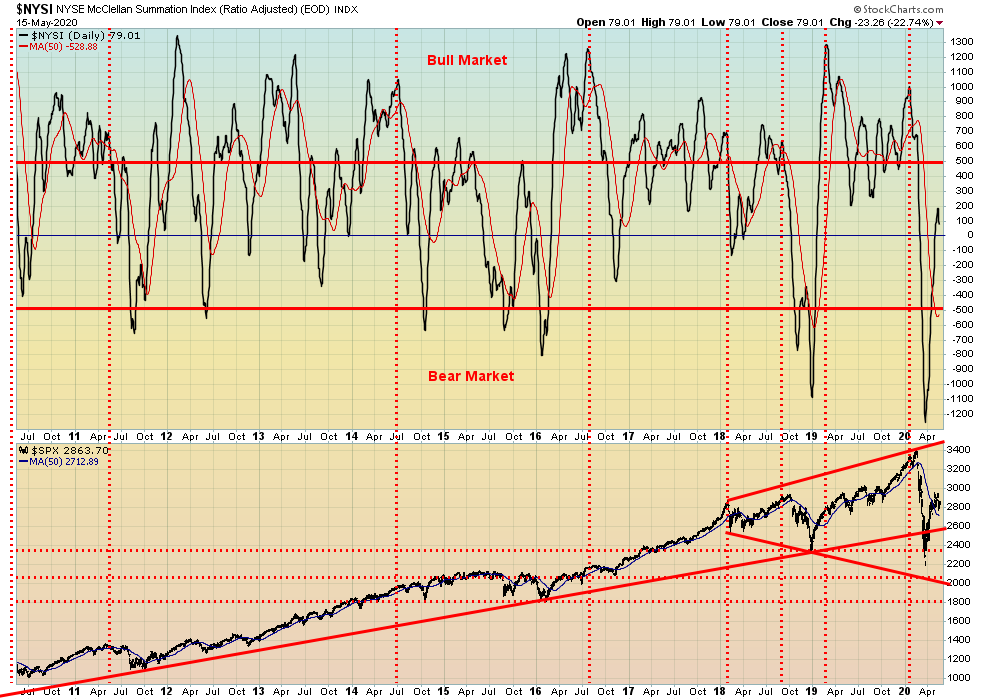
Our favourite indicator, the McClellan Summation Index ratio-adjusted (RASI), remains around 100. We do not consider that overly bullish and it argues for an impending drop in the market. At 100 it is neutral. Over 500 it is bullish and under -500 it is bearish. Usually if it climbs over 500 early in the rise from a significant low it is quite bullish. We saw that out of the 2018 low when the RASI quickly rose over 500 and the rise to new all-time highs was underway. This time it hasnt and we consider that a huge cautionary note.
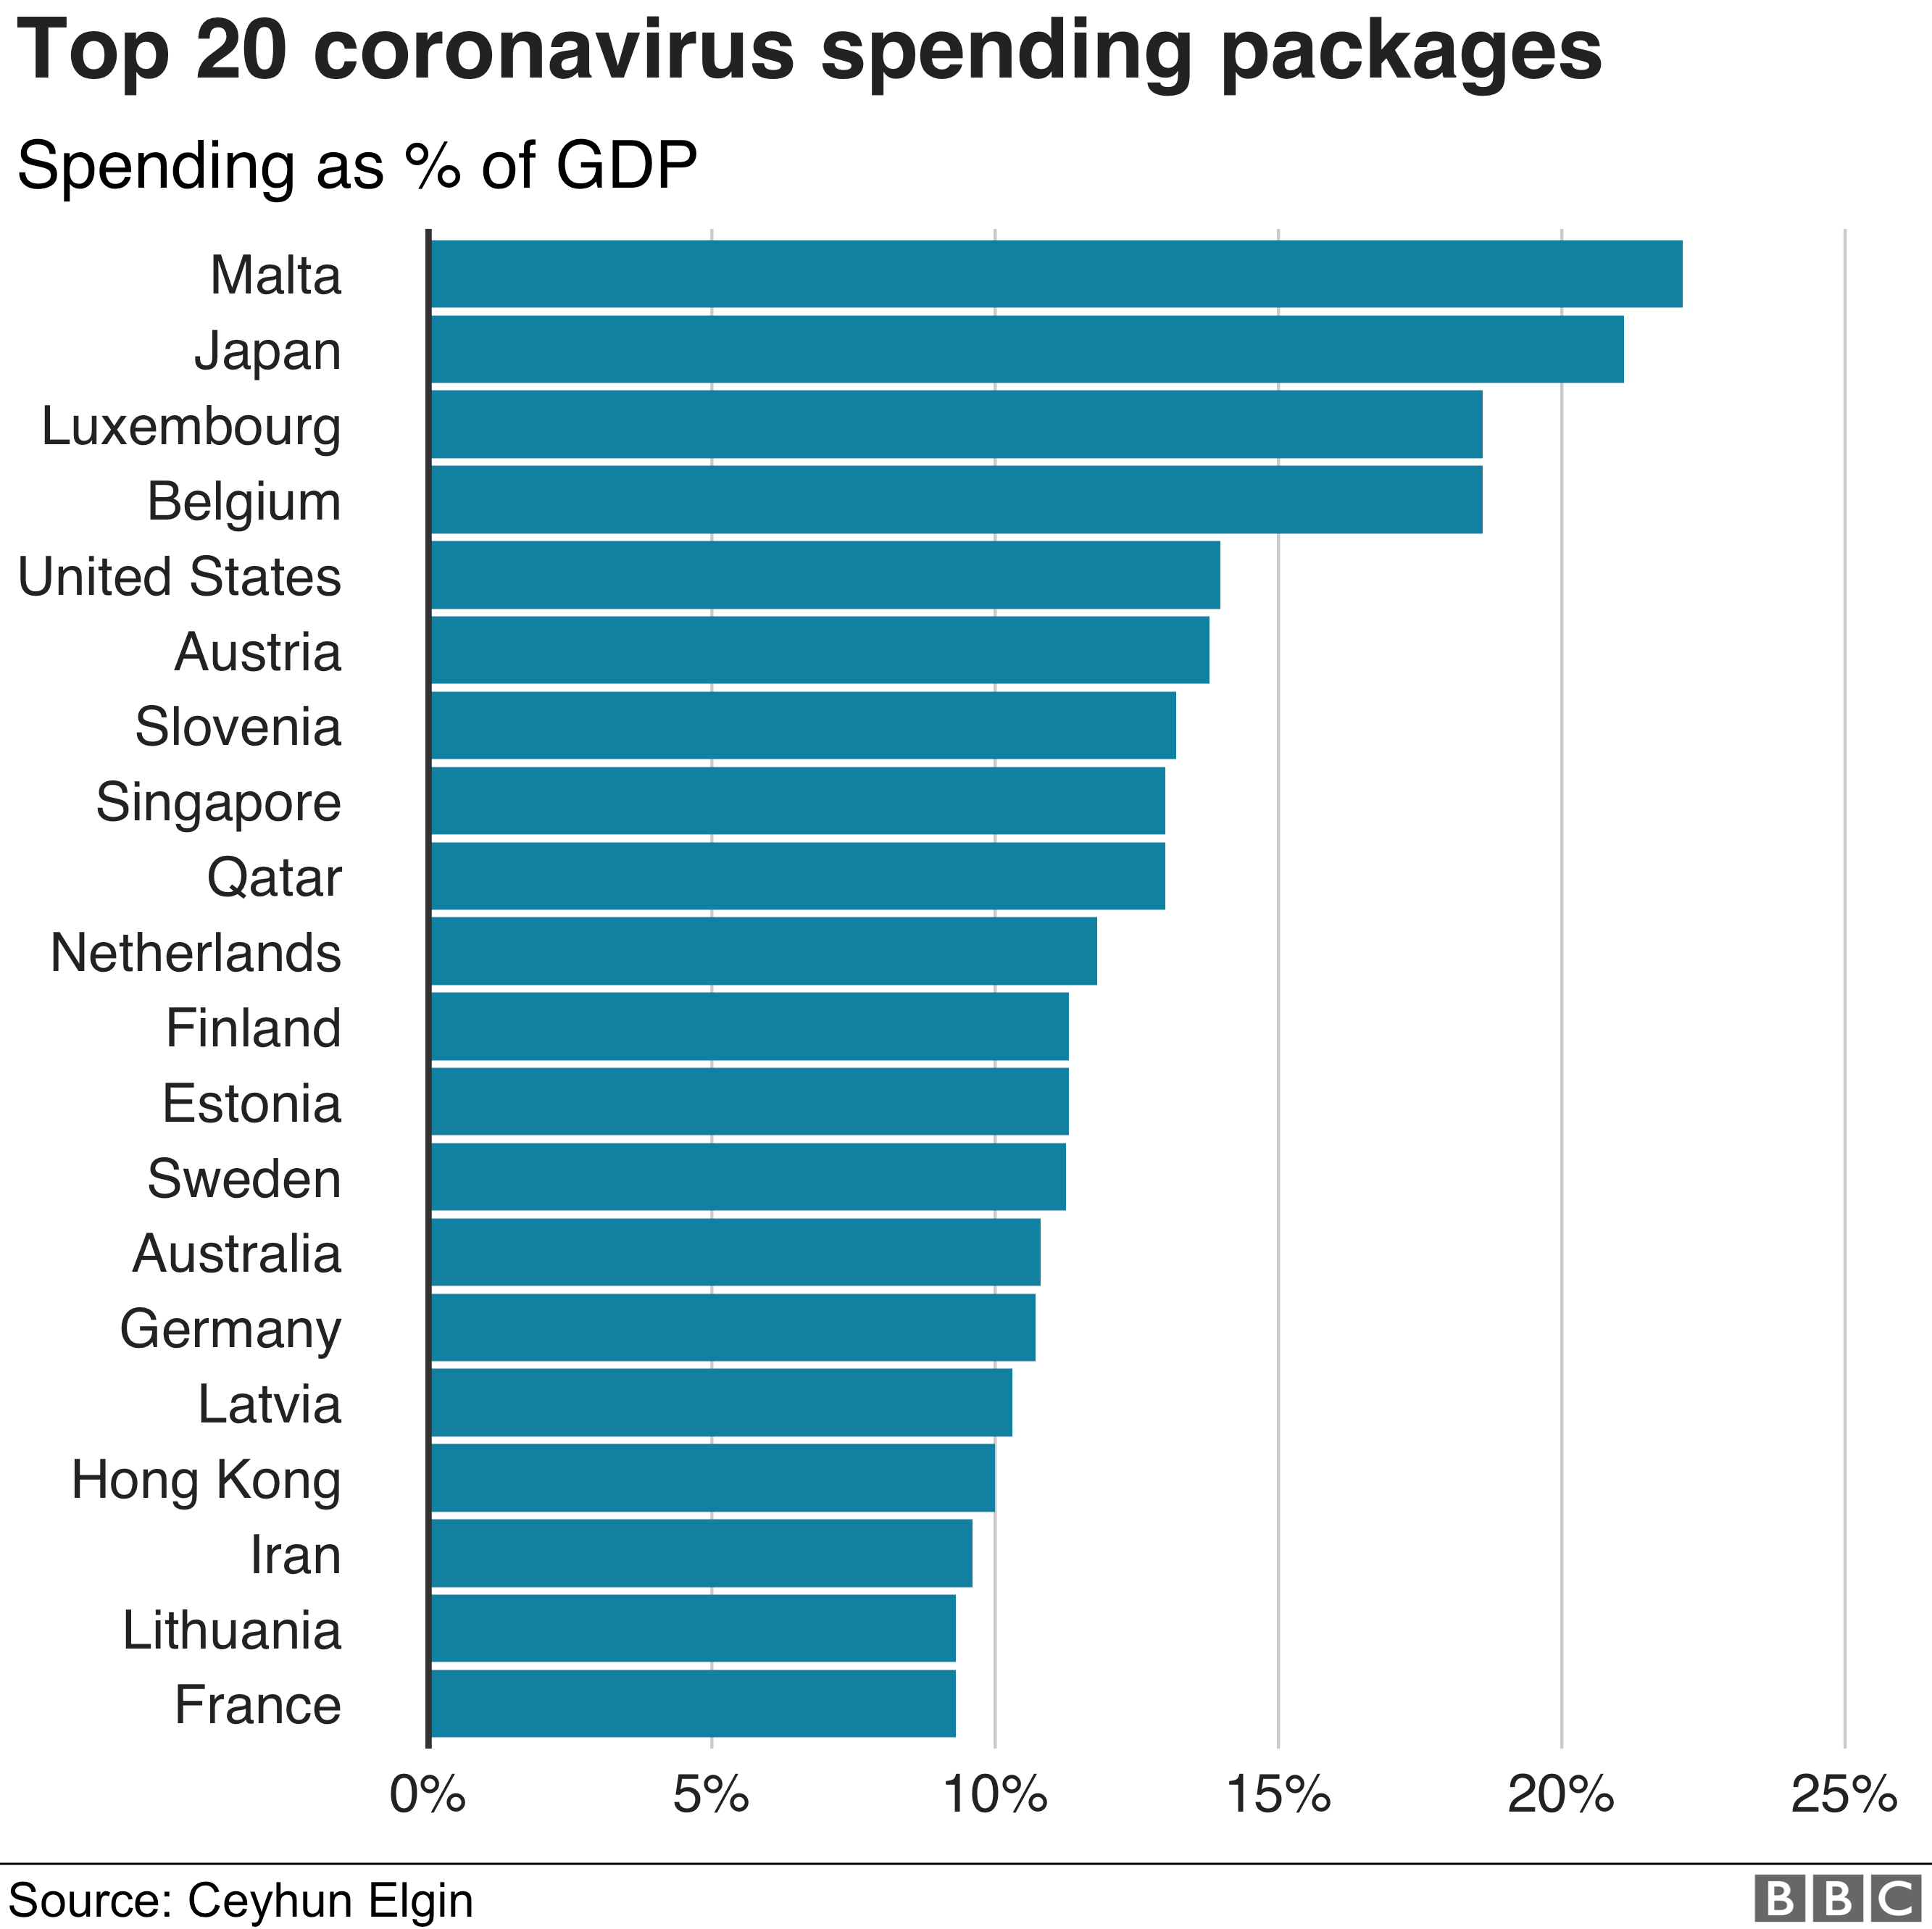
Given the massive amounts of stimulus money being tossed around, we found this chart of the top 20 coronavirus spenders quite interesting. While Japan is right up thereno surprisethe biggest spender (proportionate to their GDP) is little Malta, primarily because of funds from the EU. Japan is a bit over 20% and Malta is above that. The U.S. is tagged to be spending 14% of its GDP on the coronavirus. Canada doesnt even appear on the list as they are well down at 8.4%. But these are just spending packages. When one considers the actions of the central bank, France and the U.K. move way up. But actions are different from country to country. Canadas CERB program provides C$2,000/month to those who have lost income due to the coronavirus. All seniors will receive C$300 in a one-time payment. The U.S. is providing US$1,200 to Americans earning less than $99,000. That covers roughly 90% of Americans. Anyway, under the current coronavirus conditions we found the chart interesting.
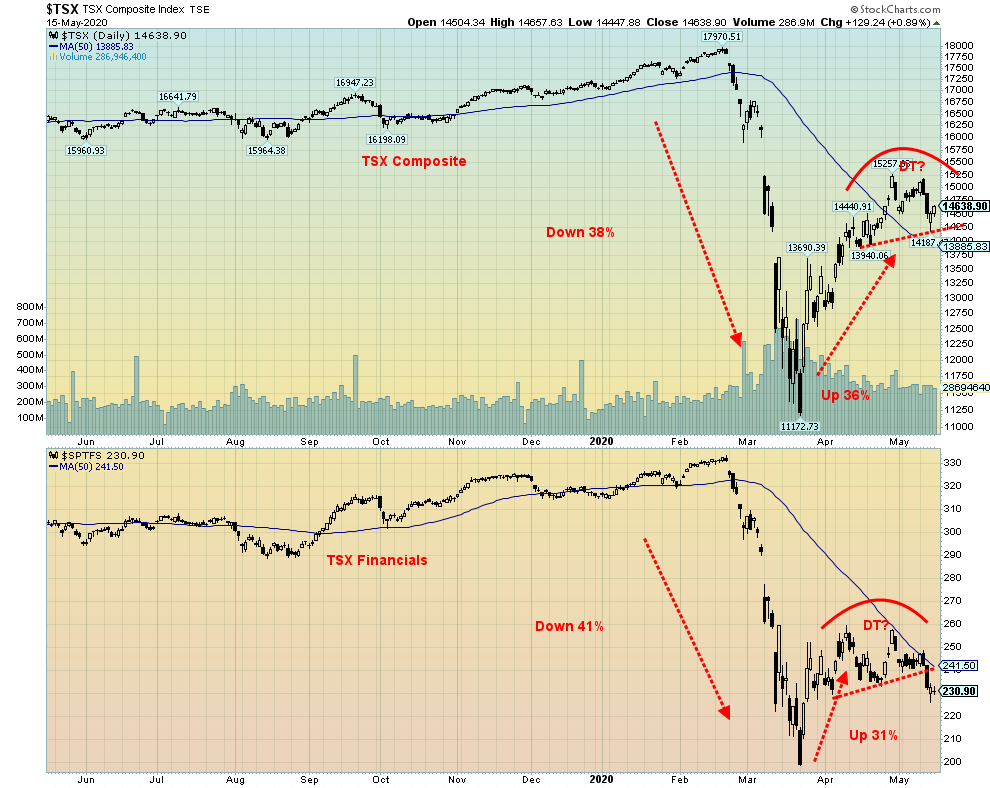
If the TSX Composite is to go higher, it is going to need the participation of the TSX Financials (TFS). Except the Financials have been huge underperformers compared to the TSX. The Financials make up 32% of the TSX. And while they are not the worst performerthat honour belongs to the TSX Energy Index (TEN)the Financials are down 26.8% so far this year. As noted, the TEN leads, down 49.4% in 2020. Heath Care (THC) is second, down 34.6%. Financials are the third worst performer. Both the TSX and the TFS appear to have made double tops. The TFS has already broken under its neckline and projects down to 206. That is close to new lows for the index. The TSX breaks under 14,200 and projects down to 12,835. That is nowhere near the March lows. Of course, both could go lower. Breaking well below the targets would signal that new lows are possible. The TFS failed to regain above the 50-day MA, a negative sign. The TSX did make it above the 50-day but remains below the 200-day MA, signaling that the bear market remains alive.
This past week the TSX fell 2.1% but it was a mixed bag for the sub-indices. Five of the fourteen sub-indices were up on the week, led by Golds (TGD) up 5.2%, and followed by Metals & Mining (TGM) +3.1%, Materials (TMT) +2.4%, Information Technology (TTK) +2.0% and Health Care (THC) +1.7%. With the exception of Health Care, the other four made new 52-week highs. Financials was the big loser, down 5.5%, but others falling included Income Trusts (TCM) -4.6%, Consumer Discretionary (TCD) -4.1%, Consumer Staples (TCS) -0.9%, Energy (TEN) -2.0%, Industrials (TIN) -3.8%, Real Estate (TRE) -5.1%, Telecommunications (TTS) -2.5%, and Utilities (TUT) -4.3%. Looking particularly vulnerable to further declines are TCD, TIN, and TRE, along with TFS. Real Estate could be in trouble on a number of fronts from both commercial and residential real estate as rents fall, prices fall, and vacancy rates rise. Golds, Materials, Metals, and Info Tech look the best and Health Care may recover. Not surprisingly, they were the ones that saw gains this past week.
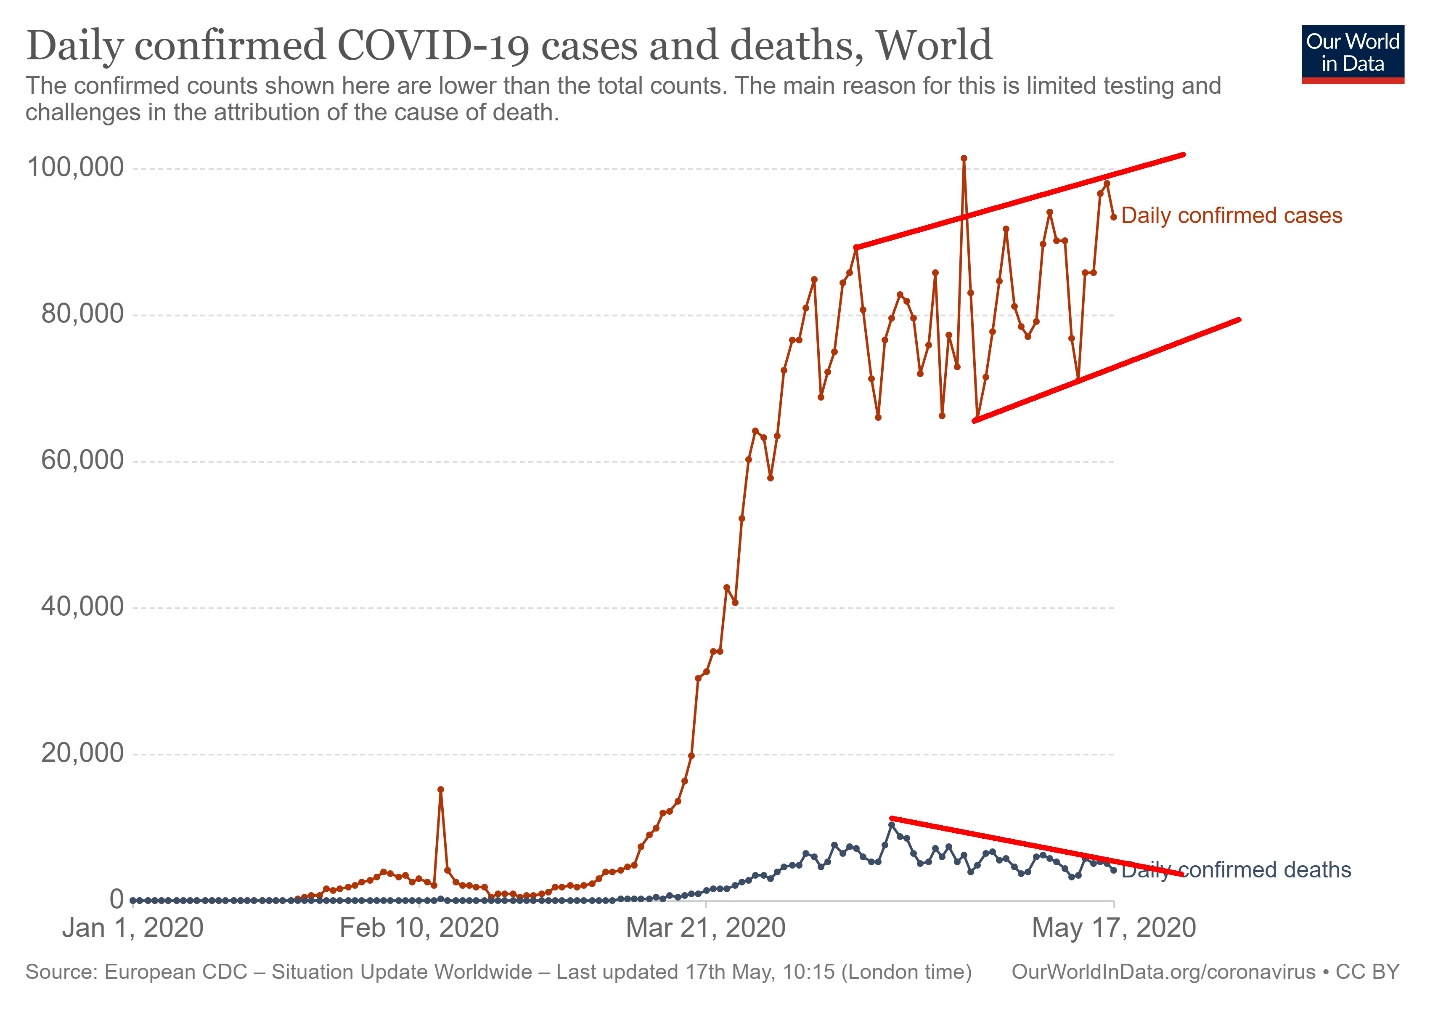
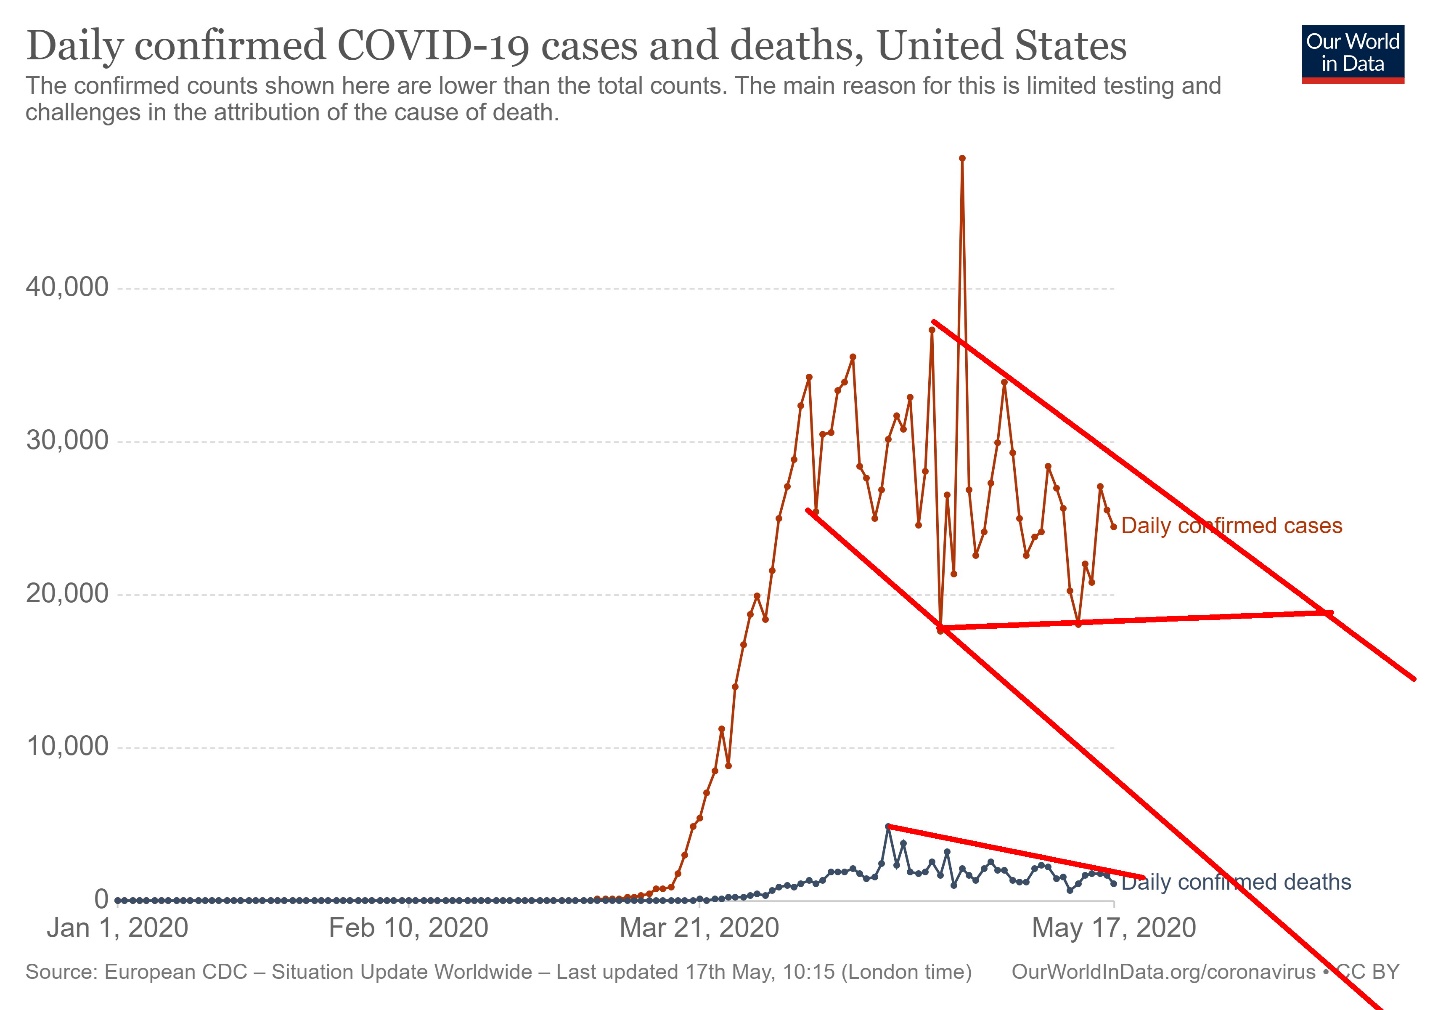
We thought it interesting to show the pace of daily cases and deaths due to the coronavirus. Remember this is just what is being tabulated and reported. Potentially thousands more cases and deaths are not being reported particularly in emerging economies where the health care systems could be somewhat chaotic. What the chart shows is that globally cases are in an upward trajectory. Large increases have been seen in particular in Russia and Brazil as well as in some other emerging economies even as the number of cases levels out and declines albeit slowly in North America and the EU. Deaths appear to be on a downward trajectory which is at least one positive sign.
Update 17:45 GMT, May 17, 2020: Cases 4,771,676, Deaths 314,683, # Countries - 213
Here is the picture in the U.S. Cases and deaths are apparently steady to down in 19 states and up in 3 while steady in the remainder. As it is globally the number of deaths appears to be on a downward trajectory. With the number of cases overall on a downward tilt it heightens the call to open the economy. Technically we could argue it is a descending triangle that should break to the downside.
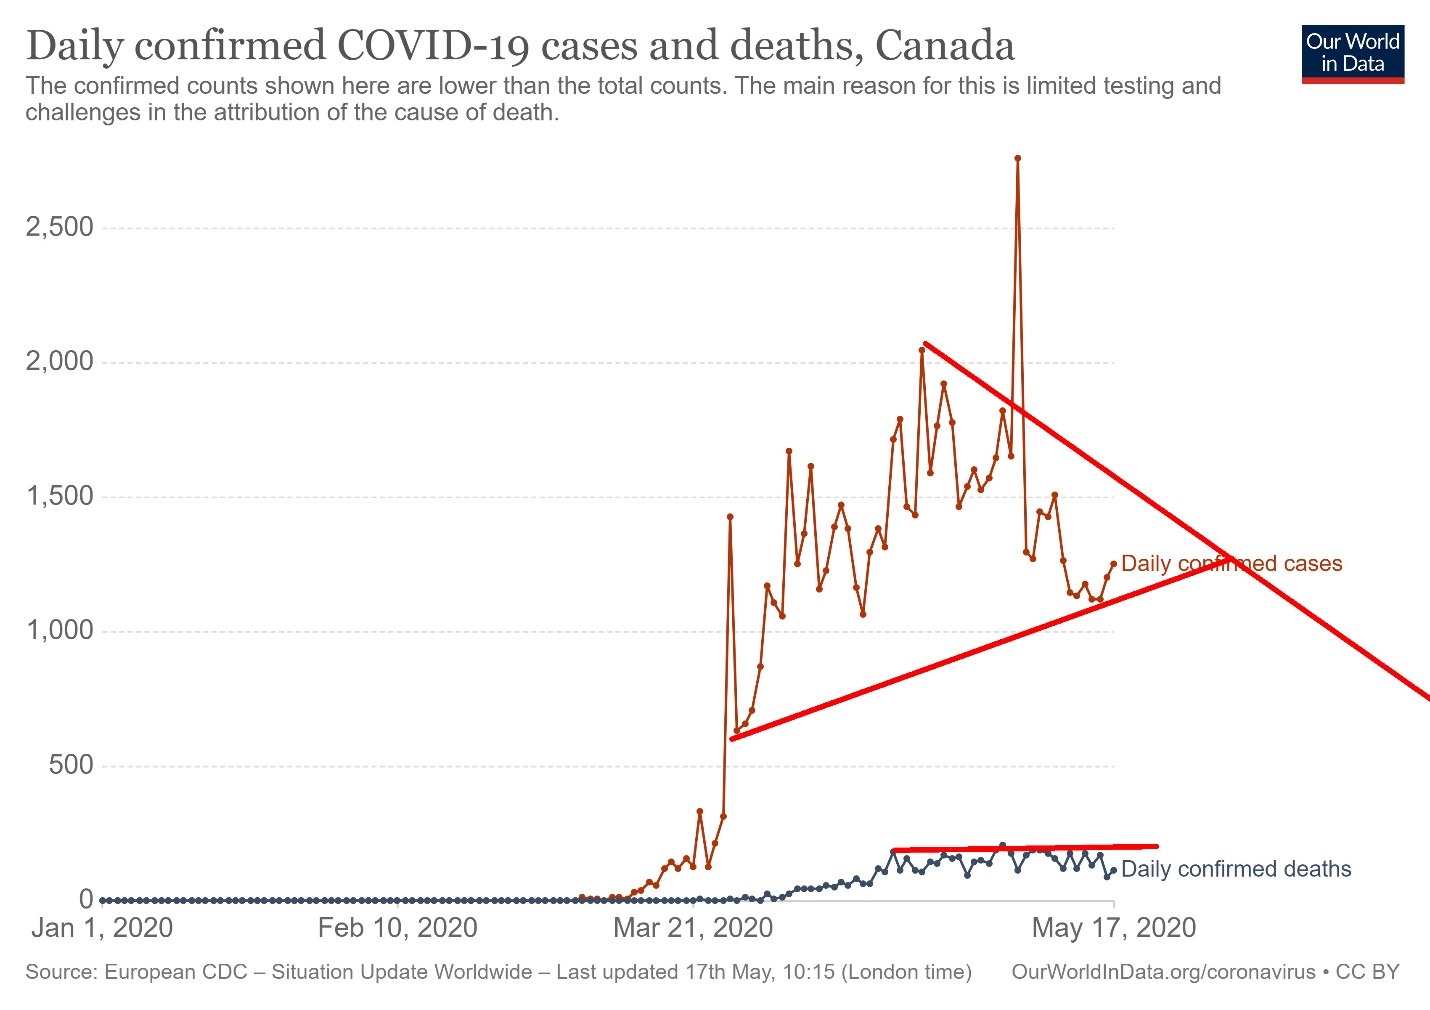
As with the U.S., Canadian cases appear to be on a downward trajectory. Nice symmetrical triangle ignoring that earlier spike. Technically it suggests the number of cases should break to the downside. We are sure that will make people happy. The number of deaths, however, remains relatively flat.
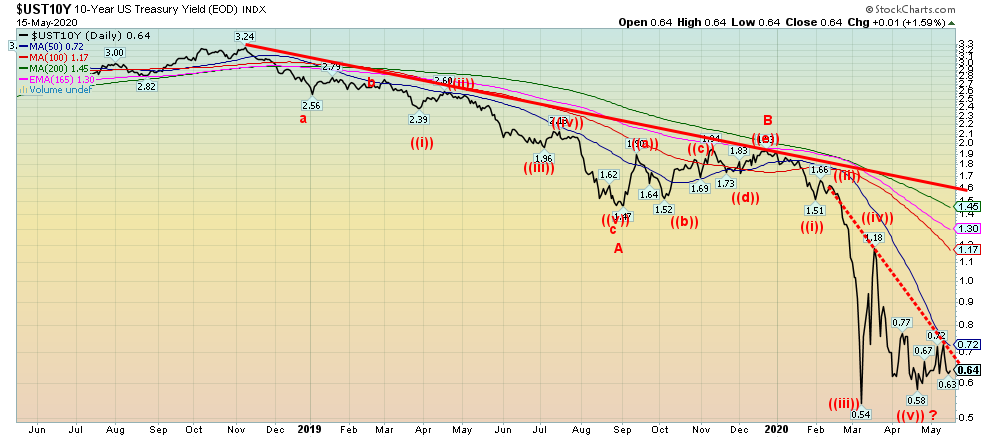
The U.S. 10-year treasury note fell this past week to 0.64% from 0.69% the previous week. Over the past few weeks, the 10-year has remained in a tightening band, suggesting to us it is possible that the 10-year yields have finished falling, at least for now. A shaky stock market allowed yields to soften this past week. In Canada, the 10-year Government of Canada bond (CGB) fell to 0.54% from 0.58%. We expect interest rates to remain low. The last thing the Fed (or Trump) wants is higher interest rates. The Fed has been buying an increasing amount of treasuries against the background of foreign central banks dumping their treasuries to finance their own needs (see chart below on foreign holdings). Trump is pushing for negative rates, but the Fed doesnt set the rate on the 10-year, the market does. The Fed controls the Fed rate and, by extension, short rates. The Fed has slashed to zero and we dont expect them to rise any time soon. As a result, coupled with the Fed buying U.S. treasuries it should help keep interest rates low for the foreseeable future. A break above 0.72% could signal a rise towards 1.00%. Under 0.58% we could see new lows.
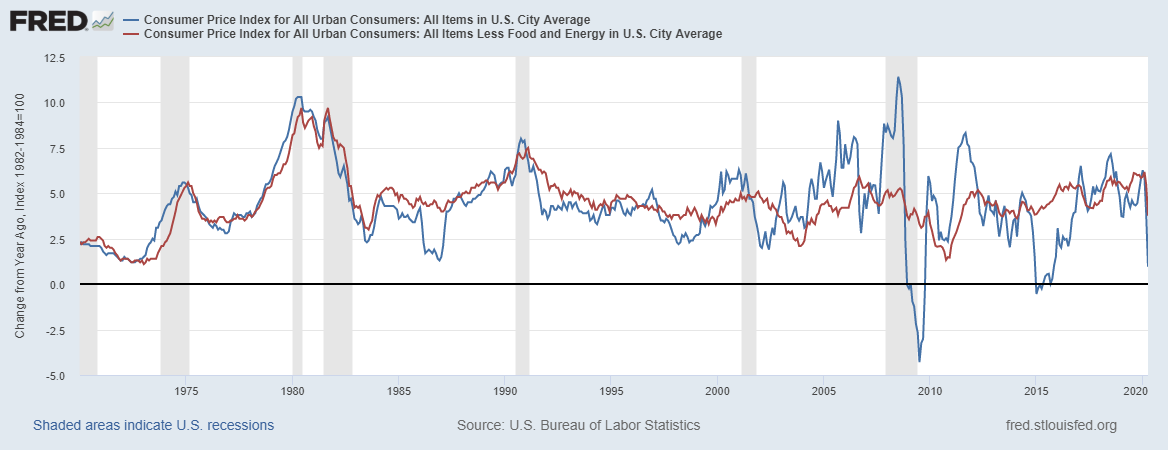
U.S. CPI (blue) and Core CPI (red) Annual Percentage Change
The inflation rate plunged this past month, down 0.8% on the month, primarily due to a fall in energy prices by 20.6%. The CPI now stands at 0.95% year over year. The Fed, however, is more concerned about the core inflation rate which is the CPI less the volatile food and energy components. Or, as we like to say, the core assumes one doesnt eat or drive or heat their home. Energy prices are down, sharply contributing to the fall in the CPI, but food prices have been rising. Thats no surprise given the problems at meat packing plants and the stress on grocery stores during this time of the coronavirus. Could deflation be rearing its ugly head? The Fed wants inflation. With the core nicely up at 3.77% we dont think the Fed needs to worry. The Fed focuses more on the core rate rather than the actual CPI. Still, the core rate fell 0.4% this past month from March. The declines shouldnt be a surprise, given the weakness in the economy and falling energy prices.
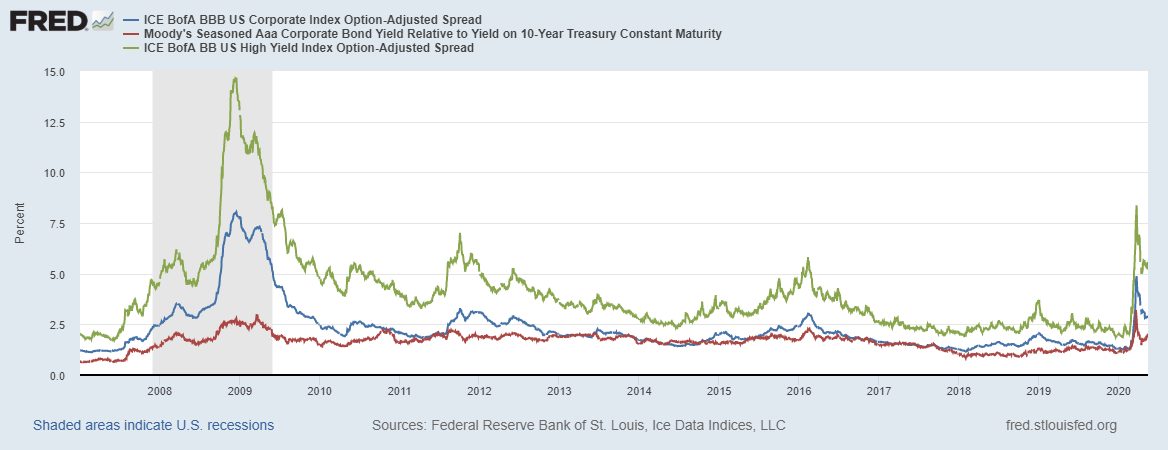
Spreads on Moodys Aaa Corporate Bonds, BBB Corporate Bonds and BB Corporate Bonds
Credit spreads remain down from their recent highs but they are starting to tick up a little. Aaa credits stand at 1.90%, down from 3.20% but up from a recent low at 1.47%. BBB spreads, the lowest investment grade bond, stand at 2.87%, not far from a recent low at 2.83% but well down from the high of 4.88%. Finally, BB spreads, the highest ranked junk bond status, stand at 5.59%, well up from the low of 3.07% but still well down from the recent high of 8.37%. We expect eventually all will exceed their recent high. We suspect that the spreads have made their corrective bottom and should start to rise once again.
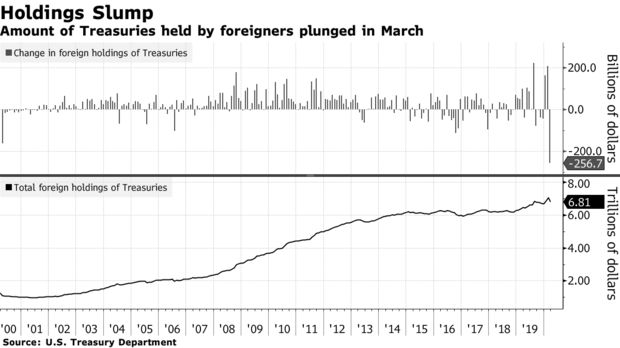
Where have all the treasuries gone? Total foreign ownership of U.S. treasuries fell an incredible $256.6 billion to $6.8 trillion in March from February. That is the biggest drop since 2000. The largest drops came from Saudi Arabia, Brazil, and India, three countries struggling under the coronavirus and struggling financially. They need to sell treasuries to cover other needs and defend their plunging currencies. It is weird because the U.S. is raising more debt than ever, even as foreign holdings plunge. Japan, the largest holder, saw its holdings rise $3.4 billion but China continues to let things slide off as theirs fell $10.7 billion. But Canadas holdings fell as well. down $11 billion in the month. Few increased their holdings. Besides Japan, France was up $7.3 billion, Philippines was up $1.3 billion, and Australia was up $2.8 billion, but that was it.
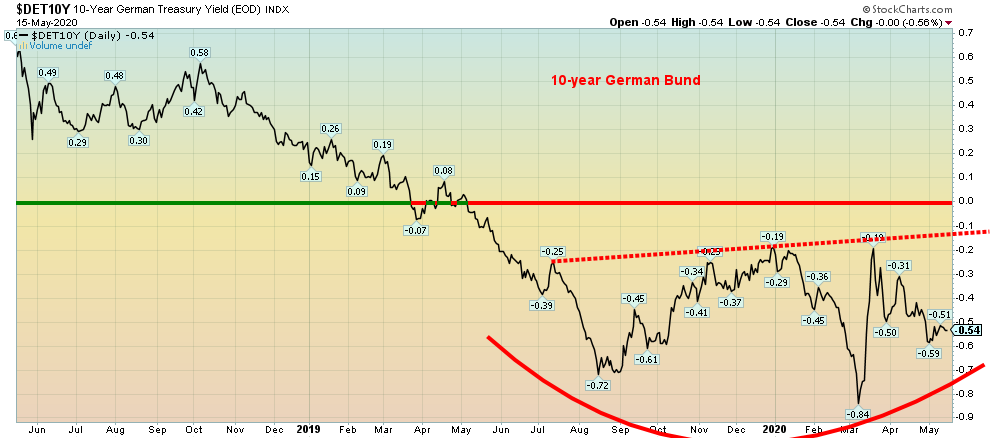
The great negative interest rate experiment continues. The 10-year German bund exemplifies negative interest rates. The yield has been negative since April 2019. Today the 10-year is at negative 54 bp. There is a lot wrong with negative rates. It has not proven to be the economic stimulus that the EU and ECB thought it would be. It would send investors looking for yield in the stock market, or they may buy gold, or, as we have learned, some have taken their cash (yes, real cash) and stored it in a bank vault. Its cheaper than paying negative 54 bp to own the 10-year bund unless you have to hold government bonds. For the EU and Japan as well, who also have negative rates, that has not proven to be the economic panacea they thought it would be. The idea was making it expensive to hold government bonds and they instead lend into the economy. Its not working that way as the banks remain fearful of loan losses that are mounting and have tightened credit conditions. President Trump, who wants the Fed to go to negative interest rates, should heed this. Powell has made it pretty clear that negative interest rates are not on the table. But it could happen anyway if the market starts taking it negative.
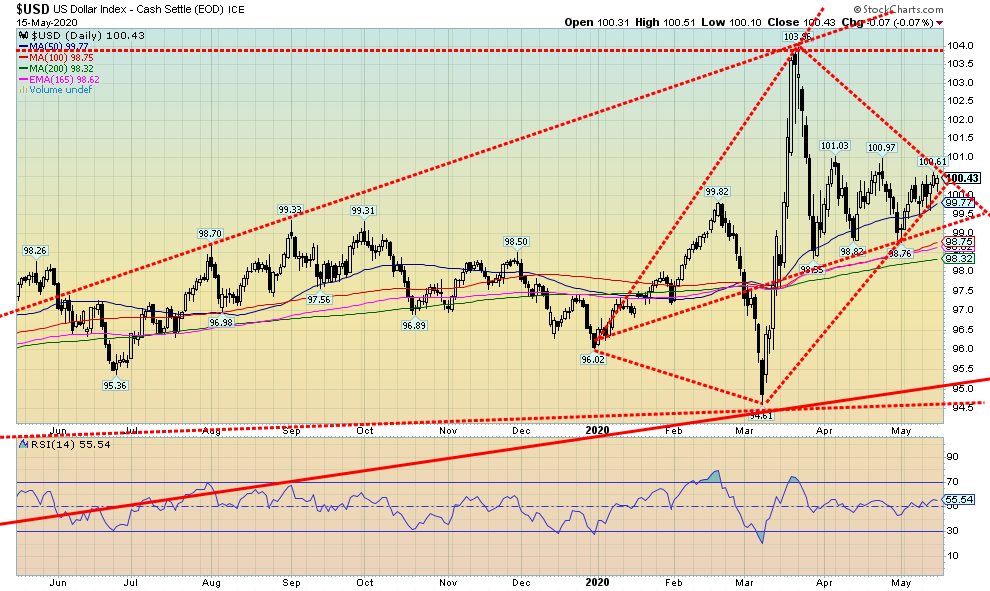
The US$ Index continued to meander this past week, posting a small 0.7% gain. The daily trend is neutral. The other currencies fell with the euro off 0.2%, the Brexit-challenged pound sterling down 2.4%, and the Japanese yen off 0.3%. The Canadian dollar dropped 1.5%. However, the Swiss franc was the star as it was flat on the week. All in all, a pretty quiet week for the currencies.
The US$ Index is forming some interesting patterns. We see a pyramid pattern and we also see potentially a huge diamond pattern. Weve never heard of a pyramid pattern. Yes, it is slanted upward (uneven ground?) but it is still compelling. But the bigger picture shows what may be a rare diamond pattern. We have, over the years, seen very few. The diamond pattern is only seen at tops. Targets are calculated by taking the difference between the highest point 103.96 subtracting the lowest point 94.61 = 9.35 and subtract that from the breakdown point 99.58 = 90.23 or at a target down to 90.0090.50. Along the way we need to break support at 99 and 98 and finally major long-term support at 95. Could it be invalidated? A break above 101 might start to put the pattern in doubt. Above 102.75 we could see new highs above 104. We doubt it but we note it.
Irrespective of this, the U.S. dollar remains vulnerable given the deteriorating economic picture and the massive amount of stimulus being poured into the financial system. The US$ has benefitted from funds fleeing negative rates in the EU and Japan and the U.S./China tensions. But that could reverse as they repatriate funds to finance the deteriorating situation at home. We noted earlier the big drop in U.S. treasuries held by foreigners. The pattern of the US$ Index appears to us as quite bearish. Now we need the breakdown.
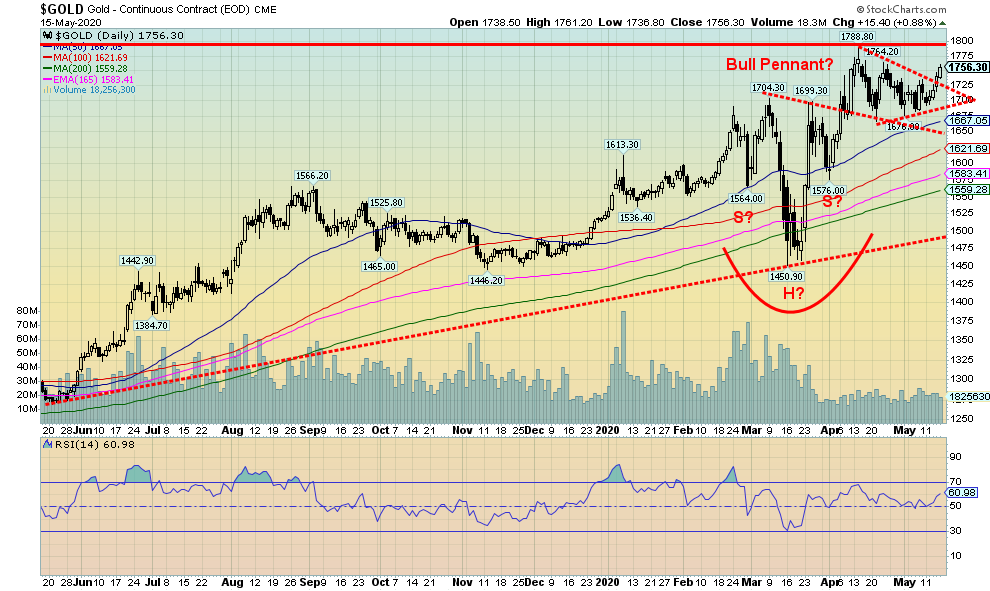
Gold broke out this week from what appears as a possible bull pennant. Targets could be up to $1,850. The head and shoulders pattern that formed earlier targets up to $1,950 and new all-time highs. Overall, the patterns remain bullish. The precious metals did well this past week as gold was up 2.5%, silver had a big week up 8.2% (finally), and platinum rose 3.5%. Platinum also appears poised to break out. Industrial metals that we follow were mixed as palladium rose 2.0% but copper fell 3.3%.
Gold continues to respond positively to weakening economic fundamentals, the massive amount of stimulus being thrown at the markets, and the growing tensions once again between the U.S. and China. The U.S. is blaming China for just about everything that one can think of and military maneuvers by both sides continue in the South China Seas and the Straits of Taiwan. In the current environment, the U.S. accuses and threatens while China retaliates.
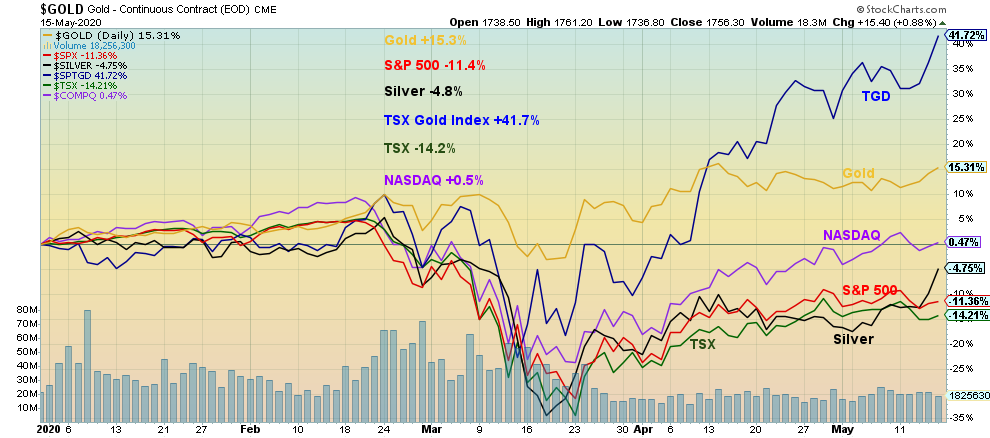
Gold has a lot of stimulus. Another $3 trillion aid package is being prepared and that just adds to the debt and reasons for gold to rise. The inflation data was deflationary. We remind everyone that during the Great Depression the gold stocks rose almost 400% while the DJI was falling 89%. Gold was also up 70% thanks to the revaluation in 1934. Gold prices were fixed back then. So, contrary to popular belief, gold is not just an inflationary hedge but also a deflationary hedge. Gold will perform well during times of political, geopolitical, and financial uncertainty. So far, it is living up to its expectations as gold is up 15.3% this year while the S&P 500 is down 11.4%.
We are also seeing increased activity from hedge funds purchasing physical gold (if you can get it) but instead using ETFs such the SPDR Gold Shares (GLD). We have also seen some large purchases by hedge funds in junior gold mining stocks. That is significant because hedge funds buying junior gold miners helps spur that depressed market. With forecasts from mainstream investment firms such as Goldman Sachs and Bank of America that gold could rise to $3,000 it is spurring the interest.
But we still read bearish reports so it is always fair to note breakdown points. The first sign of trouble would now be under $1,675. Below $1,575 is highly problematic and under $1,450 is terminal. We are trying to watch sentiment indicators which are naturally quite bullish but can remain that way for some time. Overall, the technical patterns are bullish and the fundamentals remain bullish. Over $1,760 we should see new highs above $1,788 and above $1,800.
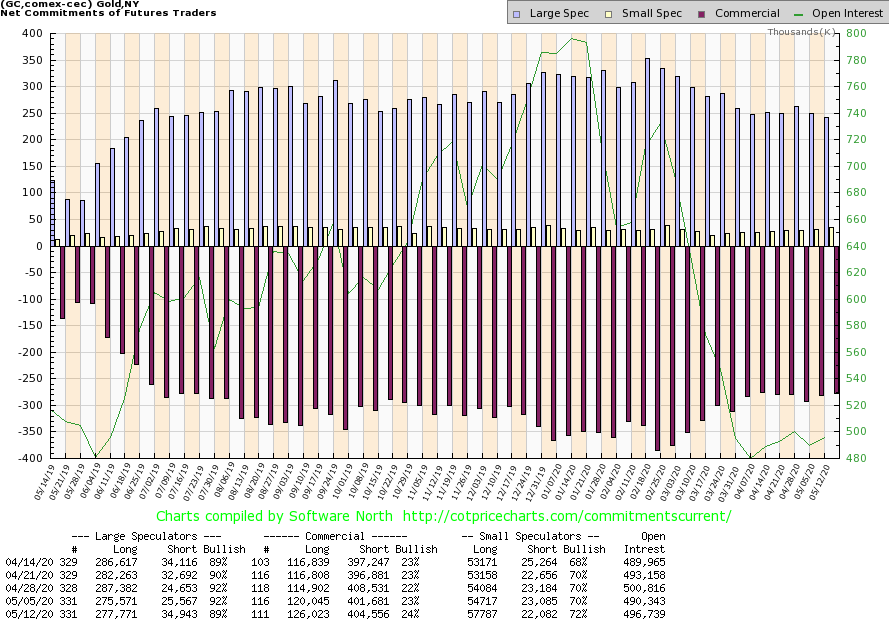
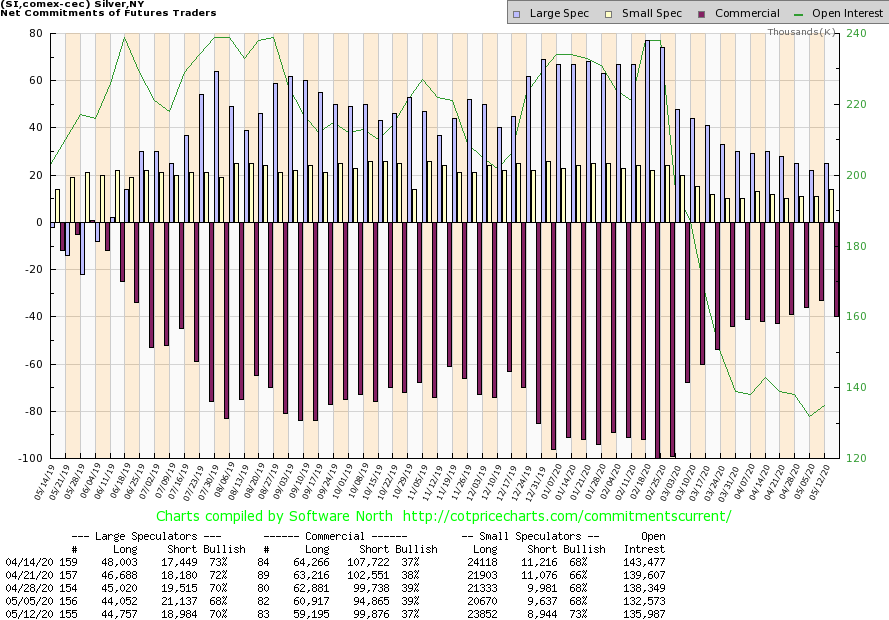
The commercial COT for gold rose slightly to 24% this past week from 23%. Long open interest rose roughly 6,000 contracts while short open interest rose about 3,000 contracts. Open interest was up over 6,000 contracts during a week that gold prices rose. Thats positive. The large speculators COT (hedge funds, managed futures, etc.) slipped to 89% from 92% as they saw short open interest jump over 9,000 contracts. We welcome the improvement but a reminder that the COT remains far from being bullish. If there is any consolation, during the 20092011 run-up to record prices over $1,900 the COT was bearish all the way up. So, it is possible to go higher even as the COT is bearish.
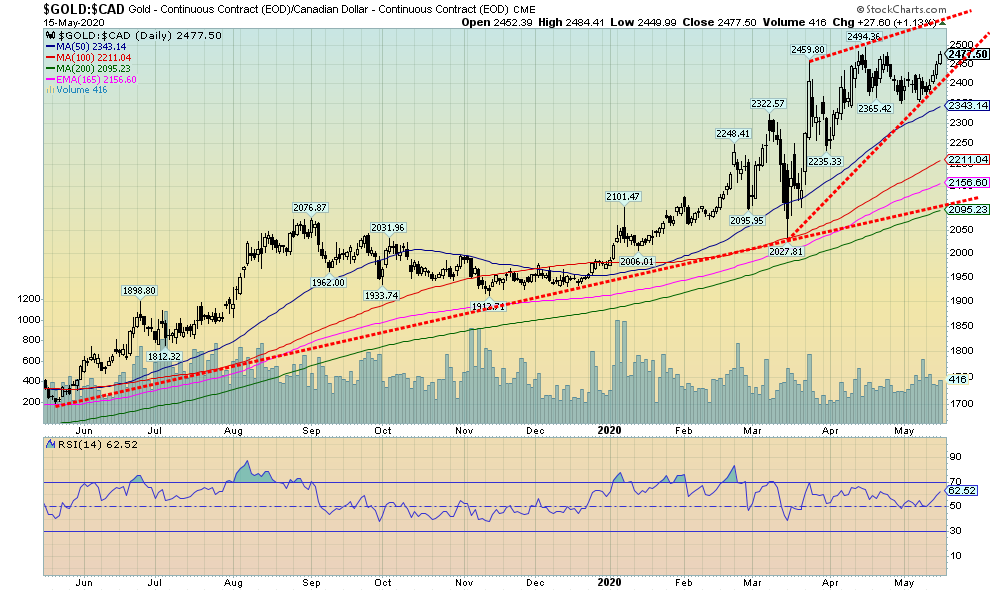
Once again gold in foreign currencies is knocking on potentially new all-time highs. This is gold in Canadian dollars. At $2,477 it is just shy of the all-time high of $2,494. It appears to be indicating that we could see new highs. Of some concern, though, is we could be forming an ascending wedge triangle. The top of the triangle is currently near $2,560 so we certainly have room to move higher by upwards of $100. Gold in Cad$ is not too overbought yet so we do have room to move higher. The breakdown points are seen at $2,415 and $2,350, although the ultimate breakdown point is not seen until under $2,025.
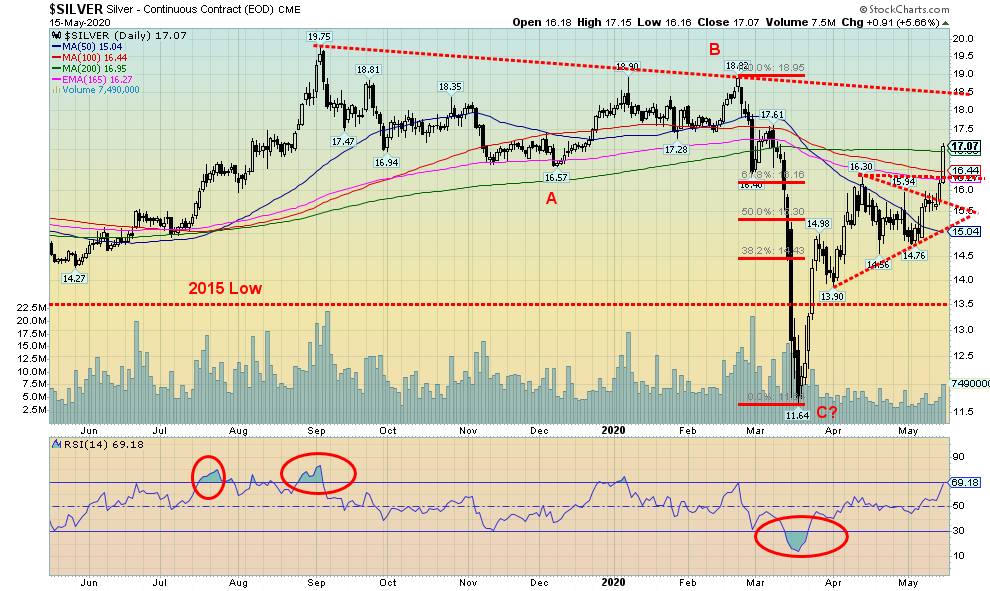
Is silver finally breaking out? Well, we cant conclude that just yet despite the great jump on Friday of 91 cents or 5.6%. On the week silver rose $1.29 or 8.2% with the big jump seen on Friday. Silver broke out of what appears as a symmetrical triangle and now could target up to $18.25. Above $17.25 we could see new highs above $18.90, and above $17.85 we could see new highs above $19.75. Finally, a move above $19 could suggest that we see new highs above the 2016 high of $21.23.
Silver has grossly underperformed gold so the jump this past week was welcome. The gold/silver ratio fell to 102.8. Thats still way too high but far better than the recent peak seen at 131.4. Just to get back to a reasonable up trend line the gold/silver ratio would need to fall to 85. And that would still be high.
Nonetheless the sharp divergence between gold and silver has been a constant subject of precious metals bears. Gold made new highs above its 2016 high, while silver did not. Silver made multi-year lows below its 2015 low, but gold did not. The bears cite this as a reason that gold and silver are due for a great fall once this rally is over. We dont deny the potential power of long-term cycles. Our breakdown point for silver is at the recent low of $13.90. We wouldnt want to see that point taken out as wed know the rally was over and new lows below $11.64 could be seen. Our first sign of trouble would be a break under $16 and especially under $14.75. Its nice to focus on the upside targets, but we need to be aware of the downside breaks.
The silver commercial COT slipped this past week to 37% from 39% the previous. That came against the backdrop of rising silver prices, although it does not include the big jump seen on Friday. Long open interest fell almost 11,000 contracts while short open interest rose roughly 5,000 contracts. The outlook is somewhat bearish or at least a note of caution. Its no surprise the large speculators COT rose to 70% as longs were only up marginally but shorts fell roughly 2,000 contracts.
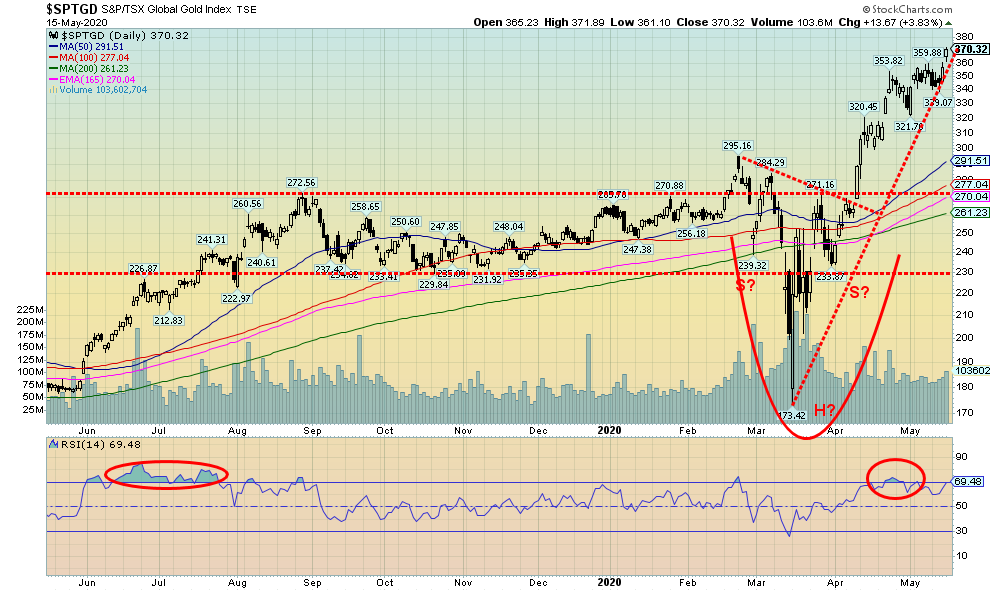
Once again the gold mining stocks enjoyed a good week, making new 52-week highs in the process. The TSX Gold Index (TGD) gained 5.2% and is now up 41.8% on the year while the Gold Bugs Index (HUI) jumped 4.1% and is up 22.7% in 2020. They have been by far the best performing sector in 2020. Can that hot hand continue?
Our head and shoulders bottom on the TGD targeted up to 385. At 370 we are getting close. Could that be the final high? It depends. If we overshoot the target, then following another period of consolidation we could see another move to the upside. The next upside target would be at 460. As we say, though, always be aware of breakdown points. The first sign of trouble would be for the TGD to fall back below 340. Next up would be under 320 and then finally under 300. Even in a bull market, corrections of 10% to 15% are not unusual for the gold miners. Under 290/300 would of more concern and that could take us back to 260 and a test of the 200-day MA. We are now 42% above the 200-day MA so we are getting a little frothy. Ultimately a breakdown under 235 would be terminal and we could fall back to the March lows.
The RSI is extended but not extensively so. In a bull market rising to over 70 and staying there for a while is not unusual. The Gold Miners Bullish Percent Index remains elevated at 92 but it has been like that for some time. A rise to 100 would get us taking profits for sure. We hit 100 once before in July 2016. That proved to be the top for the next three years. So we are extended but not hugely so. But there are little warnings to exercise some caution. And any top might just be a temporary one to ease any overbought conditions. Well see how the TGD reacts when we hit our targets.
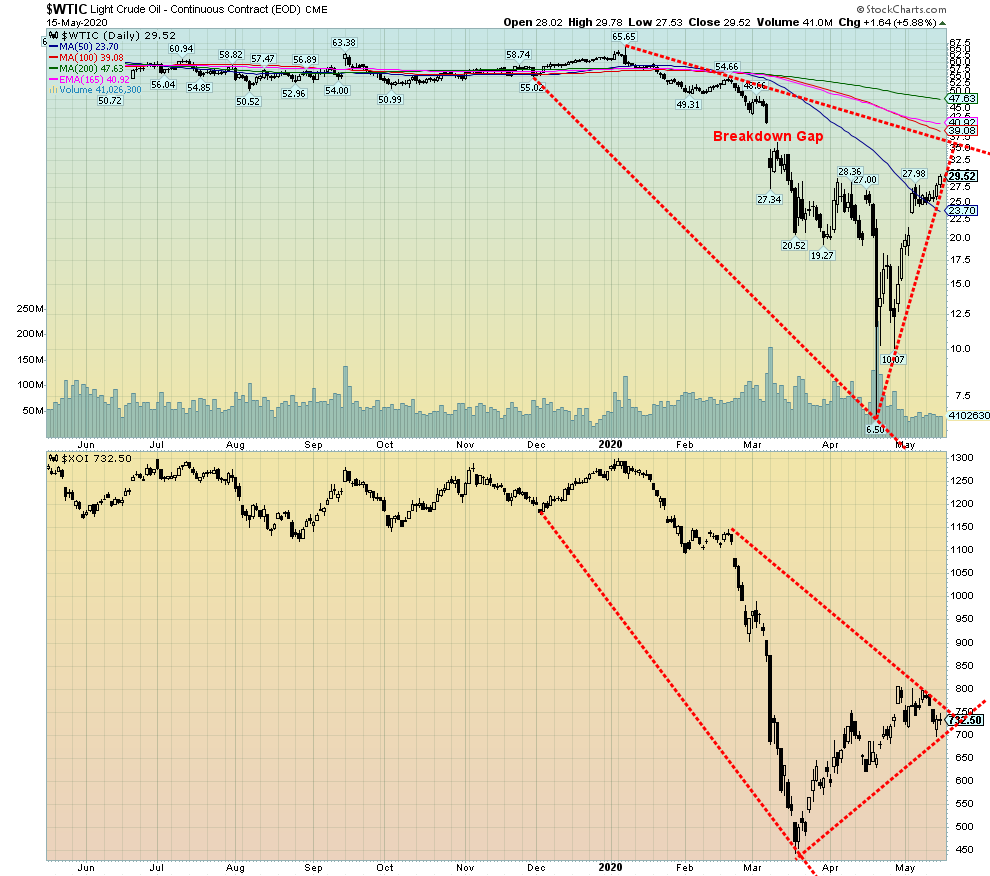
Surprisingly, or maybe not, oil prices keep rising, this time up to $29.52. Thats a long way from the negative $37 at the time of the May rollover. While the May contract fell to negative $37 the June contract, which was considered the front month future, only fell to $6.50. Still, $6.50 to $29.52 is a 354% jump.WTI oil gained 12.8% this past week and it is still down 51.7% on the year. Others areas of the energy sector didnt cooperate. Natural gas (NG) fell 9.3% and remains locked in its bear market but the divergences came with the energy indices as the ARCA Oil & Gas Index (XOI) fell 8.1% and the TSX Energy Index (TEN) was down 2.0%. If oil is so bullish, then why are the energy stocks falling? For us it is a sign that the oil rally is probably running its course and the stocks are anticipating a fall and not a further rise. The bulls would probably argue that the stocks are hesitant and once they see oil prices continue to climb, theyll catch up in a hurry.
The reality is oil is in a sharply reduced world. The oil producers have cut and there is some optimism regarding demand as economies begin to open up. But what if a second more deadly wave hits? OPEC has cut roughly 10 bpd others even in the U.S. have also joined in the cuts. The U.S. shale industry is in disarray and multiple bankruptcies loom. Inventory builds have slowed and with that there is some easing of storage space. Most forecasts are now saying that they do not expect the oil market to fully recover until at least 2026. Couple that with the warnings from Fed Chair Jerome Powell of an extended period of economic damage and warnings from St. Louis Fed Chair Bullard of permanent damage and job losses that wont be coming back any time soon. That will be another nail on recovery for oil demand.
Now we are reading that the NG market could be oversupplied as well. Apparently, LNG exporters are scrambling for market share to sell their product and finding storage. Inventories have been rising sharply and that has played into the falling price.
WTI oil has had a good rally, but the fading energy stocks appear to sending us the message that the rally could be just about over. Well soon be moving into oils weak seasonals and that could see prices fall once again. New lows? Probably not, but we could certainly see a period of ups and downs and potential base building. Weve had the ups, so prepare for more downs. Oil breaks under $24. The XOI breaks down under 625.
Neutral Indicators are mostly neutral. A trend change might be in the offing.
Weak The trend is still up or down but it is weakening. It is also a sign that the trend might change.
Topping Indicators are suggesting that while the trend remains up there are considerable signs that suggest that the market is topping.
Bottoming Indicators are suggesting that while the trend is down there are considerable signs that suggest that the market is bottoming.
Disclaimer
David Chapman is not a registered advisory service and is not an exempt market dealer (EMD) nor a licensed financial advisor. We do not and cannot give individualised market advice. David Chapman has worked in the financial industry for over 40 years including large financial corporations, banks, and investment dealers. The information in this newsletter is intended only for informational and educational purposes. It should not be considered a solicitation of an offer or sale of any security. The reader assumes all risk when trading in securities and David Chapman advises consulting a licensed professional financial advisor before proceeding with any trade or idea presented in this newsletter. David Chapman may own shares in companies mentioned in this newsletter. We share our ideas and opinions for informational and educational purposes only and expect the reader to perform due diligence before considering a position in any security. That includes consulting with your own licensed professional financial advisor.
The content on this site is protected
by U.S. and international copyright laws and is the property of GoldSeek.com
and/or the providers of the content under license. By "content" we mean any
information, mode of expression, or other materials and services found on GoldSeek.com.
This includes editorials, news, our writings, graphics, and any and all other
features found on the site. Please contact
us for any further information.
Live GoldSeek Visitor Map | Disclaimer
The views contained here may not represent the views of GoldSeek.com, Gold Seek LLC, its affiliates or advertisers. GoldSeek.com, Gold Seek LLC makes no representation, warranty or guarantee as to the accuracy
or completeness of the information (including news, editorials, prices, statistics,
analyses and the like) provided through its service. Any copying, reproduction
and/or redistribution of any of the documents, data, content or materials contained
on or within this website, without the express written consent of GoldSeek.com, Gold Seek LLC,
is strictly prohibited. In no event shall GoldSeek.com, Gold Seek LLC or its affiliates be
liable to any person for any decision made or action taken in reliance upon
the information provided herein.