LIVE Gold Prices $  | E-Mail Subscriptions | Update GoldSeek | GoldSeek Radio 

Commentary : Gold Review : Markets : News Wire : Quotes : Silver : Stocks - Main Page 

 GoldSeek.com >> News >> Story  Disclaimer 
 
Latest Headlines

GoldSeek.com to Launch New Website
By: GoldSeek.com

Is Gold Price Action Warning Of Imminent Monetary Collapse Part 2?
By: Hubert Moolman

Gold and Silver Are Just Getting Started
By: Frank Holmes, US Funds

Silver Makes High Wave Candle at Target – Here’s What to Expect…
By: Clive Maund

Gold Blows Through Upside Resistance - The Chase Is On
By: Avi Gilburt

U.S. Mint To Reduce Gold & Silver Eagle Production Over The Next 12-18 Months
By: Steve St. Angelo, SRSrocco Report

Gold's sharp rise throws Financial Times into an erroneous sulk
By: Chris Powell, GATA

Precious Metals Update Video: Gold's unusual strength
By: Ira Epstein

Asian Metals Market Update: July-29-2020
By: Chintan Karnani, Insignia Consultants

Gold's rise is a 'mystery' because journalism always fails to pursue it
By: Chris Powell, GATA

 
Search

GoldSeek Web

 
Gold New All-Time Highs and Beyond


 -- Published: Wednesday, 8 July 2020 | Print  | Disqus 

By Hubert Moolman


During the 70s bull market, gold went from $35 to $195 in the first phase. That was a 458% increase. The first phase of the current bull market took gold from $252 to $1920, which made for a 661% increase.


1.png (1088×645)


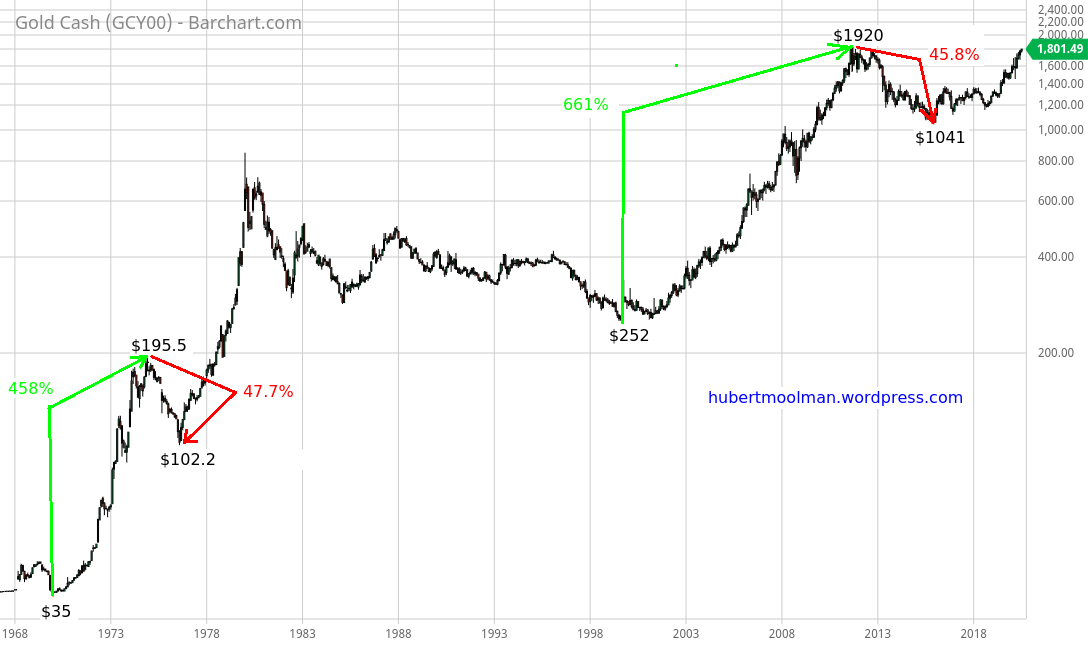
At first glance, it would appear that the current bull market outperformed the 70s one. However, it only took about five years (1970 to 1975) to get the 458% increase, compared to the roughly ten years and five months it took to get the 661% increase. If the performance of the current bull market actually matched that of the 70s, then prices should have probably risen more than 1000%.


The decline from the peak of the first phase of the 70s, took gold from $195.5 to $102.2, a 47.7% drop. The decline from the peak of the first phase of the current bull market, took gold from $1920 to $1041, a 45.8% drop.


The declines are almost similar in extent (47.7% vs 45.8%), however; the decline in the 70s only took about one year and nine months, whereas the decline since 2011, took about four years and three months.


The 70s decline lasted about 35%(1yr 9months/5yrs) of the period of the rise, whereas the decline since 2011 lasted about 40.8% (4yrs 3months/10yrs 5 months) of the period of the rise. This shows that the declines were almost similar relative to the period of the rise in prices.


The conclusion to draw from this: things take longer in the current period, but they go higher.


The rise from the bottom in 1976 to the top in 1980 took about 41 months, and gold went from $100 to $873 (773% increase). If gold can match this increase, it would reach $ 9 087. Based on the performance of the first leg of the current bull market, it should easily reach this.


It is already 55 months (a Fibonacci number by the way) since gold hit the bottom at $1041. So, again things take much longer.


Below, is a comparison of the current gold fractal and that of the 70s:


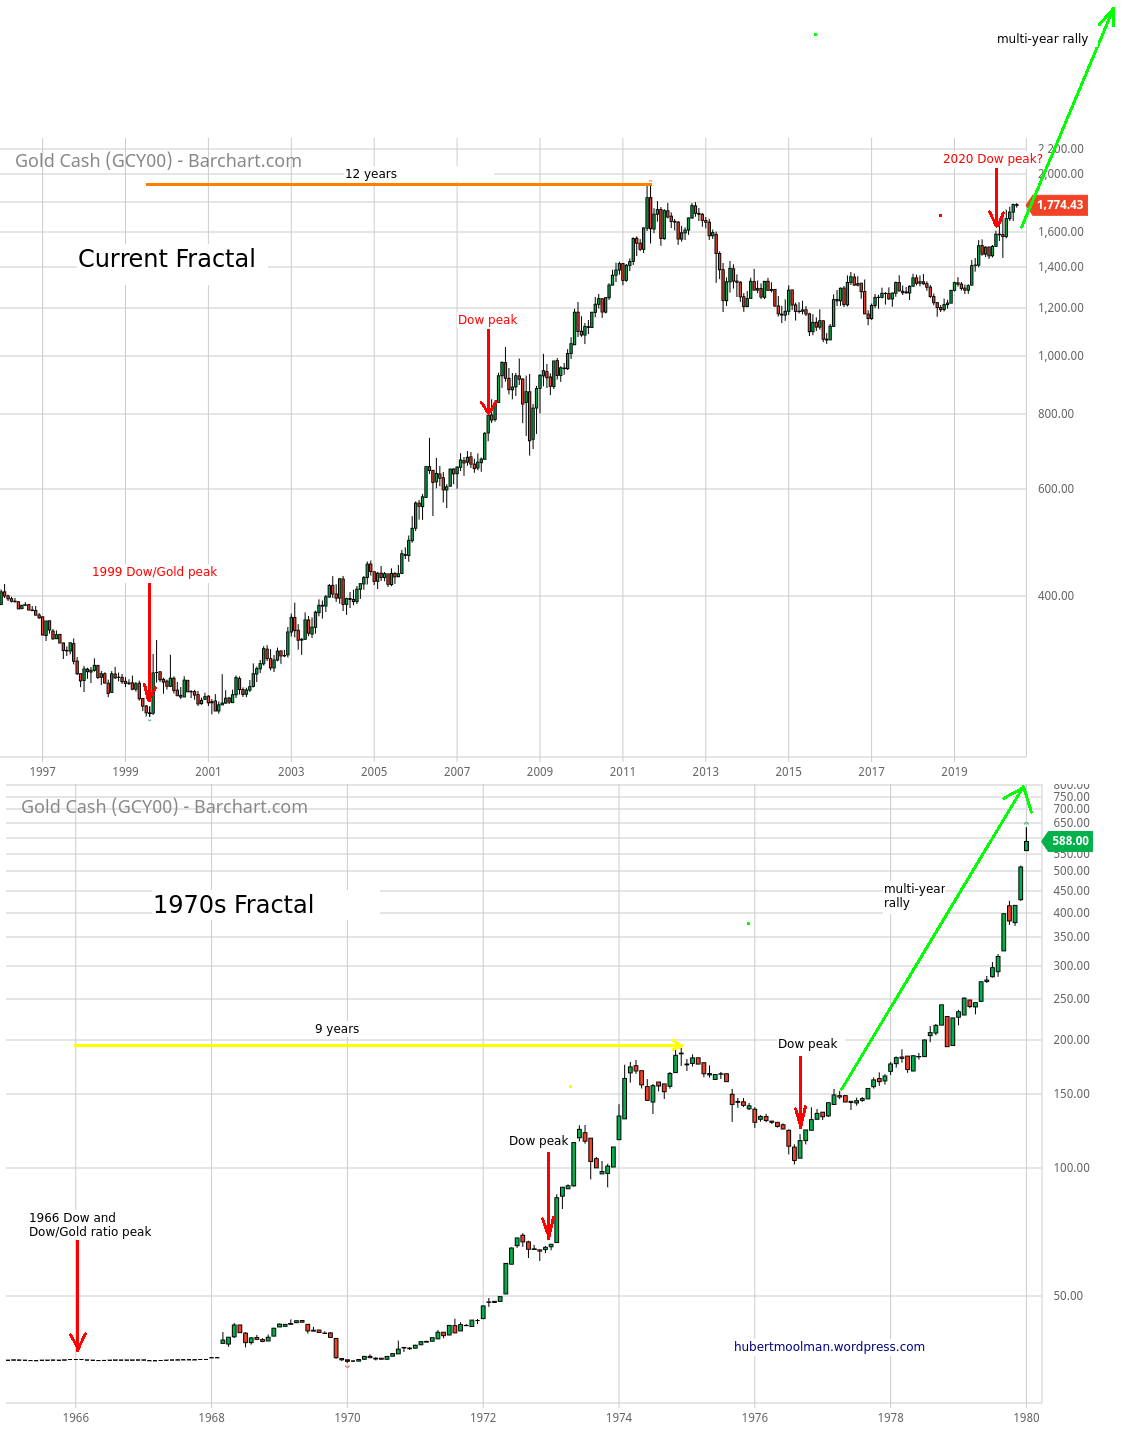
Gold looks poised to take the all-time high soon.


For more on this and this kind of fractal analysis, you are welcome to subscribe to my premium service. I have also recently completed a Silver Fractal Analysis Report as well as a Gold Fractal Analysis Report.


| Digg This Article
 -- Published: Wednesday, 8 July 2020 | E-Mail  | Print  | Source: GoldSeek.com

comments powered by Disqus


Increase Text SizeDecrease Text SizeE-mail Link of Current PagePrinter Friendly PageReturn to GoldSeek.com

 news.goldseek.com >> Story

E-mail Page  | Print  | Disclaimer 


© 1995 - 2019


GoldSeek.com Supports Kiva.org

© GoldSeek.com, Gold Seek LLC

The content on this site is protected by U.S. and international copyright laws and is the property of GoldSeek.com and/or the providers of the content under license. By "content" we mean any information, mode of expression, or other materials and services found on GoldSeek.com. This includes editorials, news, our writings, graphics, and any and all other features found on the site. Please contact us for any further information.

Live GoldSeek Visitor Map | Disclaimer


Map

The views contained here may not represent the views of GoldSeek.com, Gold Seek LLC, its affiliates or advertisers. GoldSeek.com, Gold Seek LLC makes no representation, warranty or guarantee as to the accuracy or completeness of the information (including news, editorials, prices, statistics, analyses and the like) provided through its service. Any copying, reproduction and/or redistribution of any of the documents, data, content or materials contained on or within this website, without the express written consent of GoldSeek.com, Gold Seek LLC, is strictly prohibited. In no event shall GoldSeek.com, Gold Seek LLC or its affiliates be liable to any person for any decision made or action taken in reliance upon the information provided herein.