-- Posted Thursday, 17 January 2013 | | Disqus
| Close | Gain/Loss |
Gold | $1686.90 | +$7.00 |
Silver | $31.69 | +$0.22 |
XAU | 161.52 | -0.56% |
HUI | 429.09 | -0.45% |
GDM | 1252.93 | -0.48% |
JSE Gold | 2224.57 | -33.06 |
USD | 79.66 | -0.13 |
Euro | 133.77 | +0.87 |
Yen | 111.30 | -1.84 |
Oil | $95.49 | +$1.25 |
10-Year | 1.875% | +0.051 |
T-Bond | 145.1875 | -0.90625 |
Dow | 13596.02 | +0.63% |
Nasdaq | 1336.00 | +0.59% |
S&P | 1480.94 | +0.56% |
The Metals:
Gold edged up to $1683.78 in London before it dropped back to $1666.90 at about 9AM EST, but it then jumped to as high as $1695.79 in early afternoon New York trade and ended with a gain of 0.42%. Silver fell to as low as $31.038 in early New York trade, but it then surged to as high as $31.891 at about 1PM EST and ended with a gain of 0.7%.
Euro gold fell to about 1261, platinum gained $4.83 to $1688.50, and copper gained 4 cents to about $3.66.
Gold and silver equities traded mostly slightly lower and ended with modest losses.
The Economy:
Report | For | Reading | Expected | Previous |
Initial Claims | 1/12 | 335K | 370K | 372K |
Housing Starts | Dec | 954K | 889K | 851K |
Building Permits | Dec | 903K | 905K | 900K |
Philadelphia Fed | Jan | -5.8 | 5.2 | 4.6 |
Lockhart Sees Feds Bond Buying Continuing Beyond Mid-2013 Bloomberg
Ryan Says House Republicans Discussing Short-Term Debt Increase Bloomberg
Tomorrow at 9:55AM EST brings Michigan Sentiment for January expected at 75.0.
The Markets:

Charts Courtesy of http://finance.yahoo.com/
Oil rose on better than expected housing and jobs data that sent the U.S. dollar index and treasuries lower.
The Dow, Nasdaq, and S&P rose almost 1% on optimism about the economy.
Among the big names making news in the market today were Citigroup, Goldman Sachs, Las Vegas Sands, Herbalife, RIM, and Citgo.
The Commentary:
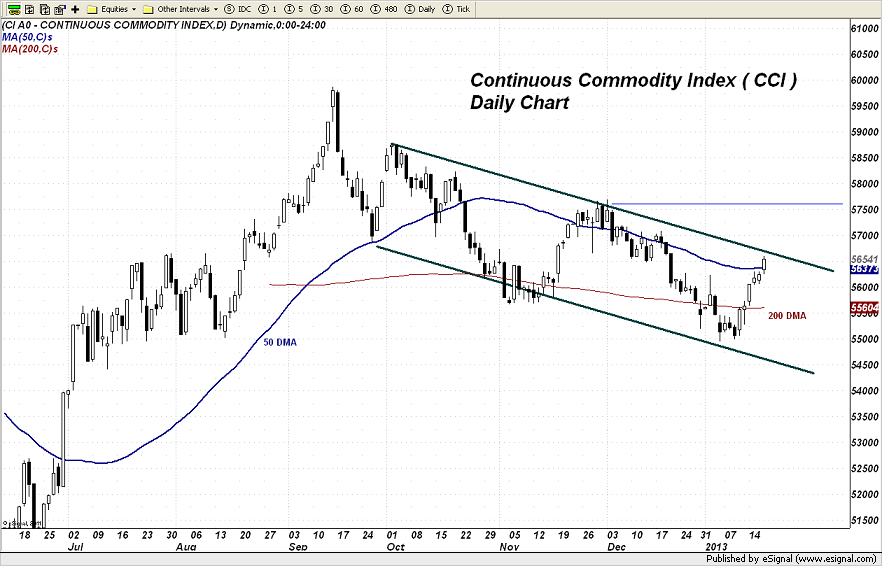
The following chart of the Continuous Commodity Complex or CCI, shows a downtrending channel that has held the complex for the last several months. In November of last year, the index broke through the 50 day moving average and remained ABOVE it for more than a week before succumbing to selling pressure heading into the end of last year.
Early this year it was trading below both the 50 day moving average and the 200 day moving average. As of today, it is now back above both and is also nearing the downsloping line that marks the top of the trend channel. It is no surprise therefore to see SILVER looking very strong on its chart right now especially with the very bullish patterns on the platinum group metals showing no signs of abating for the immediate near term.
Were it not for the weakness in the grain complex this morning, the CCI would be right on that line at the top of the channel. Let's watch this action very closely as it will indicate whether these incipient signs of life in the commodity complex are the beginning of a period of sustained upward trending moves across this sector.
Keep in mind that in spite of the massive injections of liquidity by the Central Banks of the West (I include Japan in this category), commodity prices have heretofore been rather unresponsive. The reason has been that traders were initially more fearful of a global slowdown than they were of any inflationary result. Based on the jobless claims number this AM here in the US and data from other global regions, that the slowdown fears are receding and growth expectations are solidly in place. In other words, it appears that for now, the Central Banks have won the battle over deflation.
So what does this mean for commodity prices? Simple - based on the charts, and the action in the interest rate markets (more on that later), traders are speculators are beginning to transition towards the growth play (RISK ON) and away from the slowing global growth scenario (RISK OFF).
Watch that solid blue line that I have marked as RESISTANCE near 575 - 577. If this index pushes FIRMLY past that line, we will know that the price of wholesale commodities in general are going to begin a sustained rise higher. This should further unleash bullish forces in the precious metals but especially in silver compared to gold.
With this in mind, take a look at the chart I have constructed below. It is a ratio chart comparing the level of the S&P 500 (a broad view of the US equity markets) to the level of the US Long Bond. I use this as a type of indicator to help me discern where money flows are heading and whether or not speculators have an appetite for risk.
Notice since late in 2011, the trend has been in favor of equities over bonds. Yes, there have been periods within this trend where RISK has been out of favor leading to money flows out of equities and back into bonds, but the trend is pretty solid. What I wish to point out especially however is that the ratio is accelerating and has been since late spring of last year. It has increased even more sharply since fall of last year. Any wonder why the equity markets are shooting higher? Hot money is flowing into equities at the expense of bonds all in anticipation of GREATER RETURNS in this ultra low interest rate environment.
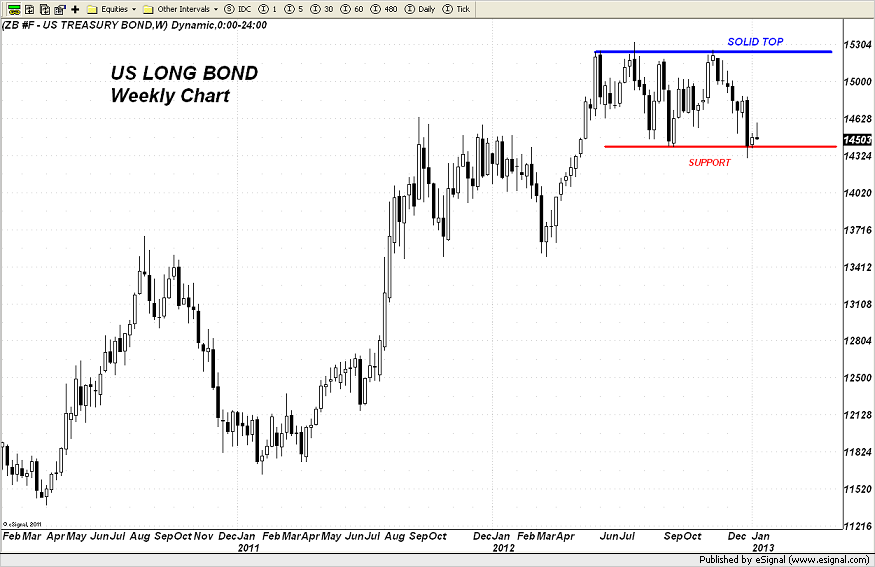
In this light, can you understand why we now have a top in the US Long Bond? As mentioned in a post a while back, I would be surprised by a RAPID, SHARP DROP in the long bond as the economy is certainly not strong enough to sustain any pressure from rising rates. At the same time however, I expect to see a SLOW GRADUAL GRIND LOWER which will accelerate as the impact from all the liquidity created by the Fed's QE programs begins to gather steam and inflation expectations increase.
I want to also emphasize that I expect significant difficulties to arise once the Fed attempts to unwind its balance sheet. Personally I am beginning to wonder if they are ever going to be able to do so?
Note on the chart that bonds have fallen to major chart support but managed to eke out a return above that level and are currently holding. However, their rally off the level looks weak. Watch out if this support level gives way on a weekly basis close, as it will entail the definitive shift away from deflation fears and shift the balance of power to the hands of those looking for inflation as the next worry.
Once such an event occurs, I would anticipate a solid move higher in silver in particular.- Dan Norcini, More at http://www.traderdannorcini.blogspot.com/
GATA Posts:

Nostradamus wouldn't believe SLV's claim of huge increase in metal holdings
Ambrose Evans-Pritchard: A new gold standard is being born
The Statistics:
As of close of business: 1/16/2013
Gold Warehouse Stocks: | 10,906,993.966 | - |
Silver Warehouse Stocks: | 152,002,946.018 | -257,806.02 |
Global Gold ETF Holdings
[WGC Sponsored ETFs]

| Product name | Total Tonnes | Total Ounces | Total Value |
New York Stock Exchange Arca (NYSE Arca) AND Singapore Exchange (SGX) AND Tokyo Stock Exchange (TSE) AND Hong Kong Stock Exchange (HKEx) | SPDR® Gold Shares | 1334.416 | 42,902,808 | US$71,898m |
London Stock Exchange (LSE) AND NYSE Euronext Paris AND Borsa Italiana AND Frankfurter Wertpapierbörse (Deutsche Börse - Xetra) | Gold Bullion Securities | 138.43 | 4,450,758 | US$7,502m |
London Stock Exchange (LSE) AND NYSE Euronext Paris AND Borsa Italiana AND Frankfurter Wertpapierbörse (Deutsche Börse - Xetra) AND NYSE Euronext Amsterdam | ETFS Physical Gold | 158.24 | 5,087,521 | US$8,296m |
Australian Stock Exchange (ASX) | Gold Bullion Securities | 11.16 | 358,789 | US$605m |
Johannesburg Securities Exchange (JSE) | New Gold Debentures | 42.45 | 1,364,715 | US$2,214m |
Note: Change in Total Tonnes from yesterdays data: SPDR subtracted 2.409 tonnes.
COMEX Gold Trust (IAU) Total Tonnes in Trust: 219.58: +0.54 change from yesterdays data.
Silver Trust (SLV) Total Tonnes in Trust: 10,734.99: +571.63 change from yesterdays data.
The Miners:
Gold Resources (GORO) production results, Claudes (CGR) secured debt financing, Aurcanas (AUN.V) production results, and Alexcos (AXU) production results were among the big stories in the gold and silver mining industry making headlines today.
WINNERS
1. Comstock | LODE +5.56% $1.90 |
2. Alexco | AXU +4.62% $4.08 |
3. ITH | THM +3.90% $2.40 |
LOSERS
1. Revett | RVM -5.30% $2.50 |
2. Turquoise | TRQ -4.36% $8.56 |
3. Midway | MDW -3.62% $1.33 |
Winners & Losers tracks NYSE and AMEX listed gold and silver mining stocks that trade over $1.
Please see Yahoos Mining/Metals News Wire for all of todays mining news.
- Chris Mullen, Gold Seeker Report
- Would you like to receive the Free Daily Gold Seeker Report in your e-mail? Click here
Additional Resources for todays Gold Seeker Report can be found:
© Gold Seeker 2013
Note: This article may be reproduced provided the article, in full, is used and mention to Gold-Seeker.com is given.
Disclosure: The owner, editor, writer and publisher and their associates are not responsible for errors or omissions. The author of this report is not a registered financial advisor. Readers should not view this material as offering investment related advice. Gold-Seeker.com has taken precautions to ensure accuracy of information provided. Information collected and presented are from what is perceived as reliable sources, but since the information source(s) are beyond Gold-Seeker.coms control, no representation or guarantee is made that it is complete or accurate. The reader accepts information on the condition that errors or omissions shall not be made the basis for any claim, demand or cause for action. Past results are not necessarily indicative of future results. Any statements non-factual in nature constitute only current opinions, which are subject to change. Nothing contained herein constitutes a representation by the publisher, nor a solicitation for the purchase or sale of securities & therefore information, nor opinions expressed, shall be construed as a solicitation to buy or sell any stock, futures or options contract mentioned herein. Investors are advised to obtain the advice of a qualified financial & investment advisor before entering any financial transaction.
-- Posted Thursday, 17 January 2013 | Digg This Article | Source: GoldSeek.com


 Gold Seeker Closing Report: Gold and Silver Gain With Stocks and Oil


