-- Posted Friday, 1 March 2013 | | Disqus
| Close | Gain/Loss | On Week |
Gold | $1575.60 | -$4.80 | -0.31% |
Silver | $28.57 | +$0.08 | -0.66% |
XAU | 133.29 | -0.70% | -2.21% |
HUI | 351.78 | -0.70% | -2.18% |
GDM | 1032.69 | -0.63% | -2.14% |
JSE Gold | 1888.66 | -20.18 | -2.85% |
USD | 82.29 | +0.33 | +1.06% |
Euro | 130.22 | -0.34 | -1.24% |
Yen | 106.89 | -1.04 | +0.15% |
Oil | $90.68 | -$1.37 | -2.63% |
10-Year | 1.853% | -0.035 | -5.80% |
Bond | 145.9375 | +0.65625 | +1.35% |
Dow | 14089.66 | +0.25% | +0.64% |
Nasdaq | 3169.74 | +0.30% | +0.25% |
S&P | 1518.20 | +0.23% | +0.17% |
The Metals:
Gold edged up to $1582.05 in Asia before it fell to see a $15.49 loss at $1564.91 at about 5AM EST and then stormed back to as high as $1587.20 at about 9AM EST, but it then fell back off into the close and ended with a loss of 0.31%. Silver surged to as high as $28.765 in early New York trade before it also fell back off, but it still ended with a gain of 0.28%.
Euro gold fell to about 1210, platinum lost $13 to $1569, and copper fell four cents to about $3.49.
Gold and silver equities traded mostly slightly lower and ended with modest losses.
The Economy:
Report | For | Reading | Expected | Previous |
Personal Income | Jan | -3.6% | -2.4% | 2.6% |
Personal Spending | Jan | 0.2% | 0.2% | 0.1% |
PCE Prices - Core | Jan | 0.1% | 0.2% | 0.0% |
Michigan Sentiment | Feb | 77.6 | 76.3 | 76.3 |
ISM Index | Feb | 54.2 | 52.4 | 53.1 |
Construction Spending | Jan | -2.1% | 0.5% | 1.1% |
All of this weeks other economic reports:
Next weeks economic highlights include ISM Services on Tuesday, ADP Employment, Factory Orders, and the feds Beige Book on Wednesday, Initial Jobless Claims, the Trade Balance, Productivity, Unit Labor Costs, and Consumer Credit on Thursday, and Februarys jobs data and Wholesale Inventories on Friday.
The Markets:

Charts Courtesy of http://finance.yahoo.com/
Oil fell as the U.S. dollar index and treasuries rose on poor economic data out of Europe.
The Dow, Nasdaq, and S&P found modest gains on better than estimated data on consumer confidence and manufacturing in the US.
Among the big names making news in the market Friday were Cnooc, Taco Bell, and Best Buy
The Commentary:
Here we are at the end of yet another month during which the mining shares have lost ground. This makes five months in a row of lower prices.
Given the continued weakness in the sector, I thought it helpful to try to take a look at the monthly chart to see how things now stand from a technical analysis standpoint.
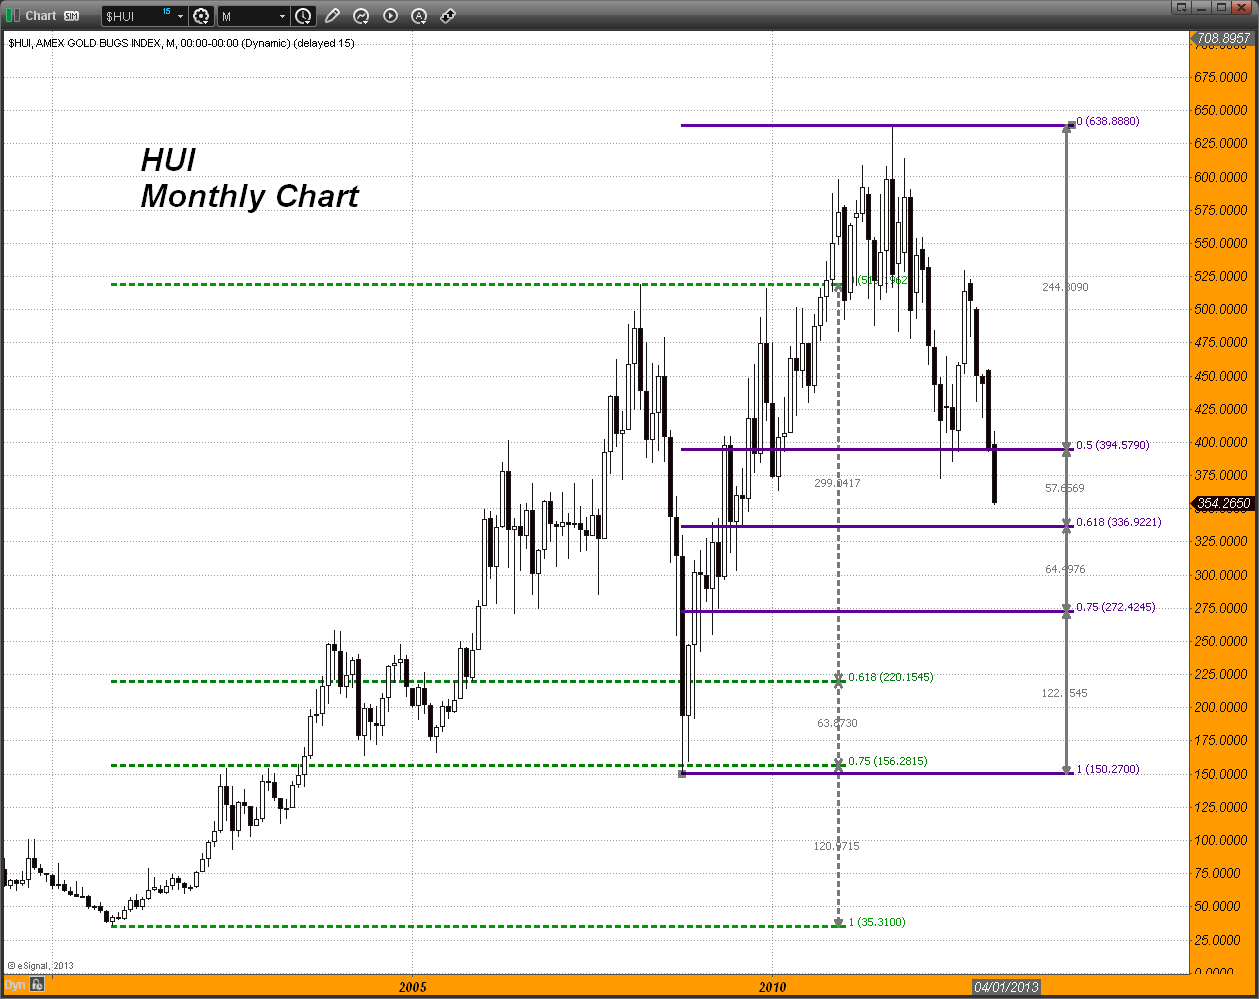
Comparing this downleg that began back in September 2011 to the previous downleg that came on the heels of the inception of the credit crisis of 2008, we can see some similarities. I am using standard Fibonacci retracement levels for comparison's sake.
If we look first at the 2008 selloff, we can see that it occurred over an 8 month period in which prices peaked in March of 2008 and then bottomed in October of that same year. The retracement in prices broke all of the important Fibonacci levels including the 50% retracement level AND the 61.8% level. It was not until prices hit the last remaining retracement level at 75% that the bottom was formed.
Looking at this decline, which began in Sep. 2011 and has been ongoing for 17 months now (with only 6 months that prices closed higher) we can see that while the 50% retracement level has been violated (it was taken out this month after having served as support ), the 61.8% level has not. That level currently comes in near 337. At this point, given the monthly close near the monthly low, odds favor a move towards this level.
This must hold the decline or price will more than likely move to the 75% retracement level down near 272. I know that is difficult to fathom, but that is what the pure technicals would indicate if 336 or so cannot hold this thing.
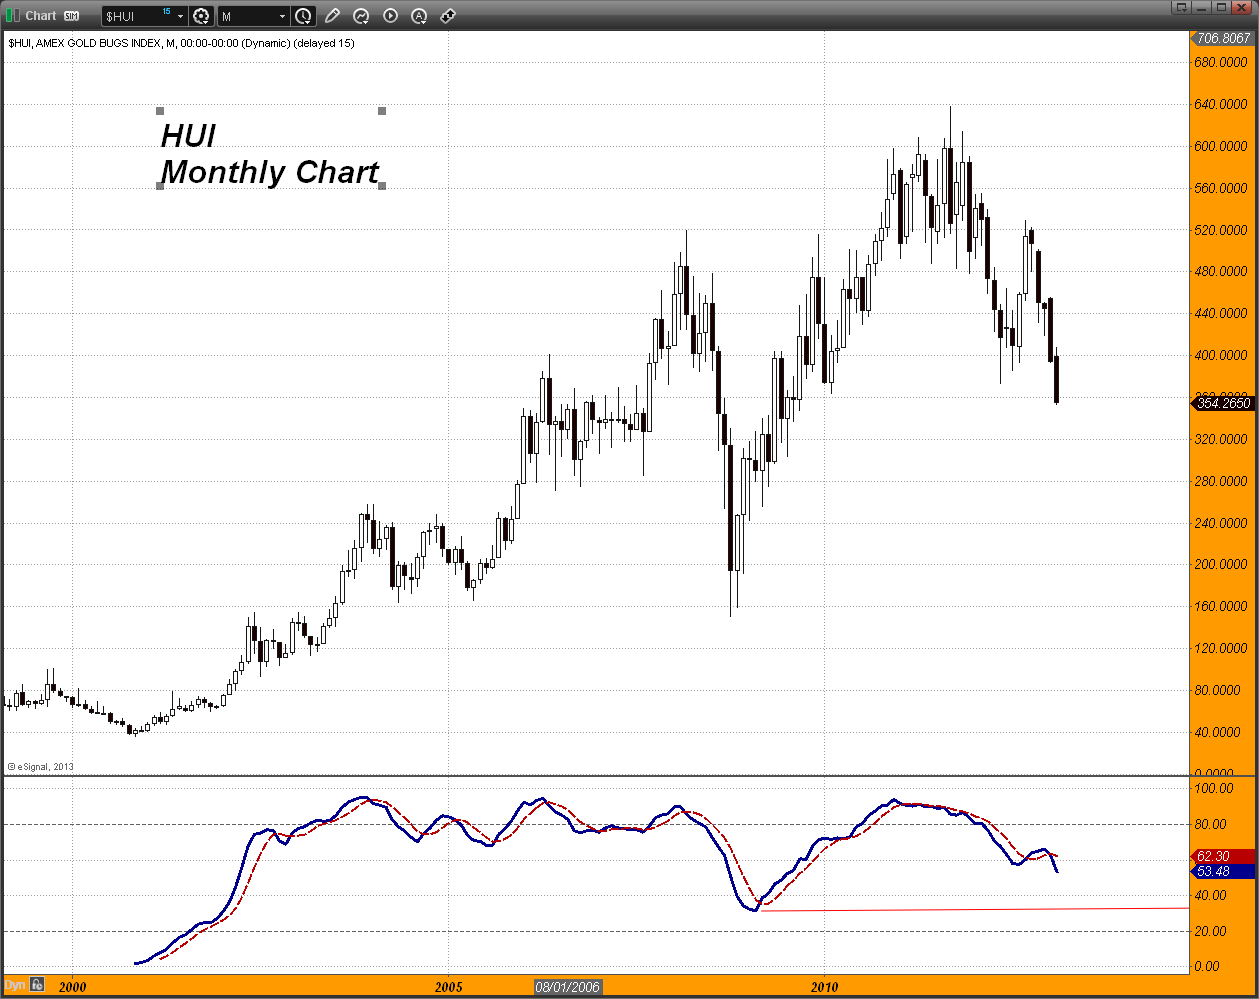
Looking at a technical indicator that has generated fairly reliable signals, the thing that stands out to me is that the 2008 sell off produced the lowest oversold reading to date. What is a bit disturbing is that the recent selloff has not moved the indicator down towards the same level that produced the 2008 bottom. In other words, it has more downside possible in a straight up head to head comparison.
I should note here that the 2008 low in the HUI corresponded to 680-700 gold. Gold is obviously nowhere near that level today but it is the ratio that we are interested in, not the outright price.
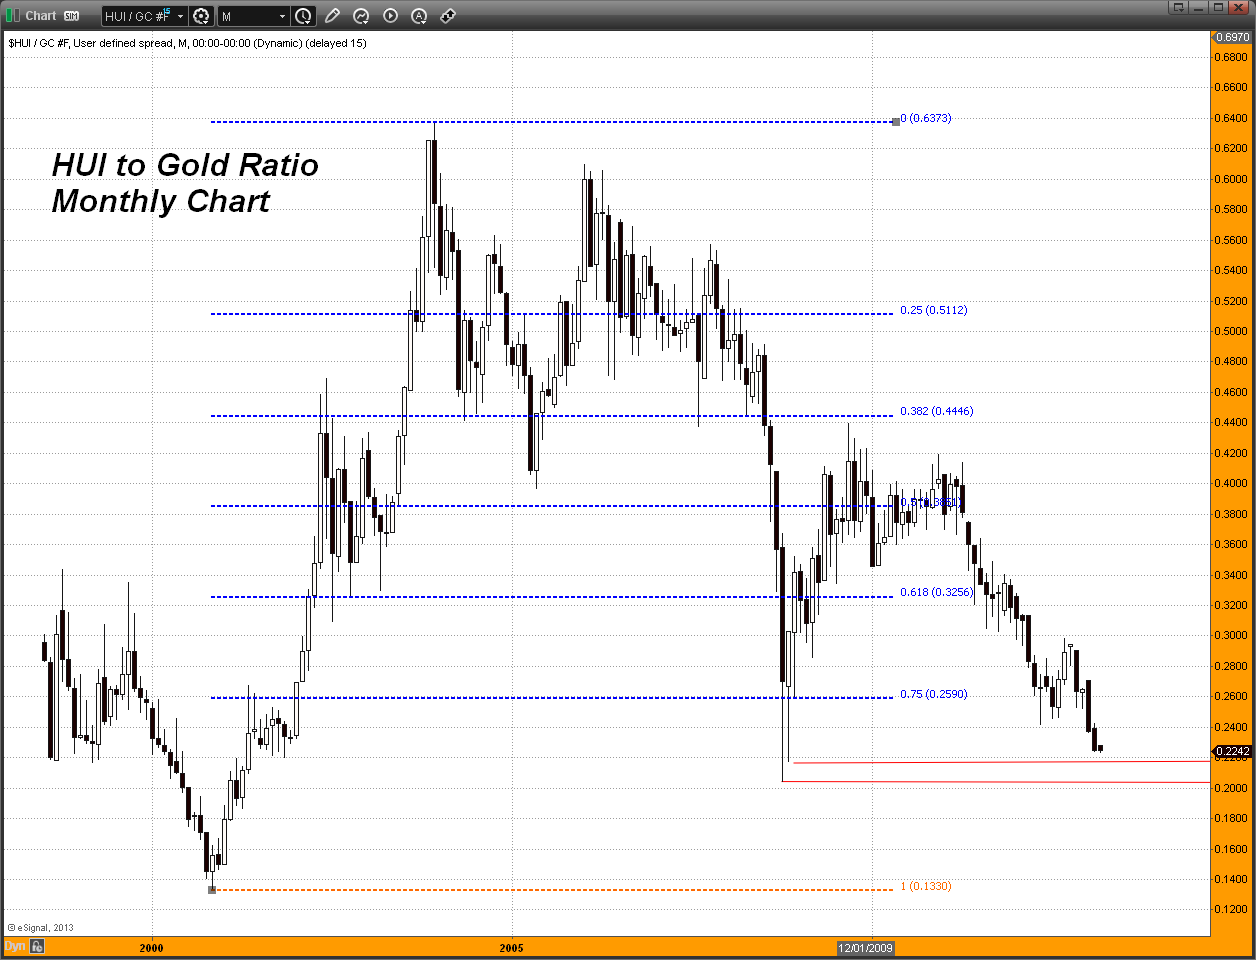
The HUI/Gold Ratio Chart indicates a continuation of what has now become a 23 month long trend of the mining shares underperforming or losing ground against the price of the actual metal. During the height or should I say "depth" of the credit crisis in 2008, this ratio hit a low near .2040 before it actually rebounded closing that month of October 2008 at .2699. The following month it moved as low as .2174 before closing higher at .3031.
Let's assume for the sake of argument that the ratio, which at the present time stands at .2242, does hit the same low level made back in October 2008 of .2040. Let's also assume that the HUI stops falling and remains for some time at the closing price of today which is 354. That means that the gold price would have to move back up to $1735 to have this ratio hit the same low that it made back in 2008.
Another assumption could be that the gold price stabilizes here at, let's call it $1580 but the HUI continues selling off. The index would then have to fall as low as 322 to yield us the same ratio low made in 2008. I will refer you back to the first two charts in this post and you can see, that a move towards at least 336 is possible in this index. If gold did not move at all from $1580 and the index dropped to 336, the HUI to Gold ratio would then be .2121. That is actually lower than the second worst reading in 2008 which came in November where it did hit .2174 before the rebound.
Another possibility is that the HUI would have to fall further down with the gold price falling along with it. Obviously there are several different scenarios but let's just say for now that none of them look particularly encouraging.
The big question, which none of us really know, is whether or not this ratio is going to have to move back towards the lows made in 2008 before these shares can put in a lasting bottom.
Note that I included some Fibonacci retracement levels on the ratio chart to show you that while the ratio did violate the last Fibonacci retracement level possible, the 75% level, that it did close both the month of October 2008 and November 2008 above that level.
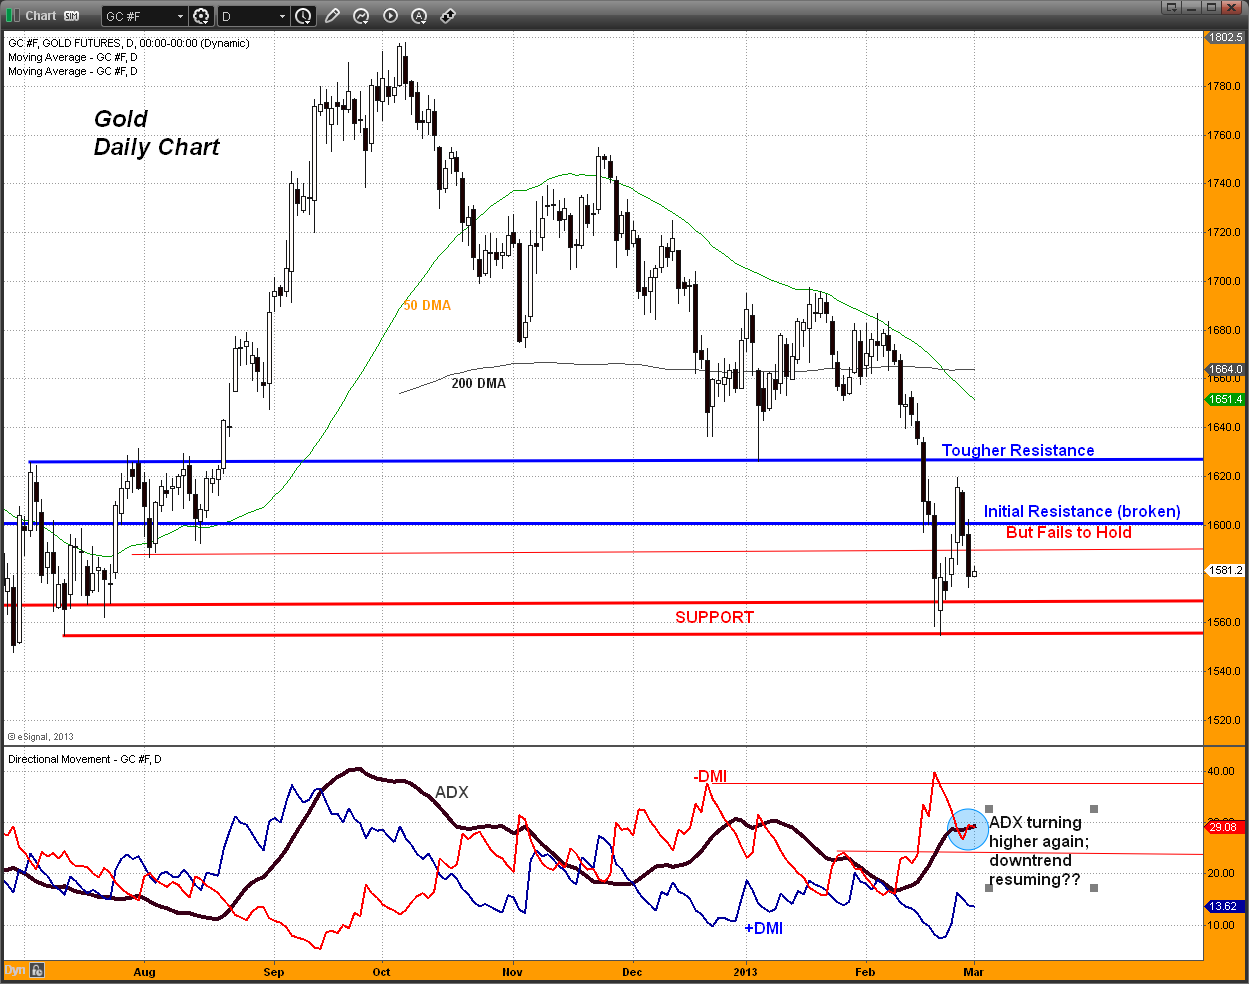
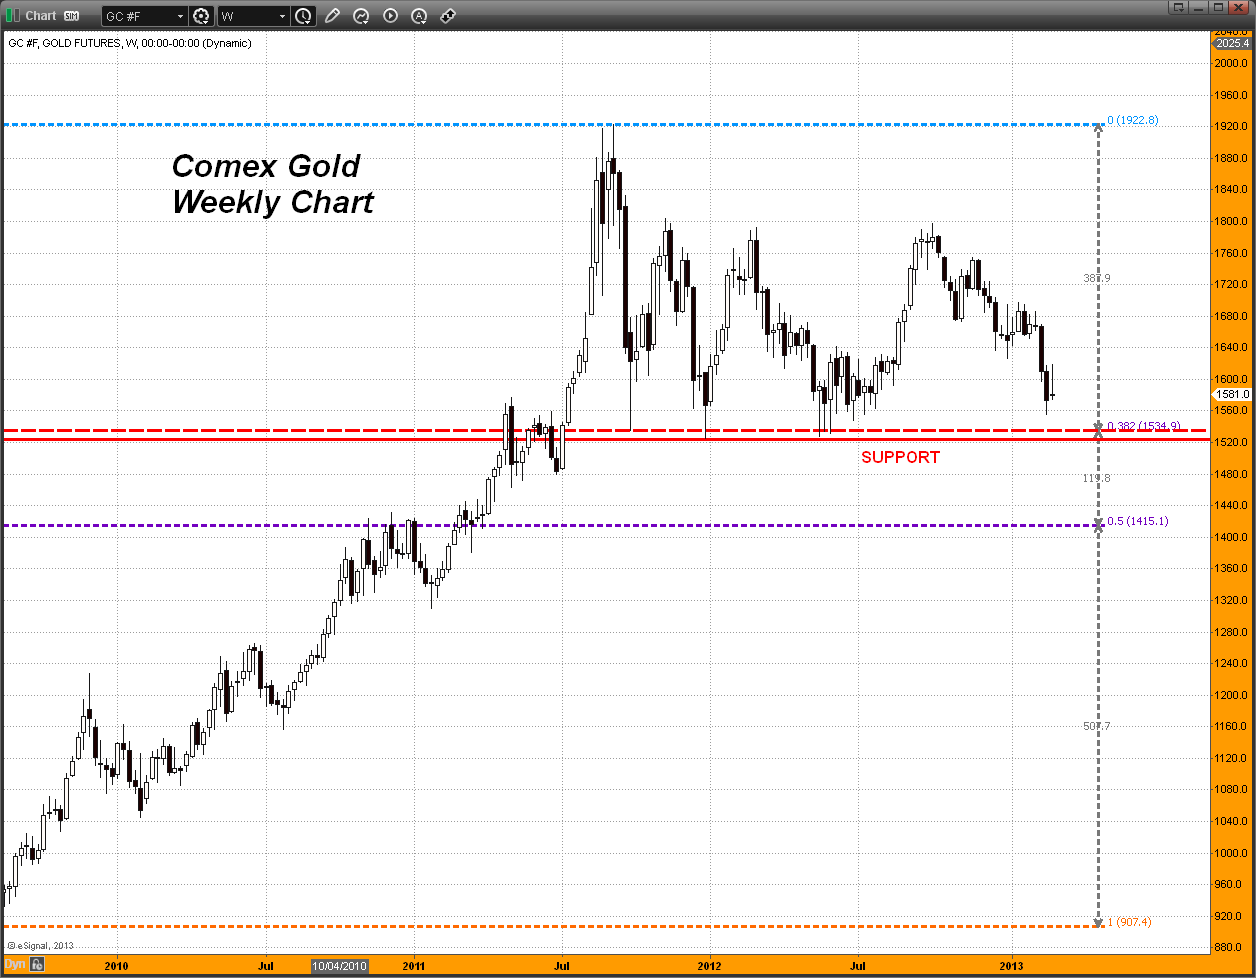
Lastly here are some price charts for the actual metal. I cannot emphasize enough how critical it is that gold does not violate the support levels shown on this chart.
A WEEKLY CLOSE below the last level of support near $1525 - $1520 would do very serious damage to even the long term trend in gold and would suggest a deeper retracement. Note that the 38.2% Fibonacci retracement level on this weekly chart comes in precisely at the horizontal support level I have lined out on the chart. That is near $1534 - $1535. That is the first level of support. Just below that is $1520. There is nothing, and I mean nothing that I can see on this chart with the exception of a bit of a blip near $1480 that could stop the price from testing the 50% retracement level near $1415 should the red support lines give way.
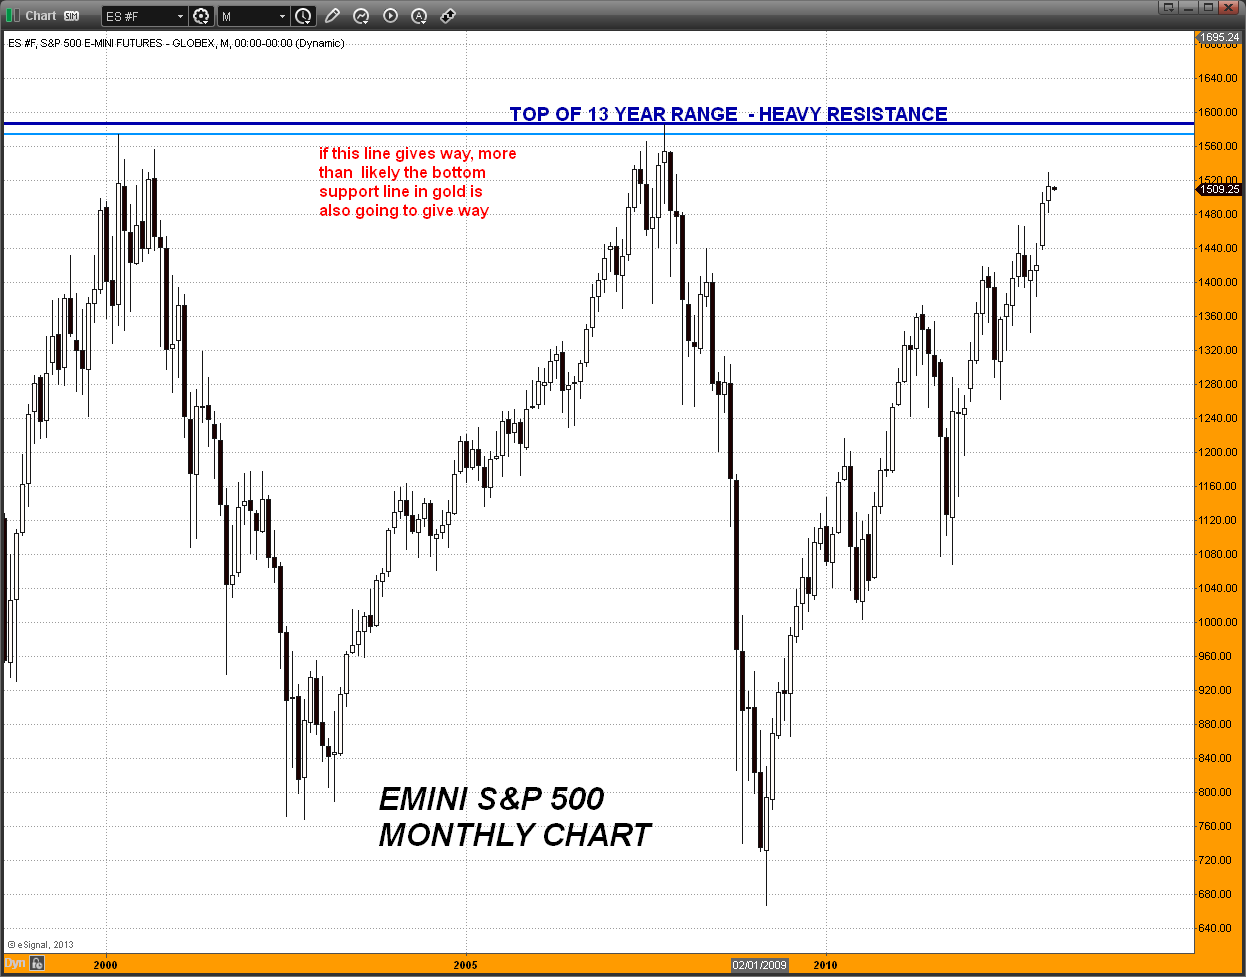
My suspicions are that if the S&P 500 takes out its overhead support resistance near 1520-1530 on a weekly basis, gold will take out that $1535- $1520 support level on the downside. I hope not, but we have to be objective and try to see this thing for what it is at the current time. Do you not find it ironic that in both cases, the S&P with 1520-1530 on the top as resistance and gold with 1530-1520 on the bottom as support that the resistance and support numbers that mark both markets are identical except in reverse?
Markets can change very rapidly, especially in this age of the infernal computer algorithm, but gold needs something to bring back its sponsorship among the big players. Let's see what the month of March will bring us. Perhaps it will come in like a lamb and go out like a lion for gold. We shall see...- Dan Norcini, More at http://www.traderdannorcini.blogspot.com/
GATA Posts:

Jeff Nielson: Smaller gold mining companies can be more profitable than big ones
Interviewed by TF Metals Report, Jaitly and Maguire cite rising backwardation in gold
'Checkmate' for gold against the dollar
The Statistics:
As of close of business: 2/27/2013
Gold Warehouse Stocks: | 10,289,334.052 | -96,092.765 |
Silver Warehouse Stocks: | 162,829,958.983 | -101,590.99 |
Global Gold ETF Holdings
[WGC Sponsored ETFs]

| Product name | Total Tonnes | Total Ounces | Total Value |
New York Stock Exchange Arca (NYSE Arca) AND Singapore Exchange (SGX) AND Tokyo Stock Exchange (TSE) AND Hong Kong Stock Exchange (HKEx) | SPDR® Gold Shares | 1254.487 | 40,333,004 | US$64,042m |
London Stock Exchange (LSE) AND NYSE Euronext Paris AND Borsa Italiana AND Frankfurter Wertpapierbörse (Deutsche Börse - Xetra) | Gold Bullion Securities | 138.13 | 4,441,056 | US$7,012m |
London Stock Exchange (LSE) AND NYSE Euronext Paris AND Borsa Italiana AND Frankfurter Wertpapierbörse (Deutsche Börse - Xetra) AND NYSE Euronext Amsterdam | ETFS Physical Gold | 152.66 | 4,908,200 | US$8,004m |
Australian Stock Exchange (ASX) | Gold Bullion Securities | 11.16 | 358,789 | US$567m |
Johannesburg Securities Exchange (JSE) | New Gold Debentures | 42.45 | 1,364,715 | US$2,214m |
Note: Change in Total Tonnes from yesterdays data: SPDR subtracted 3.913 tonnes.
COMEX Gold Trust (IAU) Total Tonnes in Trust: 215.30: No change from yesterdays data.
Silver Trust (SLV) Total Tonnes in Trust: 10,638.84: +21.05 change from yesterdays data.
The Miners:
Freeports (FCX) priced notes, Golden Minerals (AUMN) year-end results, and Huldra Silvers (HDA.V) received payments were among the big stories in the gold and silver mining industry making headlines Friday.
WINNERS
1. Turquoise | TRQ +11.01% $7.06 |
2. New Gold | NGD +5.11% $9.26 |
3. Gold Reserve | GRZ +3.85% $2.70 |
LOSERS
1. Tanzanian Royalty | TRX -8.52% $3.22 |
2. Almaden | AAU -7.08% $1.97 |
3. Banro | BAA -6.14% $2.14 |
Winners & Losers tracks NYSE and AMEX listed gold and silver mining stocks that trade over $1.
Please see Yahoos Mining/Metals News Wire for all of todays mining news.
- Chris Mullen, Gold Seeker Report
- Would you like to receive the Free Daily Gold Seeker Report in your e-mail? Click here
Additional Resources for todays Gold Seeker Report can be found:
© Gold Seeker 2013
Note: This article may be reproduced provided the article, in full, is used and mention to Gold-Seeker.com is given.
Disclosure: The owner, editor, writer and publisher and their associates are not responsible for errors or omissions. The author of this report is not a registered financial advisor. Readers should not view this material as offering investment related advice. Gold-Seeker.com has taken precautions to ensure accuracy of information provided. Information collected and presented are from what is perceived as reliable sources, but since the information source(s) are beyond Gold-Seeker.coms control, no representation or guarantee is made that it is complete or accurate. The reader accepts information on the condition that errors or omissions shall not be made the basis for any claim, demand or cause for action. Past results are not necessarily indicative of future results. Any statements non-factual in nature constitute only current opinions, which are subject to change. Nothing contained herein constitutes a representation by the publisher, nor a solicitation for the purchase or sale of securities & therefore information, nor opinions expressed, shall be construed as a solicitation to buy or sell any stock, futures or options contract mentioned herein. Investors are advised to obtain the advice of a qualified financial & investment advisor before entering any financial transaction.
-- Posted Friday, 1 March 2013 | Digg This Article | Source: GoldSeek.com


 Gold Seeker Weekly Wrap-Up: Gold and Silver End Slightly Lower on the Week


