-- Posted Friday, 19 April 2013 | | Disqus
| Close | Gain/Loss | On Week |
Gold | $1400.90 | +$12.90 | -5.86% |
Silver | $23.18 | +$0.01 | -11.39% |
XAU | 102.88 | +1.15% | -11.59% |
HUI | 268.41 | +1.56% | -10.94% |
GDM | 791.91 | +1.32% | -11.30% |
JSE Gold | 1502.99 | +64.85 | -7.43% |
USD | 82.72 | +0.15 | +0.66% |
Euro | 130.55 | +0.05 | -0.36% |
Yen | 100.45 | -1.41 | -0.85% |
Oil | $88.01 | +$0.28 | -3.59% |
10-Year | 1.703% | +0.018 | -1.05% |
Bond | 148.15625 | -0.28125 | +0.42% |
Dow | 14547.51 | +0.07% | -2.14% |
Nasdaq | 3206.06 | +1.25% | -2.70% |
S&P | 1555.25 | +0.88% | -2.11% |
The Metals:
Gold jumped $36.80 to $1424.80 in Asia before it fell all of the way back to $1391.70 in early afternoon New York trade, but it then bounced back higher in the last few hours of trade and ended with a gain of 0.93%. Silver surged to as high as $23.833 before it fell back to $22.99 and then also bounced back higher, but it ended with a gain of just 0.04%.
Euro gold climbed to about 1073, platinum gained $0.50 to $1424, and copper fell five cents to about $3.15.
Gold and silver equities rose over 2% at the open before they fell to see slight losses in early afternoon trade, but they then rallied back higher into the close and ended with over 1% gains.
The Economy:
All of this weeks economic reports:
NAHB Housing Market Index - April | 42 v. 44 |
Next weeks economic highlights include Existing Home Sales on Monday, the FHFA Housing Price Index and New Home Sales on Tuesday, Durable Goods Orders on Wednesday, Initial Jobless Claims on Thursday, and GDP and Michigan Sentiment on Friday.
The Markets:

Charts Courtesy of http://finance.yahoo.com/
Oil found slight gains on the prospects for an output cut from the Organization of the Petroleum Exporting Countries.
The U.S. dollar index rose as the yen fell after Japan said the Group of 20 countries did not oppose its aggressive monetary easing aimed at beating deflation rather than weakening the currency.
Treasuries fell as the Nasdaq and S&P rose on mostly better than expected earnings reports, but the Dow struggled to find gains on disappointing reports from McDonald's and General Electric.
Among the big names making news in the market Friday were McDonalds, AIG, Blackstone, GE, Chipotle, Honeywell, and SeaWorld.
The Commentary:
The Russell 2000, an index of smaller cap stocks, has been a pretty decent indicator of investors' sentiment towards the risk trade or the "improving global economy" trade.
It tended to outperform the broader market as stocks went on a maddening tear higher with the unleashing of the Fed's QE programs. Those combined with the ECB bond buying program in the Euro zone and now, the conjunction of the Bank of Japan's bond buying policy, had gotten investors in a tizzy to chase stocks higher no matter what the economic news was.
In a case of "Heads - I win" or "Tails - You lose" if the economic news was improving, stocks went higher on talk about the improving economy. If the economic news was bad, stocks went higher anyway because equity perma bulls could point to the lousy data as evidence that the QE programs would continue. Regardless, it was "BUY, BUY, and BUY"; no questions asked.
Suddenly, the bottom began to drop out of various commodity markets, most notably copper and of course gold and silver. But even crude oil and gasoline had been breaking down on their charts to the extent that the entire CCI, Continuous Commodity Complex has been swooning. There does come a point where even the most die hard stock bull has to start wondering how long his or her market can continue to levitate in the face of one piece of evidence after another that all is not well in La-La Land.
While we are seeing another miraculous recovery in stocks today, even as copper sinks further into bear market territory, that rally cannot hide the deterioration that is now solidly entrenched on the technical price charts.
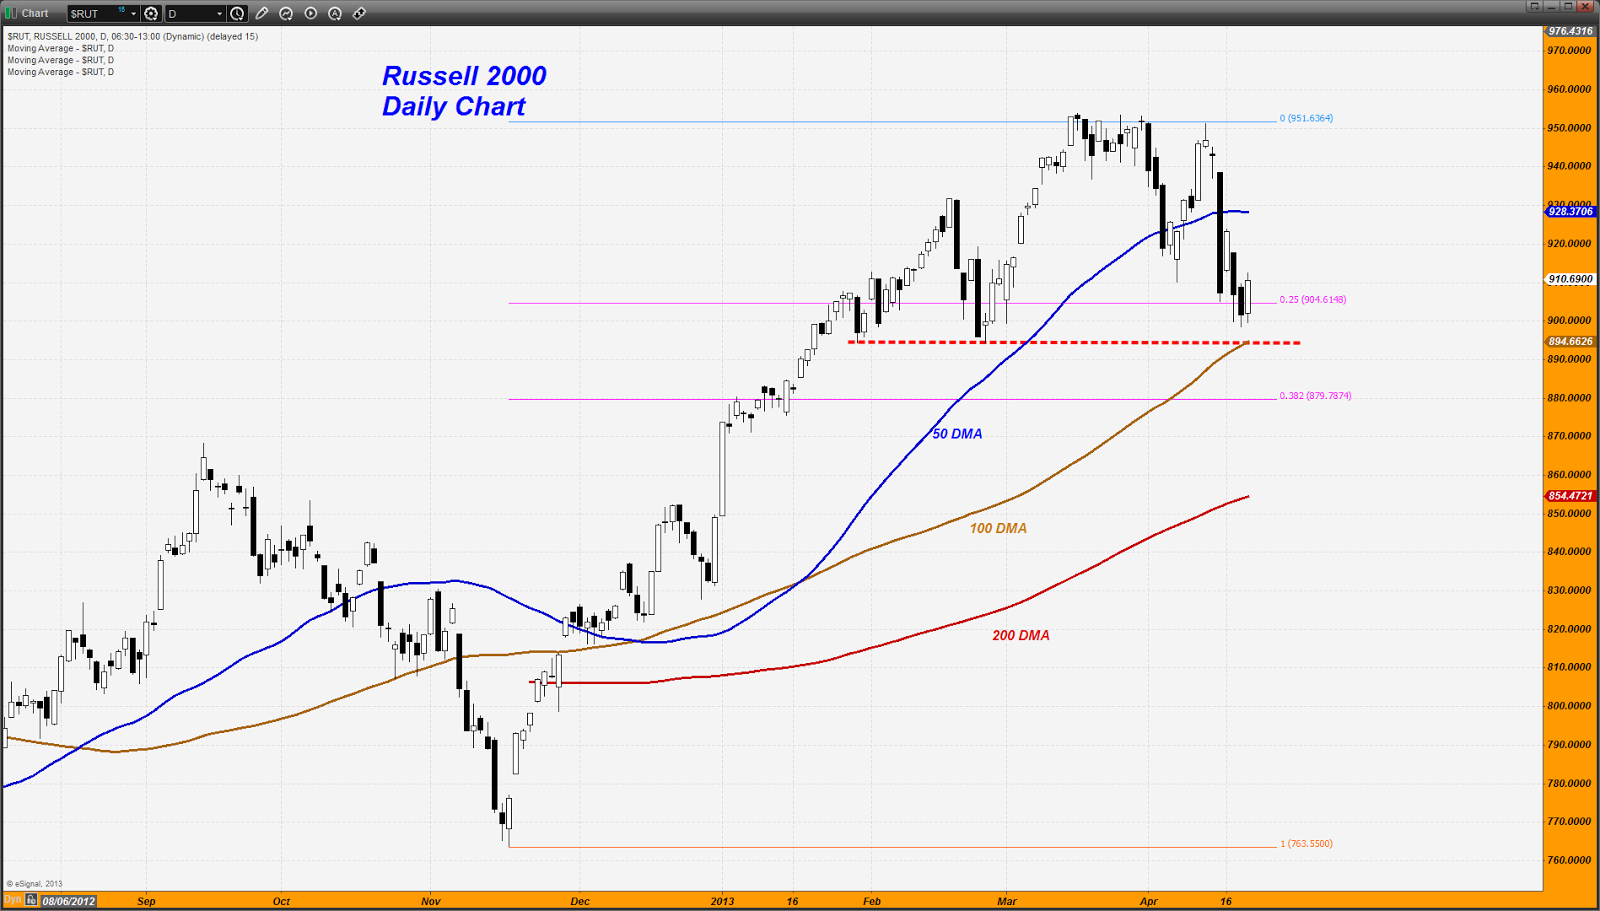
Take a look at this Russell 2000 daily chart. It had fallen below the very important 50 day moving average early this month but managed to recover and rally back to near the recent high. Instead of attracting buying however, it began to attract selling. The result was a technical failure that has sent this index lower. This week, on Monday, the index broke firmly below the 50 day moving average again. After a feeble attempt at moving higher, it swooned on Wednesday and continued lower Thursday. Here, we are seeing what we have come to expect at this point on a Friday - the equity markets are miraculously saved from even more severe chart breakdowns just in the nick of time (PPT anyone?).
That being said, the index has now been trading below the 50 day moving average the entire week. The longer it stays below that average, the more likely it is going to break down further. I have noted two additional important moving averages, the 100 day and the 200 day. Notice that the horizontal support line I have shown in dotted red, come in exactly at the 100 day. That seems a logical target for this market at this point.
If this index falls below that level and cannot get back over it within the same week, I believe we are going to see a much more severe downdraft in the equity markets commence. What this will be telling us is that a growing number of stock investors will be turning bearish on equities even in the face of all this QE stimulus coming from both the Fed and the Bank of Japan. In other words, the investor world will be sending a signal that it no longer believes the bond buying programs are going to have any efficacy on creating any kind of serious growth!
Also note something that we have not seen in quite a while (early November of last year - remember when the "fiscal cliff" thing was all the rage), namely, the 50 day moving average is now turning lower. That bears watching.
Something else I have noted in my personal studies but will not post here is that the Homebuilders ETF, XHB, shows a chart pattern that is almost identical to this one. The same things that were said about the Russell 2000 apply to the XHB, it has been a strong performer to the upside as the housing sector has been seeing some signs of activity based on the availability of cheap mortgage money. If the housing market does roll over, this economy is in serious, and I mean serious trouble. I personally believe that this is what Dr. Copper has been forecasting.
This is the reason that I feel silver is having trouble even as gold has been showing good resiliency down here. The selling in copper is simply too much for the silver market (paper) right now as investors are selling base and industrial metals as they bet on slowing growth.
Today's Commitment of Traders report for copper shows the hedge funds still net short by a 2:1 margin. The report picked up the short covering among these big traders down below 3.25 on Monday and Tuesday but it did not catch the ferocious selling that hit this market the remainder of this week. My guess is that they went right back onto the short side in larger quantities again.- Dan Norcini, More at http://www.traderdannorcini.blogspot.com/
The Statistics:
Activity from: 4/18/2013
Gold Warehouse Stocks: | 8,917,900.530 | -32,496.907 |
Silver Warehouse Stocks: | 166,257,782.450 | +903,343.651 |
Global Gold ETF Holdings
[WGC Sponsored ETFs]

| Product name | Total Tonnes | Total Ounces | Total Value |
New York Stock Exchange Arca (NYSE Arca) AND Singapore Exchange (SGX) AND Tokyo Stock Exchange (TSE) AND Hong Kong Stock Exchange (HKEx) | SPDR® Gold Shares | 1132.986 | 36,426,619 | US$51,180m |
London Stock Exchange (LSE) AND NYSE Euronext Paris AND Borsa Italiana AND Frankfurter Wertpapierbörse (Deutsche Börse - Xetra) | Gold Bullion Securities | 138.13 | 4,441,056 | US$6,217m |
London Stock Exchange (LSE) AND NYSE Euronext Paris AND Borsa Italiana AND Frankfurter Wertpapierbörse (Deutsche Börse - Xetra) AND NYSE Euronext Amsterdam | ETFS Physical Gold | 152.66 | 4,908,200 | US$8,004m |
Australian Stock Exchange (ASX) | Gold Bullion Securities | 11.16 | 358,789 | US$502m |
Johannesburg Securities Exchange (JSE) | New Gold Debentures | 42.45 | 1,364,715 | US$2,214m |
Note: Change in Total Tonnes from yesterdays data: SPDR subtracted 1.805 tonnes.
COMEX Gold Trust (IAU) Total Tonnes in Trust: 197.28: -3.19 change from yesterdays data.
Silver Trust (SLV) Total Tonnes in Trust: 10,451.01: No change from yesterdays data.
The Miners:
WINNERS
1. Rubicon | RBY +9.33% $1.64 |
2. Turquoise | TRQ +8.46% $5.64 |
3. Banro | BAA +7.62% $1.13 |
LOSERS
1. Paramount | PZG -5.16% $1.47 |
2. Golden Minerals | AUMN-2.47% $1.58 |
3. Seabridge | SA -1.87% $10.48 |
Winners & Losers tracks NYSE and AMEX listed gold and silver mining stocks that trade over $1.
Please see Yahoos Mining/Metals News Wire for all of todays mining news.
- Chris Mullen, Gold Seeker Report
- Would you like to receive the Free Daily Gold Seeker Report in your e-mail? Click here
Additional Resources for todays Gold Seeker Report can be found:
© Gold Seeker 2013
Note: This article may be reproduced provided the article, in full, is used and mention to Gold-Seeker.com is given.
Disclosure: The owner, editor, writer and publisher and their associates are not responsible for errors or omissions. The author of this report is not a registered financial advisor. Readers should not view this material as offering investment related advice. Gold-Seeker.com has taken precautions to ensure accuracy of information provided. Information collected and presented are from what is perceived as reliable sources, but since the information source(s) are beyond Gold-Seeker.coms control, no representation or guarantee is made that it is complete or accurate. The reader accepts information on the condition that errors or omissions shall not be made the basis for any claim, demand or cause for action. Past results are not necessarily indicative of future results. Any statements non-factual in nature constitute only current opinions, which are subject to change. Nothing contained herein constitutes a representation by the publisher, nor a solicitation for the purchase or sale of securities & therefore information, nor opinions expressed, shall be construed as a solicitation to buy or sell any stock, futures or options contract mentioned herein. Investors are advised to obtain the advice of a qualified financial & investment advisor before entering any financial transaction.
-- Posted Friday, 19 April 2013 | Digg This Article | Source: GoldSeek.com


 Gold Seeker Weekly Wrap-Up: Gold and Silver Fall About 6% and 11% on the Week


