-- Posted Monday, 22 April 2013 | | Disqus
| Close | Gain/Loss |
Gold | $1425.40 | +$24.50 |
Silver | $23.37 | +$0.19 |
XAU | 104.28 | +1.36% |
HUI | 272.41 | +1.49% |
GDM | 803.02 | +1.40% |
JSE Gold | 1520.87 | +17.88 |
USD | 82.65 | -0.07 |
Euro | 130.62 | +0.10 |
Yen | 100.72 | +0.22 |
Oil | $88.76 | +$0.75 |
10-Year | 1.698% | -0.005 |
T-Bond | 148.1875 | +0.0625 |
Dow | 14567.17 | +0.14% |
Nasdaq | 3233.55 | +0.86% |
S&P | 1562.50 | +0.47% |
The Metals:
Gold climbed $37.90 to $1438.80 at about 7:25AM EST before it fell back to $1418.70 over the next few hours of trade, but it then bounced back higher in afternoon trade and ended with a gain of 1.75%. Silver climbed to as high as $23.685 before it fell back to $23.26, but it still ended with a gain of 0.82%.
Euro gold climbed to over 1091, platinum gained $8.50 to $1432.50, and copper fell a couple of cents to about $3.13.
Gold and silver equities saw about 2% gains at the open before they fell back to unchanged by midday, but they then rallied back higher in afternoon trade and ended with over 1% gains.
The Economy:
Report | For | Reading | Expected | Previous |
Existing Home Sales | Mar | 4.92M | 5.01M | 4.95M |
Tomorrow at 9AM EST brings the FHFA Housing Price Index for February and 10AM is the New Home Sales report for March expected at 415,000.
The Markets:

Charts Courtesy of http://finance.yahoo.com/
Oil ended higher in mixed trade on talk about possible OPEC cuts.
The U.S. dollar index ended slightly lower on poor home sales data that turned treasuries modestly higher.
The Dow, Nasdaq, and S&P found decent gains on Caterpillars optimistic talk about China.
Among the big names making news in the market today were News Corp., Boeing, and Caterpillar.
The Commentary:
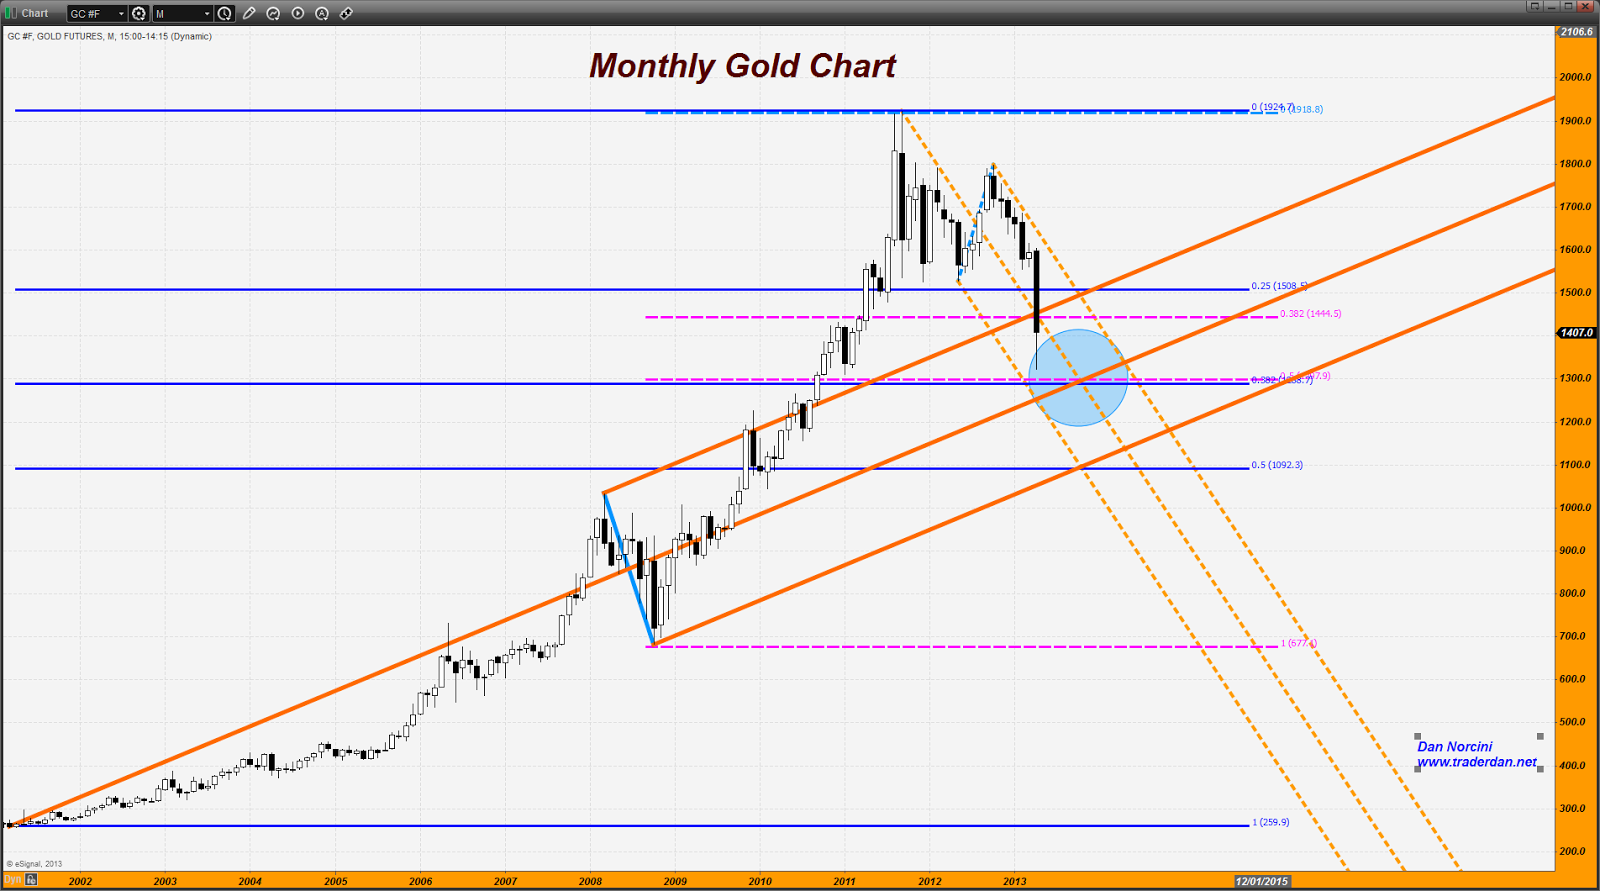
I wanted to see how this week's price action in gold would resolve itself so that I could do a bit of analysis on the market. Keep in mind that this is LONG TERM stuff. The nature of markets nowadays being what it is (they are run by hedge fund algorithms which do not think but just issue buy or sell orders automatically once certain trips are triggered) it helps to get a sense of where we are in the general scheme of things by looking at the larger picture to see if we can identify a long term trend.
I realize that the chart is cluttered but it needs to be in order to show the areas I have pinpointed that need some attention given to them. I have laid out TWO separate Fibonacci retracement patterns starting with the 2001 low and extending to the 2011 peak PLUS one starting with the 2008 low and running to that same 2011 peak up above $1900.
Then I have drawn in TWO separate pitchforks - one for use during the bullish phase and one for use during this now bearish phase.
I am interested in seeing the intersections between these various levels that are generated. Look at the area I have noted with an ellipse. It contains TWO Fibonacci retracement levels - the 38.2% retracement of the entire rally beginning in 2001 and the critical 50% retracement rally from the 2008-2011 rally. Can you see how those center around the $1300 level?
Now note the two pitchforks - the one uptrending, and the other downtrending and locate the intersection of the median or middle lines in both forks. Can you see how it come in right on top of the previously mentioned TWO Fibonacci retracement levels?
What does all this entrail reading denote? Simple - the area near and around the $1300 level is now critical for gold's fortunes as we move forward. I believe it has as much significance as the former support zone back up near the $1525 region.
If this region fails for any reason, gold is going to fall first to $1200 and then possibly $1100 - $1092. That would dovetail with the BEARISH FLAG FORMATION I have noted on a previously posted daily gold chart that would target another $200 drop if this week's low were to be violated on HEAVY VOLUME.
If the bulls can hold this market above this week's low but certainly above the $1300 level, then they stand a real chance of forcing a period of price consolidation or sideways movement. I believe it is too much to expect this market to ricochet sharply higher after the psychological beating that the bulls have received this past week.
While it is certainly encouraging to see the strong physical offtake that these lower prices are stimulating, it will require the return of the hedge funds to the long side of this market to take it sharply higher. for that to transpire, we must see fears of inflation displacing fears of deflation or slowing growth. Falling interest rates globally are showing that currently there exists no fear of inflation from Central Bank money creation at this point.
This week's Commitment of Traders report might be misleading to some because it shows Hedge Fund short covering occurring. Some might be tempted to think that they are abandoning the short side of the market. What needs to be understood is that gold plummeted over $200 in the matter of a couple of days. When it hit $1320, some shorts prudently booked some profits. The market then popped $40 off of that level. The next day, Tuesday, it fell back down to that $1320 level, but rebounded all the way back up towards $1400. That buying was SHORT COVERING on the part of the hedge funds. Once it showed that it was not going to break support, they rang the cash register on some short positions. They are however looking to sell rallies so they probably re-entered above $1400 during today's session (Friday).
We saw similar data in the COT for both silver and copper. Both of these metals showed that same short covering by the hedgies. In copper they covered some of their shorts below the $3.25 level on Monday and Tuesday. In silver, they covered some of their shorts on the steep fall towards $22. The trends in these metals are lower however and that means rallies will be sold by the speculative crowd dominated by the hedge funds.
To force some of these guys out of their short positions, it is going to take a concerted effort by the bulls to push price high enough to trigger their algorithms into buying. I am not sure where that catalyst might come from in the very near future. For starters I would need to see some sort of upside reversals in various commodity futures markets, notably copper and crude oil/gasoline and then the grains. In other words, the CCI would need to forge a bottom and show a definite upward turn with a trend change.
Fundamentally, we need to see a rise in real wages as well. Interest rates also would need to show a shift in the curve towards anticipation of inflation by the bond markets. They will pick it up long before the herd that looks only at equities figures it out.- Dan Norcini, More at http://www.traderdannorcini.blogspot.com/
 U.S. Stock Market Were starting to see the excess that is needed before a major top can be put in. As more of these types of headlines and predictions of higher and higher take hold, the more likely we can see the top (but not before).
Ive been advocating for quite some time now that what well end up seeing is a megaphone technical pattern (shown here back in January), which allows us to get to 15,000 or so on the DJIA. I suggest one consider a scale-up sell approach for general U.S. equities.
U.S. Bonds Spend a few dollars and read the new book The Coming Bond Market Collapse by Michael Pento
Gold It would be natural for a rebound to previous key support around $1,500 but theres nothing natural in the gold market. It would be nice to think the bad people have done their thing and moved on but I doubt it. However, lets enjoy this rebound and then see how much the Crimenex has left in its bag of tricks.
U.S. Dollar A 100+ yen is coming and the Euro still cant get out of its own way, yet the U.S. Dollar Index struggles. To me, this just confirms the secular bear market for the U.S. Dollar remains firmly in place and this is little more than a countertrend move.
Mining and Exploration Shares Dare I say bottom?- Peter Grandich, Grandich Letter
 My Dear Extended Family,
We must pay strict attention now to the action of the premiums in the physical market for gold as the index of golds emancipation. If premiums remain high, especially at these lower prices, or gain on gaining prices the evidence of an evolution in the gold market is at hand. That evolution appears to me to be one of the price setting mechanism transformation between now a virtual paper financial gold to a physical savings medium gold. That then portends the end of the domination of gold by central banks and their agents. It is as simple as remove the tool, and therefore remove the operators.
The recent absolutely transparent take down in the gold market by virtual paper financial gold operators will go down in their history as their swan song as it brought massive attention to, and caused the transformation between virtual paper financial gold and real savings medium gold demonstrated in a free market of premiums on physical. The free market for the premiums on physical gold is the golden bridge to free gold, breaking the ties that bind to the evil of debtor central banks.
As this trend grows amongst those that now see no in the system retirement account or in the system bank balance safe from the central planners application of "bail in," golds real nature will emerge. Gold is a symbol and mechanism of physical and spiritual freedom. It is only natural that its evolution is towards free gold.- Jim Sinclair, JSMineset.com
GATA Posts:

Quaintance and Brodsky: Imperial Constraint
The Statistics:
As of close of business: 4/19/2013
Gold Warehouse Stocks: | 8,781,909.512 | -135,991.018 |
Silver Warehouse Stocks: | 165,555,633.128 | -702,149.322 |
Global Gold ETF Holdings
[WGC Sponsored ETFs]

| Product name | Total Tonnes | Total Ounces | Total Value |
New York Stock Exchange Arca (NYSE Arca) AND Singapore Exchange (SGX) AND Tokyo Stock Exchange (TSE) AND Hong Kong Stock Exchange (HKEx) | SPDR® Gold Shares | 1123.058 | 36,107,452 | US$51,416m |
London Stock Exchange (LSE) AND NYSE Euronext Paris AND Borsa Italiana AND Frankfurter Wertpapierbörse (Deutsche Börse - Xetra) | Gold Bullion Securities | 138.13 | 4,441,056 | US$6,320m |
London Stock Exchange (LSE) AND NYSE Euronext Paris AND Borsa Italiana AND Frankfurter Wertpapierbörse (Deutsche Börse - Xetra) AND NYSE Euronext Amsterdam | ETFS Physical Gold | 152.66 | 4,908,200 | US$8,004m |
Australian Stock Exchange (ASX) | Gold Bullion Securities | 11.16 | 358,789 | US$511m |
Johannesburg Securities Exchange (JSE) | New Gold Debentures | 42.45 | 1,364,715 | US$2,214m |
Note: Change in Total Tonnes from yesterdays data: SPDR subtracted 9.928 tonnes.
COMEX Gold Trust (IAU) Total Tonnes in Trust: 196.98: -0.30 change from yesterdays data.
Silver Trust (SLV) Total Tonnes in Trust: 10,451.01: No change from yesterdays data.
The Miners:
Northern Dynastys (NAK) $80 million work program and Fortunas (FSM) drill results were among the big stories in the gold and silver mining industry making headlines today.
WINNERS
1. Avino | ASM +12.15% $1.20 |
2. Timmins | TGD +8.37% $2.59 |
3. Banro | BAA +7.08% $1.21 |
LOSERS
1. McEwen | MUX -5.67% $1.83 |
2. Fortuna | FSM -3.38% $2.86 |
3. Richmont | RIC -2.03% $1.93 |
Winners & Losers tracks NYSE and AMEX listed gold and silver mining stocks that trade over $1.
Please see Yahoos Mining/Metals News Wire for all of todays mining news.
- Chris Mullen, Gold Seeker Report
- Would you like to receive the Free Daily Gold Seeker Report in your e-mail? Click here
Additional Resources for todays Gold Seeker Report can be found:
© Gold Seeker 2013
Note: This article may be reproduced provided the article, in full, is used and mention to Gold-Seeker.com is given.
Disclosure: The owner, editor, writer and publisher and their associates are not responsible for errors or omissions. The author of this report is not a registered financial advisor. Readers should not view this material as offering investment related advice. Gold-Seeker.com has taken precautions to ensure accuracy of information provided. Information collected and presented are from what is perceived as reliable sources, but since the information source(s) are beyond Gold-Seeker.coms control, no representation or guarantee is made that it is complete or accurate. The reader accepts information on the condition that errors or omissions shall not be made the basis for any claim, demand or cause for action. Past results are not necessarily indicative of future results. Any statements non-factual in nature constitute only current opinions, which are subject to change. Nothing contained herein constitutes a representation by the publisher, nor a solicitation for the purchase or sale of securities & therefore information, nor opinions expressed, shall be construed as a solicitation to buy or sell any stock, futures or options contract mentioned herein. Investors are advised to obtain the advice of a qualified financial & investment advisor before entering any financial transaction.
-- Posted Monday, 22 April 2013 | Digg This Article | Source: GoldSeek.com


 Gold Seeker Closing Report: Gold and Silver Gain Almost 2% and 1%


