-- Posted Wednesday, 1 May 2013 | | Disqus
| Close | Gain/Loss |
Gold | $1458.70 | -$17.30 |
Silver | $23.63 | -$0.63 |
XAU | 107.26 | -1.91% |
HUI | 277.73 | -2.13% |
GDM | 822.98 | -2.11% |
JSE Gold | 1497.98 | -42.70 |
USD | 81.63 | -0.09 |
Euro | 131.85 | +0.18 |
Yen | 102.78 | +0.14 |
Oil | $91.03 | -$2.43 |
10-Year | 1.639% | -0.036 |
T-Bond | 149.34375 | +0.96875 |
Dow | 14700.95 | -0.94% |
Nasdaq | 3299.12 | -0.89% |
S&P | 1582.70 | -0.93% |
The Metals:
Gold fell $35.80 to as low as $1440.20 at about noon EST before it jumped back to $1462.76 in the next few hours of trade, but it then fell back off again in the last hour of trade and ended with a loss of 1.17%. Silver slumped to as low as $23.24 and ended with a loss of 2.60%.
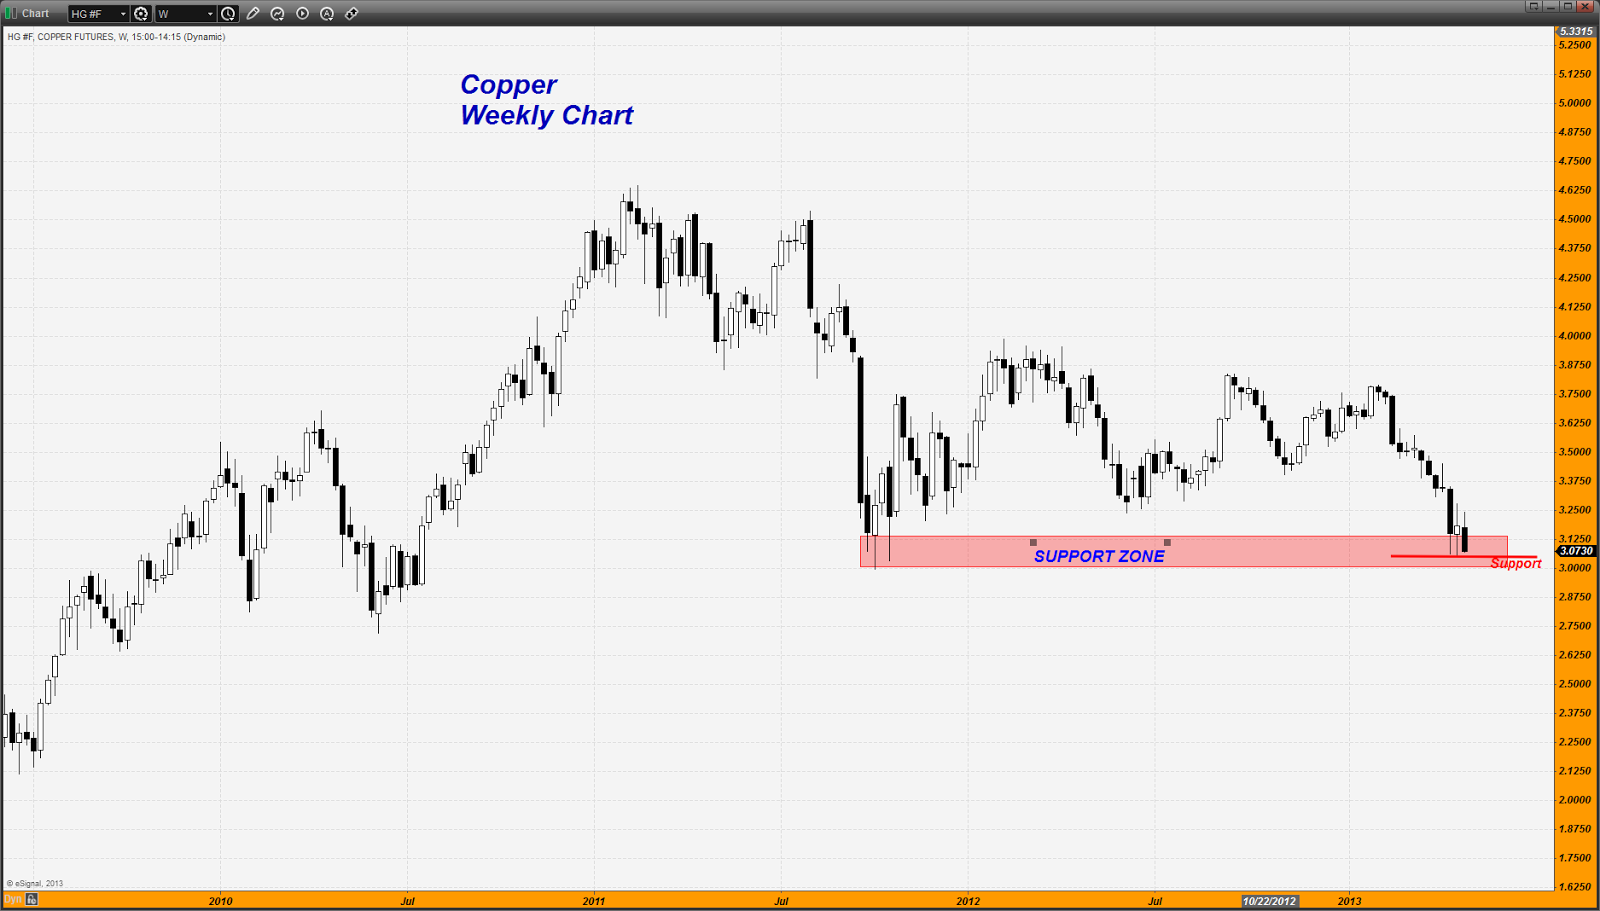
Euro gold fell to about 1107, platinum lost $28.50 to $1475, and copper dropped 11 cents to about $3.08.
Gold and silver equities fell about 4% by midday before they bounced back higher in early afternoon trade, but they still ended with about 2% losses.
The Economy:
Report | For | Reading | Expected | Previous |
ADP Employment | Apr | 119K | 155K | 131K |
ISM Index | Apr | 50.7 | 51.0 | 51.3 |
Construction Spending | Mar | -1.7% | 0.5% | 1.5% |
Mortgage refinance demand rose last week: MBA Reuters
The FOMC kept interest rates unchanged and said that:
The Committee is prepared to increase or reduce the pace of its purchases to maintain appropriate policy accommodation as the outlook for the labor market or inflation changes. In determining the size, pace, and composition of its asset purchases, the Committee will continue to take appropriate account of the likely efficacy and costs of such purchases as well as the extent of progress toward its economic objectives.
Tomorrow brings Initial Jobless Claims, Productivity, Unit Labor Costs, and the Trade Balance.
The Markets:

Charts Courtesy of http://finance.yahoo.com/
Oil fell after the Energy Information Administration reported that crude inventories rose 6.7 million barrels, gasoline inventories fell 1.8 million barrels, and distillates rose 500,000 barrels.
The U.S. dollar index fell along with the Dow, Nasdaq, and S&P on worse than expected economic data that sent treasuries higher.
Among the big names making news in the market today were Berkshire Hathaway, Teva, Viacom, Ebix, and Ford.
The Commentary:
China released its version of the PMI (Purchasers Management Index) today and the news was not good. Analysts had expected a reading of 50.9. What they got was 50.6. In all fairness, anything over 50.0 is considered expansion but this news, coupled with the recent slowing in their GDP number, has gotten investors/traders increasingly concerned about a global economic slowdown.
While China is growing, its RATE OF INCREASE IN GROWTH is not and a trend is what traders focus on.
Certainly, the base metals (copper, tin, lead, aluminum) all reacted negatively on this news. Copper fell down towards last week's lows and looks as if it might want to violate that critical region of chart support. Hedge funds are now pressing this metal solidly from the short and if the recent trend in the Commitment of Traders holds, they are liable to now be net short in silver. Unfortunately, this Friday's data release will not catch today's action but I would bet the farm that the hedge funds are shorting across a large number of commodity markets in increasing numbers.
I want to stress how important this support zone is that I have noted on the chart. If copper fails here to end the week, it is going to portend a definite slowdown in the global economy and one which I am of the opinion of, that not even the stock markets are going to be able to ignore any longer.
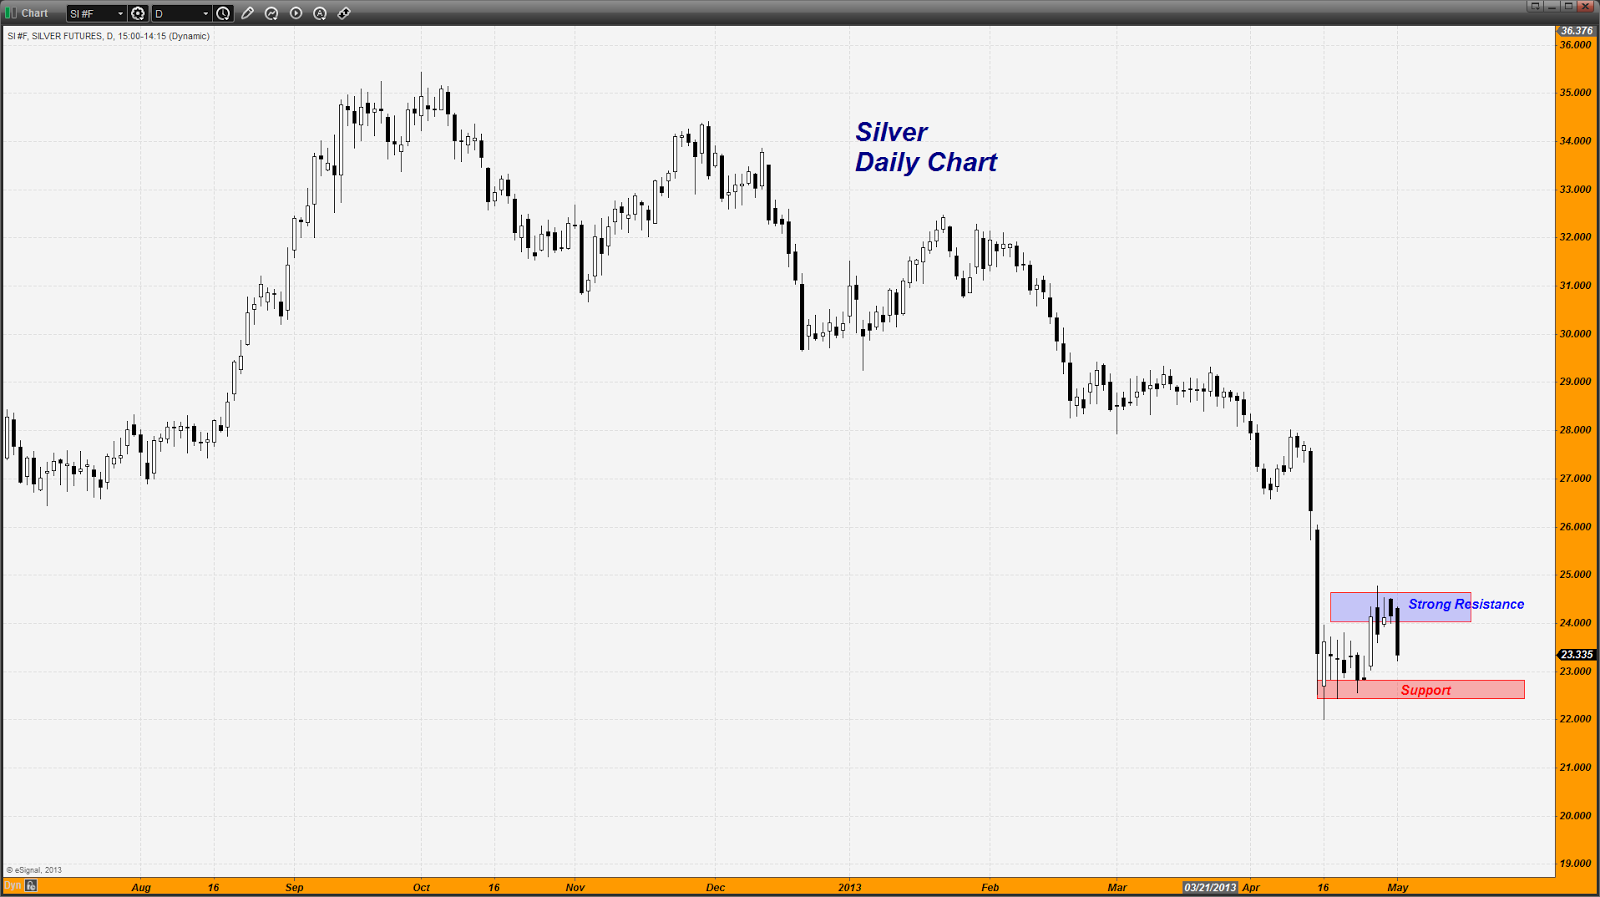
Incidentally, Silver failed at the $24 barrier again. It has flirted with that strong resistance level but cannot keep it gains ABOVE that key mark. Hedge funds are pouncing on it whenever it rears its head up here and until it can prove the bears wrong but maintaining its footing above $24, they are going to be emboldened to sell all rallies. Support remains intact below $22.50 or so keeping silver confined in a trading range.
Not to be outdone, the US released the ISM (manufacturing purchasing managers index) today also. The number fell to 50.7 in April, down from 51.3 in March.
If this news was not bad enough, the EIA information this AM, showing crude oil stocks at a THREE DECADE HIGH (yes, I am not making this number up), effectively resulted in both crude oil and unleaded gasoline getting beaten with an ugly stick. (At least we can expect some lower prices at the pump). Astonishingly enough - crude oil inventories were at 395.3 million barrels - that is the highest level since the EIA started reporting this weekly data back in 1982.
While some of this energy data is related to the efficiency and ingenuity of the US domestic oil industry, particularly the increase in production tied to shale production, it still suggests that any "growth" in the US economy is moribund at best.
Combining this data makes me even more resolute in my view that the US equity markets are firmly in bubble territory and are an enormous accident just waiting to occur.
Anyone who would chase stocks higher in such an environment as this, one in which the only supportive factor is cheap money courtesy of the Central Banks, needs his or her head examined. The commodity world is a far more accurate signal of what is coming our way rather than the equity perma bull contingent, whom as I have already sarcastically mocked, would find a reason to buy stocks if an earthquake were to drop the entire state of California into the Pacific ocean.
Incidentally, news out of Australia this morning bears out the fact of slowing global growth and is an additional confirmation of the reason behind the selling across the commodity sector. Down under there is the AIG (Australian Industry Group) which issues a monthly report. It fell to 36.7 in April from 44.4. Reports indicate that is the 14th consecutive month the index has been below 50 (expansion) and just so happens to be the lowest reading since April 2009, a full four years ago!
Australia's economy is very tightly tied to the health of the Chinese economy since the lion's share of their mineral production ends up being sold to China. This is why many commodities are seeing weakness. Keep in mind that the commodity boom of recent memory was completely dependent on the rapid growth rate of China. Miners gearing up production to meet that demand managed to ramp up supply just in time for the growth rate to begin slowing. That means SURPLUSES and growing stocks in warehouses and that means lower prices.
Besides this negative news, all eyes will now be focused on ENTRAIL READING 101, as analysts and pundits pour over the upcoming FOMC statement for clues to the future in their attempt to discern the will of the gods (those would be the monetary masters). AS far as I am concerned, if QE1, QE2, QE3 and QE4, were not and are not enough to create rapid growth, who the hell cares what these babblers at the Fed are going to say next. They have one weapon and one weapon only and that is the creation of unlimited amounts of funny money.
"If at first you don't succeed, try harder", should be the motto carved in stone over the offices of the Fed. The bond market is sharply higher today with the yield on the Ten Year now down to 1.63 as I write this, hardly an endorsement of "growth" or a testimony to the success of the Fed.
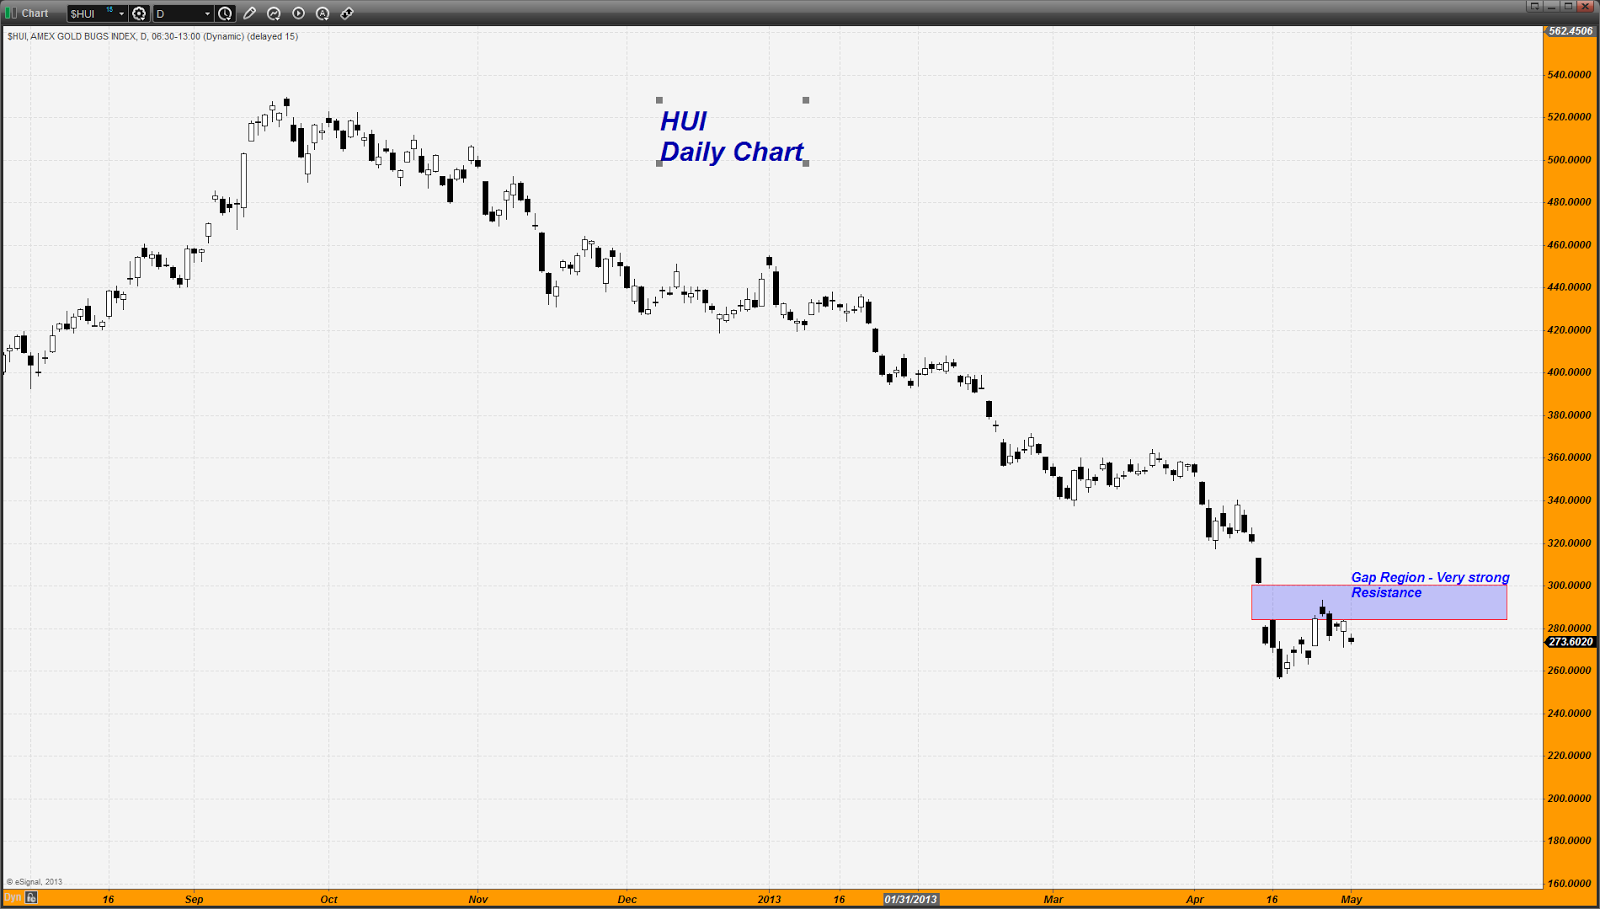
The HUI, mining shares, cannot clear that chart gap formed on the daily. Until they do, the mining shares are going NOWHERE. Profits are lacking in that sector and until investors see a REASON to buy them, even at these incredibly cheap prices in relation to gold itself, (the HUI to Gold ratio continues to plummet), long side sponsorship is going to be lacking.
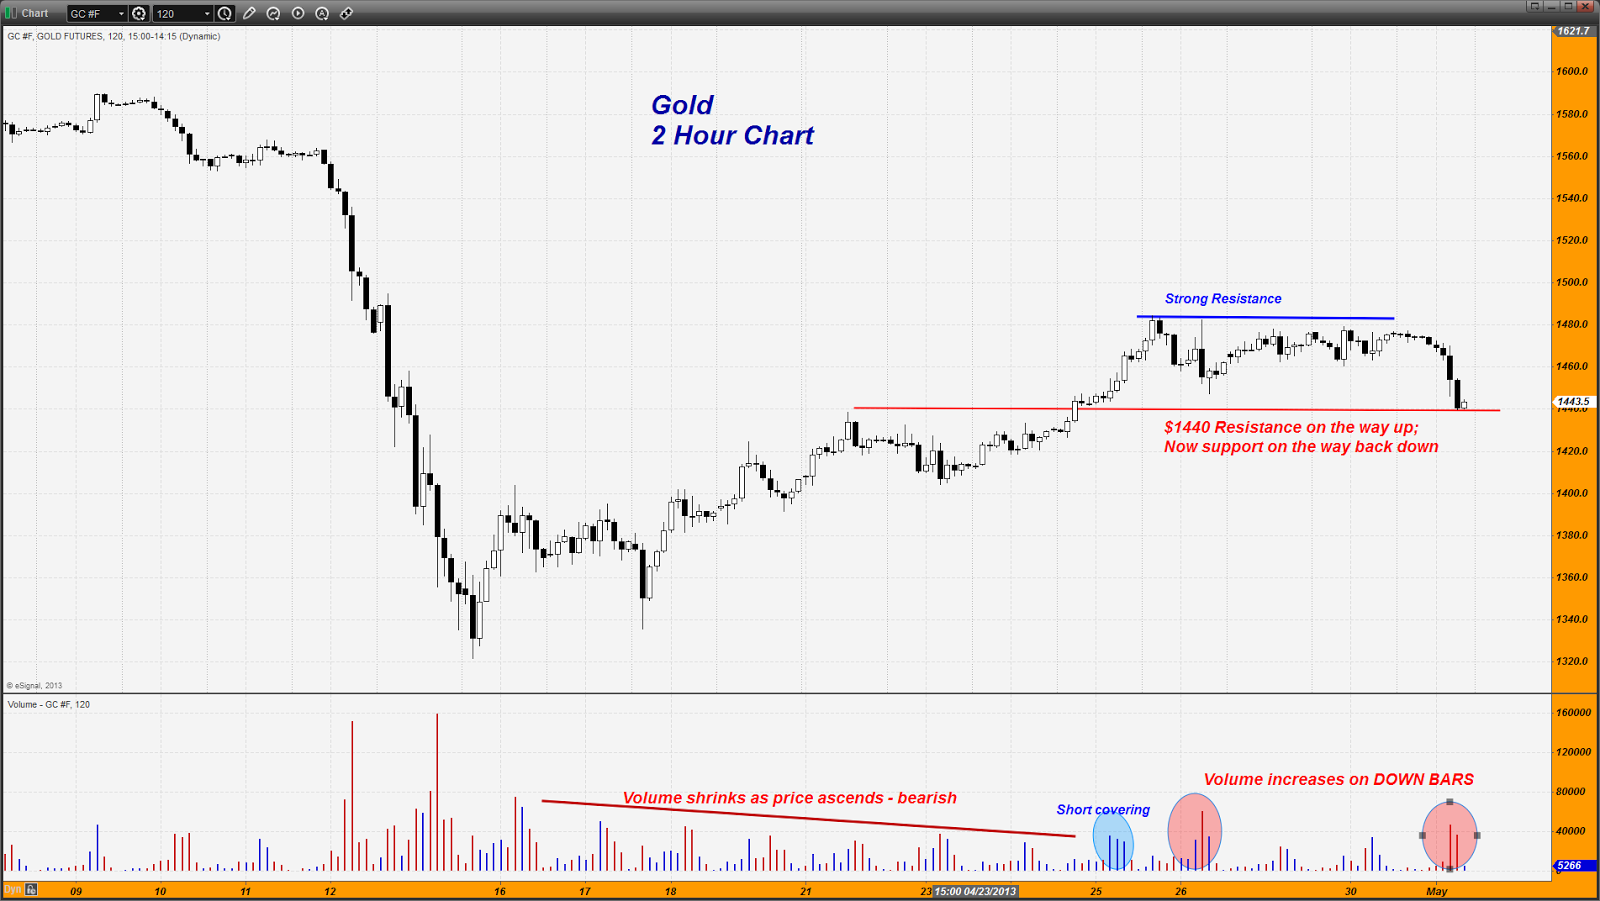
That brings us to gold. It did fail at the resistance level noted on the charts that was formed last week near $1485. Bulls simply could not overcome the hedge fund selling that was lurking up there. I know it angers my friends in the gold camp but as a trader I have to call it as I see it. That means rallies in gold are going to be sold until the technical posture of the price chart switches from bearish to bullish.
I understand all the implications of the strong off take in the physical market. That is very real and cannot be underestimated. As I have stated however; a $200 plunge in the price of gold draining the "15" handle down to a "13" handle is exactly the recipe for generating strong physical buying. The problem is that once price rallies back up towards the region from where the plummet in price began, physical gold demand will throttle back again. With the lack of investment demand heading into the gold ETF, traders are looking at that as a bearish factor and a reason to sell on rallies. They will cover on dips lower in price whenever physical demand starts surging again meaning that the ingredients are in place for a range trade.
If gold can maintain its footing above $1440, that will set the parameters of the range at that level on the bottom and $1485 on the top. If $1440 fails, we go to $1420 and then if that fails, test $1400.
That brings me to one more thing - various readers keep sending me reports about the Commitment of Traders report - please keep in mind that those who rely exclusively on those as if they are some sort of Holy Grail of trading are completely off base. They speculate this means that, and that means this and infer one thing and then another. It is all a gigantic waste of time. That sort of foolishness has about as much use as all that talk a while ago about the basis. Remember all those who kept extolling the basis and that nonsense about gold backwardation - that was before gold imploded to the downside along with the mining shares.
The one use for the COT is as a determiner of sentiment. That is how I use them. Anything else makes good fodder for newsletter writers to separate you from your money.
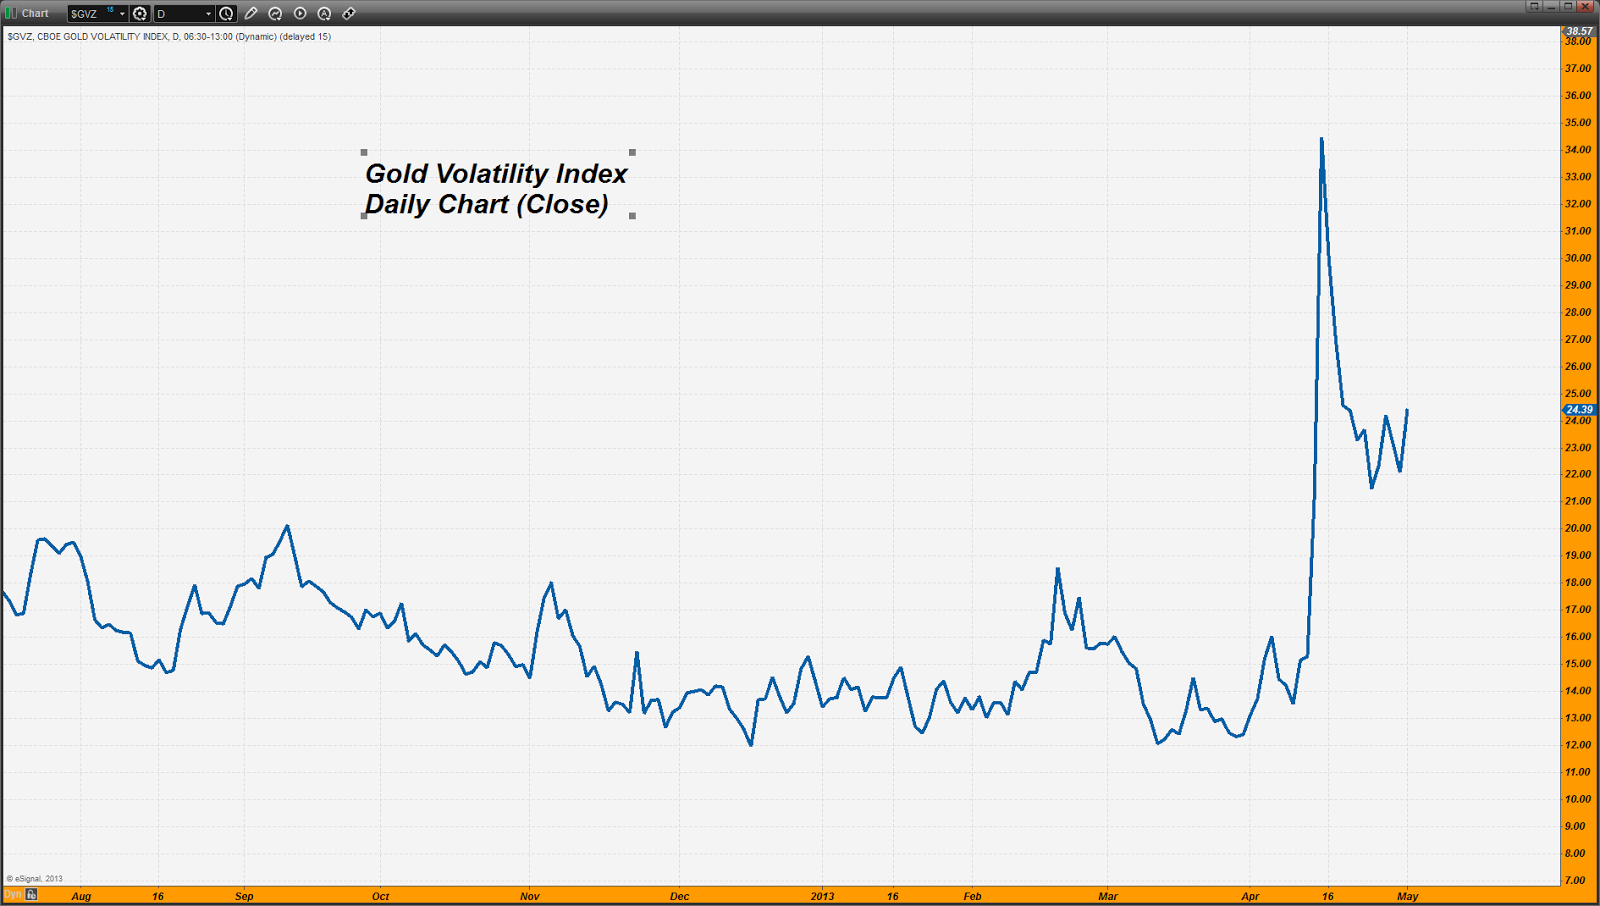
Lastly, the Gold Volatility Index is rising today as can be expected with the sharp selling being witnessed in the metal. Nervousness is creeping back up as is uncertainty ahead of the FOMC statement.
Let's see what the demi-gods from the FOMC give us and how the markets react to that...- Dan Norcini, More at http://www.traderdannorcini.blogspot.com/
 U.S. Stock Market What recovery? Despite trillions in new paper printing, the U.S. economy barely gained any momentum and is clearly faltering yet again. Any talk of QE ending is out the window (it was b.s. to start with) and the Dont Worry, Be Happy crowd will do their very best to spin it into justifying large equity ownership. Me? I said to be a scale-up seller on the way to Dow 15,000 and nothing has changed.
U.S. Dollar Index Shhhh
Its rolling over despite all the bulls who said its still a safe haven.
Gold There are lots of things happening and some may not be making big news but never-the-less are worthy of recognition. The bears can ill-afford a $1,500+ gold tag and are making a stand to prevent it. The end of week trading should go a long way to suggest where were heading in May. Stay tuned.
Bonds Looking for an entry point to actually short bonds. I figure we could see the 10-yr T-Bond go to a 1.50% yield and if so, I hope to make that an entry point for me.- Peter Grandich, Grandich Letter
GATA Posts:

Nielson: Paper, physical are decoupling; Arensberg: COT is bass-ackwards
The Statistics:
As of close of business: 4/30/2013
Gold Warehouse Stocks: | 8,000,991.046 | -128,163.189 |
Silver Warehouse Stocks: | 166,440,124.475 | +390,105.451 |
Global Gold ETF Holdings
[WGC Sponsored ETFs]

| Product name | Total Tonnes | Total Ounces | Total Value |
New York Stock Exchange Arca (NYSE Arca) AND Singapore Exchange (SGX) AND Tokyo Stock Exchange (TSE) AND Hong Kong Stock Exchange (HKEx) | SPDR® Gold Shares | 1078.539 | 34,676,103 | US$50,421m |
London Stock Exchange (LSE) AND NYSE Euronext Paris AND Borsa Italiana AND Frankfurter Wertpapierbörse (Deutsche Börse - Xetra) | Gold Bullion Securities | 138.13 | 4,441,056 | US$6,399m |
London Stock Exchange (LSE) AND NYSE Euronext Paris AND Borsa Italiana AND Frankfurter Wertpapierbörse (Deutsche Börse - Xetra) AND NYSE Euronext Amsterdam | ETFS Physical Gold | 152.66 | 4,908,200 | US$8,004m |
Australian Stock Exchange (ASX) | Gold Bullion Securities | 11.16 | 358,789 | US$523m |
Johannesburg Securities Exchange (JSE) | New Gold Debentures | 42.45 | 1,364,715 | US$2,214m |
Note: Change in Total Tonnes from yesterdays data: SPDR subtracted 2.105 tonnes.
COMEX Gold Trust (IAU) Total Tonnes in Trust: 195.56: No change from yesterdays data.
Silver Trust (SLV) Total Tonnes in Trust: 10,452.50: +45.06 change from yesterdays data.
The Miners:
SEMAFOs (SMF.TO) drill results, Gold Reserves (GRZ.V) option payment, Randgolds (GOLD) donation, Midways (MDW) options, and Kimbers (KBX) drill results were among the big stories in the gold and silver mining industry making headlines today.
WINNERS
1. Buenaventura | BVN +2.20% $20.46 |
2. IAMGOLD | IAG +2.05% $5.48 |
3. ITH | THM +2.02% $1.01 |
LOSERS
1. Banro | BAA -7.81% $1.18 |
2. Allied Nevada | ANV -7.29% $9.92 |
3. Northern Dynasty | NAK -6.11% $2.46 |
Winners & Losers tracks NYSE and AMEX listed gold and silver mining stocks that trade over $1.
Please see Yahoos Mining/Metals News Wire for all of todays mining news.
- Chris Mullen, Gold Seeker Report
- Would you like to receive the Free Daily Gold Seeker Report in your e-mail? Click here
Additional Resources for todays Gold Seeker Report can be found:
© Gold Seeker 2013
Note: This article may be reproduced provided the article, in full, is used and mention to Gold-Seeker.com is given.
Disclosure: The owner, editor, writer and publisher and their associates are not responsible for errors or omissions. The author of this report is not a registered financial advisor. Readers should not view this material as offering investment related advice. Gold-Seeker.com has taken precautions to ensure accuracy of information provided. Information collected and presented are from what is perceived as reliable sources, but since the information source(s) are beyond Gold-Seeker.coms control, no representation or guarantee is made that it is complete or accurate. The reader accepts information on the condition that errors or omissions shall not be made the basis for any claim, demand or cause for action. Past results are not necessarily indicative of future results. Any statements non-factual in nature constitute only current opinions, which are subject to change. Nothing contained herein constitutes a representation by the publisher, nor a solicitation for the purchase or sale of securities & therefore information, nor opinions expressed, shall be construed as a solicitation to buy or sell any stock, futures or options contract mentioned herein. Investors are advised to obtain the advice of a qualified financial & investment advisor before entering any financial transaction.
-- Posted Wednesday, 1 May 2013 | Digg This Article | Source: GoldSeek.com


 Gold Seeker Closing Report: Gold and Silver Fall Over 1% and 2%


