-- Posted Monday, 6 May 2013 | | Disqus
| Close | Gain/Loss |
Gold | $1469.90 | +$0.70 |
Silver | $24.00 | -$0.09 |
XAU | 107.72 | +0.05% |
HUI | 278.40 | +0.45% |
GDM | 822.94 | +0.15% |
JSE Gold | 1501.38 | +15.64 |
USD | 82.33 | +0.22 |
Euro | 130.76 | -0.40 |
Yen | 100.64 | -0.34 |
Oil | $96.16 | +$0.55 |
10-Year | 1.771% | +0.019 |
T-Bond | 146.625 | -0.4375 |
Dow | 14968.89 | -0.03% |
Nasdaq | 3392.97 | +0.42% |
S&P | 1617.50 | +0.19% |
The Metals:
Gold climbed up to $1478.72 in Asia before it fell back to $1464.50 at about noon EST, but it then bounced back higher in the last four hours of trade and ended with a gain of 0.05%. Silver rose to $24.421 before it slipped back to $23.836 and then also rallied back higher, but it still ended with a loss of 0.37%.
Euro gold rose to over 1124, platinum gained $7 to $1500.50, and copper remained at about $3.30.
Gold and silver equities traded mostly slightly higher and ended with modest gains.
The Economy:
There were no major economic reports today. Tomorrow at 3PM EST brings Consumer Credit for March expected at $16.3 billion.
The Markets:

Charts Courtesy of http://finance.yahoo.com/
Oil rose on geopolitical tensions after reports that Israel launched airstrikes against Syria.
The U.S. dollar index rose as the euro fell after European Central Bank President Mario Draghi said the bank is closely watching incoming data and is ready to take further action if needed to address economic weakness.
Treasuries fell as the Dow, Nasdaq, and S&P traded modestly slightly higher on mostly positive company reports.
Among the big names making news in the market today were BofA, Wells Fargo, Bain, Golden Gate, BMC, and MBIA.
The Commentary:
After watching the effects of the mediocre payrolls number yesterday (Friday) which culminated in a push over 1600 in the S&P 500 and a print in the Dow over 15,000, I thought it might be useful to note a few things about this most recent example of a hysteria.
I am on record here as stating that the entire stock market rally is nothing but a Federal Reserve induced bubble brought about by artificially low interest rates starving investors for yield elsewhere. The Fed, along with the Bank of Japan and the ECB I might add, are determined to corral investors and herd them, unthinking like cattle, into equities; the goal being to create an atmosphere of general euphoria towards the economy boosting consumer confidence in the hopes of inducing them to take on more debt and spend.
This is akin to building a towering skyscraper on a foundation of PLAY-DO. It may look wonderful and draw gasps of admiration but it has no stability and will not be able to withstand any external shocks.
I know what the perennial perma bulls are saying - stocks are cheap and corporate profits are good so the path of least resistance is higher. They have been right so far judging by the tape. However, to point to a jobs number that is less than 200K per month, now some FIVE YEARS after the onset of a horrible recession as if it is evidence of a recovery strikes me more as ROSE-COLORED GLASSES analysis rather than solid reasoning.
Consider some of these statistics - The number of high school graduates here in the US each year is near 3.2 million. About 2/3 - 70% of them go on to college. That leaves us about a million who will look to enter the workforce.
The number of college graduates each year here in the US is somewhere near 1.8 million (these vary from year to year and this is based on data that I have ferreted out - it is close but not an exact number).
If we assume that the lion's share of these college graduates do not go on to pursue Masters or Doctorates, (it seems the percentage of those going on to obtain advanced degrees is between 30%-40%) then we can still come up with a number of potential NEW job seekers from college near 1 million each year.
Combine them both and you end with somewhere in the vicinity of 2 million new job seekers each year. Please keep in mind that I am not attempting to be a statistician here; rather I am trying to jot down some quick thoughts on the back of a napkin for analytical purposes.
Do the math. Divide 2 million by 12 months in each year and you need about 167,000 new jobs each and every month just to keep up with the population growth.
Please note that this does not even deal with those currently unemployed and looking for work. Also, it certainly does not take into account the type or nature of the jobs being created. How many of these jobs that were created in yesterday's payrolls number were part time?
Either way, it is difficult for me to get all revved up about the recent numbers to the point of using it to drive stocks to an all time high. If you are barely adding enough new jobs to keep up with population growth, you are certainly not seeing a vibrant economy that is GROWING robustly. You are muddling along; that is what you are doing.
Now whether that justifies stocks at all time highs in the minds of investors, I will leave that to the Ra-Ra crowd but count me out. As I have said often here - this is a traders market and they should enjoy it while it lasts but reading anything other than that into it regarding the true state of the US economy is a fool's errand. It is the result of QE1, QE2, QE3, QE4 and now the Bank of Japan's version of QE along with the ECB's act in raising the spectre of fining banks for NOT LENDING by charging them interest on parked reserves instead of paying them interest.
Enough of my soap box renditions for the time being however. I want to note something on the price chart that is noteworthy.
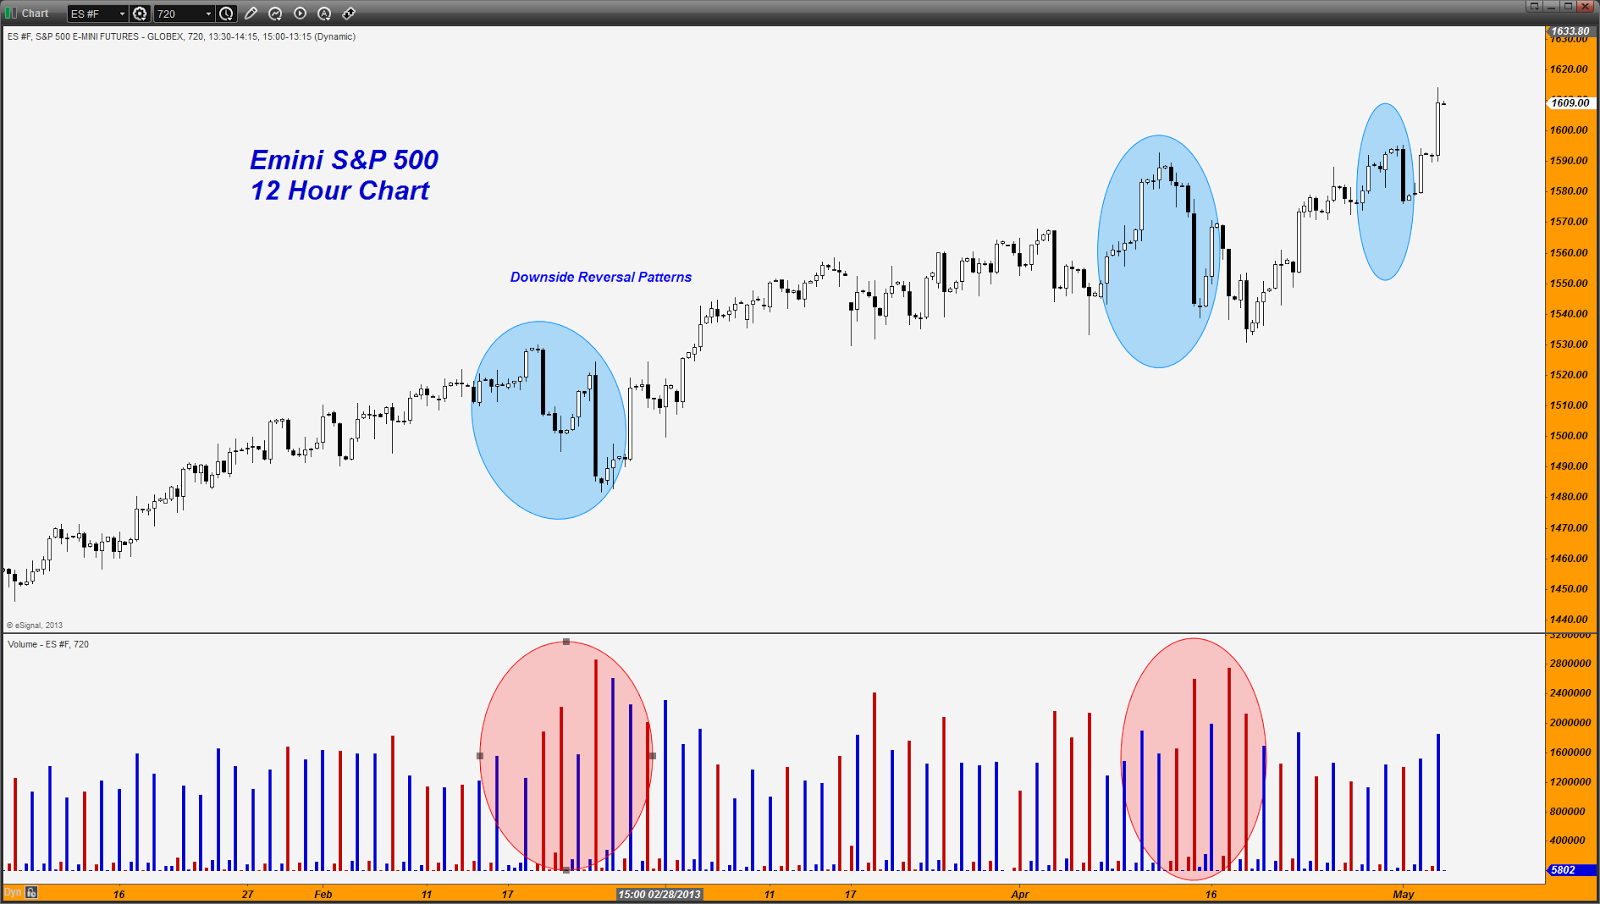
I am using the emini S&P 500 because of its deep liquidity although I will often refer to the Russell 2000 because of its usefulness as a risk sentiment indicator.
As you can see, since the beginning of this year, the chart moves from lower left to upper right, a powerful uptrend. Note how the MOMENTUM indicator follows the price up until the middle of February of this year.
Let me digress a bit here to note that I am using a 28 day momentum indicator smoothed by a 5 day moving average of get rid of some of the sharp spikes and dips. I am interested in seeing the general pattern and not each spike and thus the reason for smoothing the data.
In the middle of that month, we recorded what is the first of THREE DOWNSIDE REVERSAL PATTERNS. I have those noted in the ellipses. Do you see what I am seeing here? Note from that point forward, the upward momentum in this market continues to decline even as it has gone on to make one new high after another. This has occurred even though we have recorded an additional TWO more downside reversal patterns.
Just this past week on Wednesday, the market experienced a very strong reversal pattern on extremely high volume that was totally contradicted, yet again, in the next two days' worth of trading. Of course, the Friday rally blew right through the top of the reversal pattern. Yet, momentum did not register a new high for the move.
What I am describing here are classic textbook cases of negative divergence. These are all warning signals that the uptrend is losing momentum but so far it has not mattered one bit. When you have the equivalent of $160 billion of funny money being conjured into existence each and every month by the Fed and the BOJ, downside reversal patterns, normally one of the most reliable technical signals that exist, are invalidated time after time due to the "BUY the DIP" mentality that has been created in the herd compliments of the various Central Banks.
Here is the same chart scaled down to a 12 hour time frame to show a bit closer look at the market. This time around I have noted the VOLUME. Can you see the extent of the downside volume (BARS IN RED) compared to the upside volume (BARS IN BLUE)? Downside volume has been exceeding upside volume for the most part over that same time frame that we were looking at in the above daily chart, namely since the middle of February.
I can only explain this as saying it is eerie. I get the distinct impression in looking at the internal components of this stock market rally that it is a market that really does not want to be moving higher, and yet it is. The volume, plus the waning of momentum, tells me that this market is seemingly being forced higher even though it wants to go lower. Call it a GRUDGING RALLY. If this were any other price chart for any other stock or any other commodity, I would look to sell it. Not so with this monstrosity of nature - it just keeps going higher and higher and higher casting off one technical signal after another.
No doubt a goodly number of shorts are continuously getting squeezed out and that is contributing to the upward movement but I keep coming back to the same point - who in their right mind would be chasing stocks higher and higher given the deteriorating internals of this market?
I am not sure how history is going to record this period but I suspect, after the bubble finally pops, (and who can say how high this thing will go before it does), commentators and pundits will all point to the warnings that were repeatedly ignored and will provide copious illustrations of quotations from various players of this day explaining to those of our time why stocks were a great buy, all the way up until the final moment that the bubble burst wide open.
CAVEAT EMPTOR!- Dan Norcini, More at http://www.traderdannorcini.blogspot.com/
 Dear CIGAs,
We have spent more than 12 years working to educate you on the subject of gold. I only ask in return that you consider these three videos carefully. These presentations sum up where we are, why gold was bombed, why technical analysis is in gold a major waste of time and the direction we are without any doubt going.
If you will devote time to watching each video carefully you will see how the recent operation to help the dollar by depreciating price of gold was not a short play but a play to keep a system alive.
Free Gold is an interesting school of thought with which I agree on the emancipation of gold from paper gold as natural development and its implication, but not the entire thesis which runs in various directions in application of their basic and correct thesis.
The not-anticipated result of the take down on paper gold was to wake a sleeping elephant of physical demand from other every corner of the globe. The opinion of the operators is that if the gold banks can keep pressure up on paper gold the huge demand for physical will fizzle. The world outside of North America has recent memories of monetary situations exactly the same as now. They know that paper is in its final stage and gold is in a major ascendancy. Physical demand will remain strong thereby overcoming paper gold and forcing paper gold exchanges to change their methods of delivery, clearly restricting paper to a secondary role and making its use to manipulate gold redundant.
The three videos build an argument that screams that you should not sell your physical gold or gold producers with political sensitivity, cheap cost of production, and near surface gold. Once again, if you have two cars sell one to either initiate or increase your gold and unique gold producer position. If you live in a metropolitan city, sell both.
1. Columbia Economist Dr. Jeffrey Sachs speaks candidly on monetary reform and defines the illegality of finance as now practiced.
Click here to watch the video
2. David Rosenberg just gave this devastating presentation on the sad state of the economy. This is the key to QE to Infinity even when depositors are hijacked for bank rescues.
Click here to watch the video
3. In this video please do not watch the music video at the end. It is not pertinent or entertaining. The story however is your key to understanding exactly what has happened and what is about to happen. This video discusses the natural tendency of gold under present circumstances and why the US Fed pushed the panic button at $1900. It is the heart of the emancipation of gold from paper gold which releases physical gold and those entities with physical gold easily available to naturally rise in to prices we dare not even consider. It is the freeing of gold which is Free Gold.
You will identify the negative gold writers as employees of, or beneficiaries of, Boss Hogg.
Click here to watch the video
- Jim Sinclair, JSMineset.com
GATA Posts:

Mike Kosares: Silver eagle sales show metal's recognition as safe haven
GoldMoney's Alasdair Macleod interviewed on 'The Keiser Report'
Martin Armstrong: GATA and gold and manipulations
The Statistics:
As of close of business: 5/03/2013
Gold Warehouse Stocks: | 7,979,263.830 | -54,327.843 |
Silver Warehouse Stocks: | 165,258,276.936 | -384,165.45 |
Global Gold ETF Holdings
[WGC Sponsored ETFs]

| Product name | Total Tonnes | Total Ounces | Total Value |
New York Stock Exchange Arca (NYSE Arca) AND Singapore Exchange (SGX) AND Tokyo Stock Exchange (TSE) AND Hong Kong Stock Exchange (HKEx) | SPDR® Gold Shares | 1065.605 | 34,260,272 | US$50,310m |
London Stock Exchange (LSE) AND NYSE Euronext Paris AND Borsa Italiana AND Frankfurter Wertpapierbörse (Deutsche Börse - Xetra) | Gold Bullion Securities | 138.13 | 4,441,056 | US$6,506m |
London Stock Exchange (LSE) AND NYSE Euronext Paris AND Borsa Italiana AND Frankfurter Wertpapierbörse (Deutsche Börse - Xetra) AND NYSE Euronext Amsterdam | ETFS Physical Gold | 152.66 | 4,908,200 | US$8,004m |
Australian Stock Exchange (ASX) | Gold Bullion Securities | 11.16 | 358,789 | US$527m |
Johannesburg Securities Exchange (JSE) | New Gold Debentures | 42.45 | 1,364,715 | US$2,214m |
Note: Change in Total Tonnes from yesterdays data: SPDR subtracted 3.61 tonnes.
COMEX Gold Trust (IAU) Total Tonnes in Trust: 195.52: No change from yesterdays data.
Silver Trust (SLV) Total Tonnes in Trust: 10,431.39: No change from yesterdays data.
The Miners:
Almadens (AAU) drill results, Goldcorps (GG) dividend, Aurizons (AZK) election deadline, and Avinos (ASM) fourth quarter results were among the big stories in the gold and silver mining industry making headlines today.
WINNERS
1. Harmony | HMY +9.49% $4.73 |
2. Gold Resource | GORO +2.52% $10.17 |
3. Silver Standard | SSRI +2.44% $7.15 |
LOSERS
1. Alexco | AXU -6.70% $1.81 |
2. Tanzanian Royalty | TRX -5.03% $2.83 |
3. Golden Star | GSS -4.63% $1.03 |
Winners & Losers tracks NYSE and AMEX listed gold and silver mining stocks that trade over $1.
Please see Yahoos Mining/Metals News Wire for all of todays mining news.
- Chris Mullen, Gold Seeker Report
- Would you like to receive the Free Daily Gold Seeker Report in your e-mail? Click here
Additional Resources for todays Gold Seeker Report can be found:
© Gold Seeker 2013
Note: This article may be reproduced provided the article, in full, is used and mention to Gold-Seeker.com is given.
Disclosure: The owner, editor, writer and publisher and their associates are not responsible for errors or omissions. The author of this report is not a registered financial advisor. Readers should not view this material as offering investment related advice. Gold-Seeker.com has taken precautions to ensure accuracy of information provided. Information collected and presented are from what is perceived as reliable sources, but since the information source(s) are beyond Gold-Seeker.coms control, no representation or guarantee is made that it is complete or accurate. The reader accepts information on the condition that errors or omissions shall not be made the basis for any claim, demand or cause for action. Past results are not necessarily indicative of future results. Any statements non-factual in nature constitute only current opinions, which are subject to change. Nothing contained herein constitutes a representation by the publisher, nor a solicitation for the purchase or sale of securities & therefore information, nor opinions expressed, shall be construed as a solicitation to buy or sell any stock, futures or options contract mentioned herein. Investors are advised to obtain the advice of a qualified financial & investment advisor before entering any financial transaction.
-- Posted Monday, 6 May 2013 | Digg This Article | Source: GoldSeek.com


 Gold Seeker Closing Report: Gold and Silver End Near Unchanged


