-- Posted Friday, 31 May 2013 | | Disqus
| Close | Gain/Loss | On Week |
Gold | $1384.90 | -$28.90 | -0.08% |
Silver | $22.18 | -$0.56 | -1.38% |
XAU | 107.36 | -1.95% | +6.74% |
HUI | 274.53 | -1.53% | +7.50% |
GDM | 816.70 | -1.73% | +7.21% |
JSE Gold | 1536.72 | +25.58 | - |
USD | 83.26 | +0.23 | -0.51% |
Euro | 129.96 | -0.52 | +0.47% |
Yen | 99.60 | +0.33 | +0.84% |
Oil | $91.97 | -$1.64 | -2.07% |
10-Year | 2.164% | +0.040 | +7.61% |
Bond | 141.3125 | +0.1875 | - |
Dow | 15115.57 | -1.36% | -1.23% |
Nasdaq | 3455.91 | -1.01% | -0.09% |
S&P | 1630.74 | -1.43% | -1.14% |
The Metals:
Gold edged up to $1421.47 in early Asia trade, but it then fell to as low as $1384.60 in New York and ended with a loss of 2.04%. Silver slipped to as low as $22.16 and ended with a loss of 2.46%.
Euro gold fell to about 1066, platinum lost $28 to $1451, and copper fell five cents to about $3.27.
Gold and silver equities fell over 2% in the first half hour of trade and remained near that level for the rest of the day.
The Economy:
Report | For | Reading | Expected | Previous |
Personal Income | Apr | 0.0% | 0.1% | 0.3% |
Personal Spending | Apr | -0.2% | 0.1% | 0.1% |
PCE Prices - Core | Apr | 0.0% | 0.1% | 0.1% |
Chicago PMI | May | 58.7 | 49.3 | 49.0 |
Michigan Sentiment | May | 84.5 | 83.7 | 83.7 |
All of this weeks other economic reports:
Next weeks economic highlights include the ISM Index and Construction Spending on Monday, the Trade Balance on Tuesday, ADP Employment, Productivity, Unit Labor Costs, Factory Orders, ISM Services, and the feds Beige Book on Wednesday, Initial Jobless Claims on Thursday, and Mays jobs data and Consumer Credit on Friday.
The Markets:

Charts Courtesy of http://finance.yahoo.com/
Oil fell as the U.S. dollar index rose on decent economic data that sent treasuries lower.
The Dow, Nasdaq, and S&P ended markedly lower on worries about what the fed may do.
Among the big names making news in the market Friday were Apple, Dell, Prudential, Lions Gate, and Tesla.
The Commentary:
"Houston, We have a Problem!"
In this case it might be better written, "FOMC, we have a PROBLEM!"
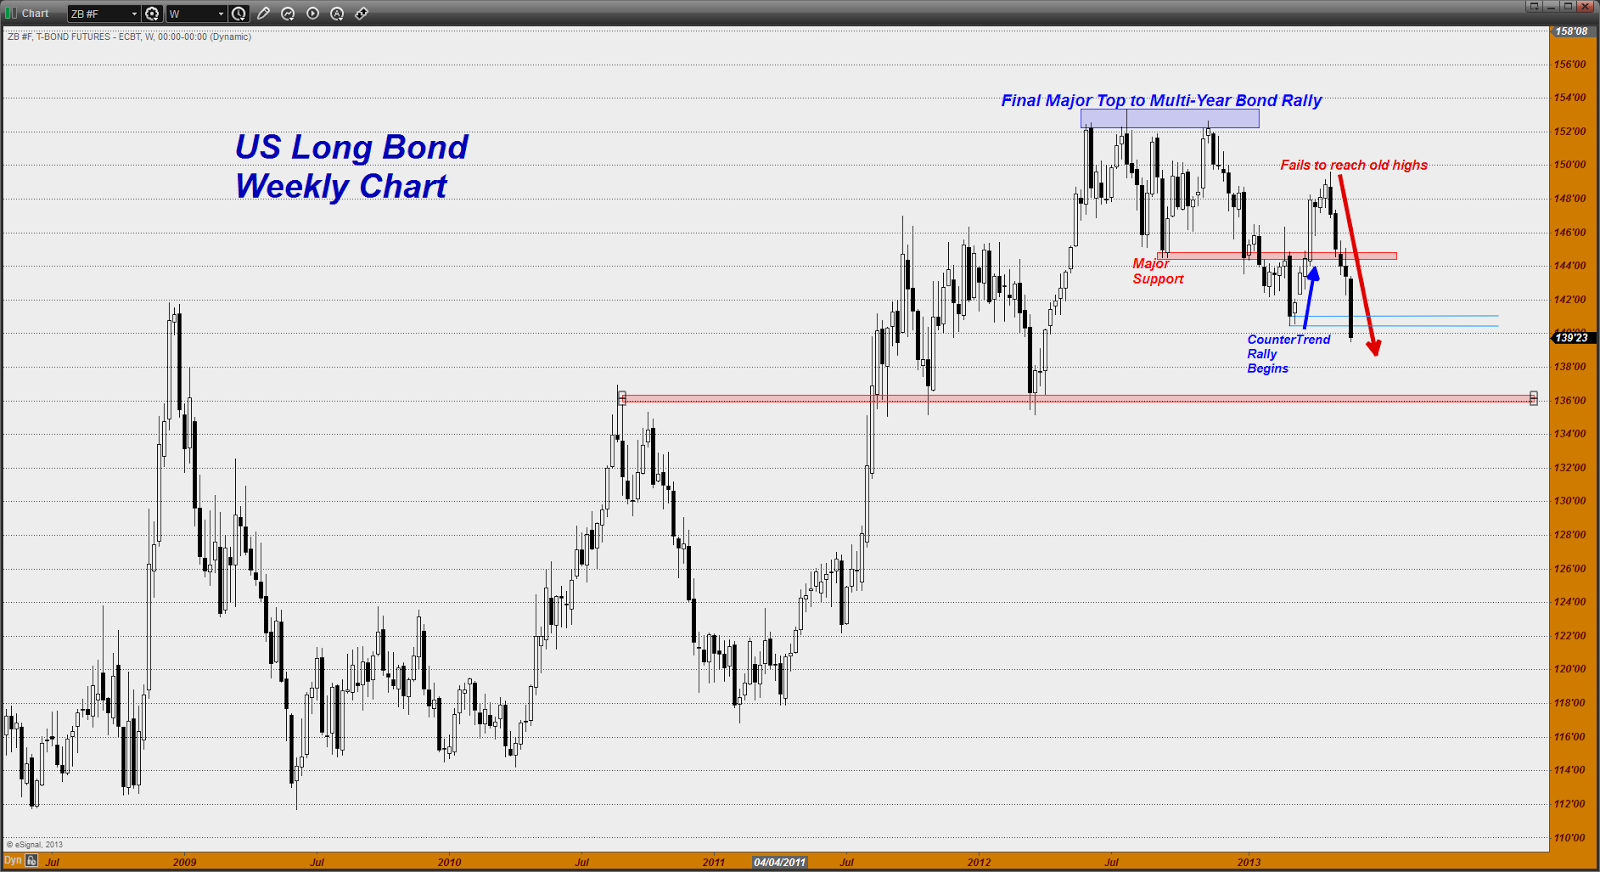
What I am referring to is the long awaited and long expected, I might add, breakdown in the US long bond. It is my opinion that the US bond market is the single most important market on the planet. For years, many of us have sat and watched as bond prices were driven to levels that very few thought imaginable a decade ago. What with the rush into the perceived "safety" of US Treasury debt and the concerted effort by the Federal Reserve to drive down long term yield through their Quantitative Easing programs, bond bears were blasted from one defensive position after another by the steady influx of money flows.
My oh my how things have changed over the last few weeks! I give you a weekly chart of the long bond where you can see the breakdown in vivid terms. With the advantage that comes from some hindsight now that enough time has passed to trace out a definitive chart pattern, we can see the peak in the bond market, and the low in long term interest rates has come and gone. Do you see that MAJOR TOP that form over the course of most of last year? Three times the bonds were shoved into that region and three times they failed there. The third time turned out not to be a charm and out went speculative money to giddily chase equities as this bond bubble burst and the new one formed in equities.
Once the major support level gave way near the 145 level, a countertrend rally developed that took bond prices through NINE handles before speculators could see that the final rally to retest the former peak could not muster enough strength to move the final 4 handles needed to reach it. Down she went and up went long term interest rates as a result.
I want to point out something on this chart that is more a function of the rolling process that occurs in the futures markets but nonetheless leaves it mark upon the technical price charts. This week the front month bond contract became the September bonds. Prior to this changeover it was the June bonds. There is currently a FULL ONE POINT DIFFERENCE between the value of those two contract months. When a continuous contract is drawn out for analysis purposes, the data it will include always contains the FRONT MONTH contract or the most active. That has now become the September Bond contract. When this is included, you can see the impact on the technical price chart!
Note how the support level that formed where the counter trend rally began, has now given way because of the level at which the September bond contract is currently trading.
The day is not over yet and thus neither is the week, but barring a late session upside movement in the bond market, it is now on track to close below what has been a significant chart support level. If it does so, odds favor a furthering of the new trend to the downside with no significant chart support showing up until another 3 - 31/2 points lower down near the 136 region.(Maybe the boyz at the Fed will send their New York desk buyer to the market to buy some bonds later today....)
One has to wonder if this is what the Fed had in mind when they were attempting to push long term interest rates lower. What they got was a mad rush out of bonds and fixed income in a near ZERO interest rate environment and into equities. All that money flowing out of bonds in search of easy gains in equities has now resulted in a surge higher in interest rates at the back end of the curve.
It is no secret that the formula for the current "recovery" has been ultra low interest rates which have made debt servicing easier for business, consumers and the government I might add. The big question is whether or not this nascent recovery can stand a rise in interest rates. I do not believe that it can. So where does that leave the Fed?
Talk of tapering QE makes investors nervous and actually undercuts any reason to buy bonds since a major buyer has been removed if that were to occur. That engenders selling. On the other hand, if the Fed were to actually reverse course and RAMP UP bond buying once again if the economy were to slow, then all that would do is to further facilitate the bubble in the equity markets that they have created. Money flows would continue to exit bonds and find a home in equities. Either way, bonds suffer as a result and head lower.
Talk about a self-inflicted conundrum! Good luck with this one fellas... You made it; now handle it!- Dan Norcini, More at http://www.traderdannorcini.blogspot.com/
GATA Posts:

GATA Chairman Murphy, other GATA favorites to speak at Dallas conference
Brien Lundin: The April attack on gold was market manipulation
Virtual currencies run into legal trouble in U.S.
India may try anything to reduce gold imports -- except stabilize the rupee
The Statistics:
Activity from: 5/30/2013
Gold Warehouse Stocks: | 8,054,906.869 | -296.602 |
Silver Warehouse Stocks: | 165,749,060.048 | +459,016.748 |
Global Gold ETF Holdings
[WGC Sponsored ETFs]

| Product name | Total Tonnes | Total Ounces | Total Value |
New York Stock Exchange Arca (NYSE Arca) AND Singapore Exchange (SGX) AND Tokyo Stock Exchange (TSE) AND Hong Kong Stock Exchange (HKEx) | SPDR® Gold Shares | 1013.154 | 32,573,918 | US$45,404m |
London Stock Exchange (LSE) AND NYSE Euronext Paris AND Borsa Italiana AND Frankfurter Wertpapierbörse (Deutsche Börse - Xetra) | Gold Bullion Securities | 138.13 | 4,441,056 | US$6,200m |
London Stock Exchange (LSE) AND NYSE Euronext Paris AND Borsa Italiana AND Frankfurter Wertpapierbörse (Deutsche Börse - Xetra) AND NYSE Euronext Amsterdam | ETFS Physical Gold | 152.66 | 4,908,200 | US$8,004m |
Australian Stock Exchange (ASX) | Gold Bullion Securities | 11.16 | 358,789 | US$499m |
Johannesburg Securities Exchange (JSE) | New Gold Debentures | 42.45 | 1,364,715 | US$2,214m |
Note: No change in Total Tonnes from yesterdays data.
COMEX Gold Trust (IAU) Total Tonnes in Trust: 187.22: No change from yesterdays data.
Silver Trust (SLV) Total Tonnes in Trust: 9,992.92: No change from yesterdays data.
The Miners:
Brigus Golds (BRD) resumed operations, Buenaventuras (BNV) protests, Freeports (FCX) new mine collapse, Centerra Golds (CG.TO) protests, and New Golds (NGD) acquisition of Rainy River (RR.TO) were among the big stories in the gold and silver mining industry making headlines Friday.
WINNERS
1. DRDGOLD | DRD +5.01% $5.87 |
2. Comstock | LODE +4.04% $2.06 |
3. Solitario | XPL +1.72% $1.18 |
LOSERS
1. Fortuna | FSM -11.7% $3.17 |
2. New Gold | NGD -8.59% $6.81 |
3. Northern Dynasty | NAK -6.43% $2.62 |
Winners & Losers tracks NYSE and AMEX listed gold and silver mining stocks that trade over $1.
Please see Yahoos Mining/Metals News Wire for all of todays mining news.
- Chris Mullen, Gold Seeker Report
- Would you like to receive the Free Daily Gold Seeker Report in your e-mail? Click here
Additional Resources for todays Gold Seeker Report can be found:
© Gold Seeker 2013
Note: This article may be reproduced provided the article, in full, is used and mention to Gold-Seeker.com is given.
Disclosure: The owner, editor, writer and publisher and their associates are not responsible for errors or omissions. The author of this report is not a registered financial advisor. Readers should not view this material as offering investment related advice. Gold-Seeker.com has taken precautions to ensure accuracy of information provided. Information collected and presented are from what is perceived as reliable sources, but since the information source(s) are beyond Gold-Seeker.coms control, no representation or guarantee is made that it is complete or accurate. The reader accepts information on the condition that errors or omissions shall not be made the basis for any claim, demand or cause for action. Past results are not necessarily indicative of future results. Any statements non-factual in nature constitute only current opinions, which are subject to change. Nothing contained herein constitutes a representation by the publisher, nor a solicitation for the purchase or sale of securities & therefore information, nor opinions expressed, shall be construed as a solicitation to buy or sell any stock, futures or options contract mentioned herein. Investors are advised to obtain the advice of a qualified financial & investment advisor before entering any financial transaction.
-- Posted Friday, 31 May 2013 | Digg This Article | Source: GoldSeek.com


 Gold Seeker Weekly Wrap-Up: Gold and Silver End Slightly Lower on the Week


