-- Posted Monday, 25 November 2013 | | Disqus
| Close | Gain/Loss |
Gold | $1248.80 | +$5.60 |
Silver | $20.02 | +$0.15 |
XAU | 86.11 | -0.30% |
HUI | 208.40 | -0.39% |
GDM | 610.99 | -0.45% |
JSE Gold | 1146.53 | -38.00 |
USD | 80.89 | +0.19 |
Euro | 135.18 | -0.36 |
Yen | 98.50 | -0.24 |
Oil | $94.09 | -$0.75 |
10-Year | 2.741% | -0.011 |
T-Bond | 132.125 | +0.21875 |
Dow | 16072.54 | +0.05% |
Nasdaq | 3994.57 | +0.07% |
S&P | 1802.48 | -0.13% |
The Metals:
Gold fell $15.56 to $1227.64 at about 8:30AM EST, but it then climbed to as high as $1252.47 in afternoon New York trade and ended with a gain of 0.45%. Silver surged to as high as $20.082 and ended with a gain of 0.25%.
Euro gold rose to almost 924, platinum lost $3 to $1379, and copper climbed slightly to about $3.23.
Gold and silver equities fell over 3% by late morning before they rose to see slight gains by midafternoon, but they then fell back off in the last hour of trade and ended with modest losses on the day.
The Economy:
Report | For | Reading | Expected | Previous |
Pending Home Sales | Oct | -0.6% | 1.3% | -4.6% |
Economists trim short-term U.S. growth forecasts: survey Reuters
Private sector rebounds in November: Markit Reuters
Tomorrow brings Housing Starts, Building Permits, the Case-Shiller 20-city Index, the FHFA Housing Price Index, and Consumer Confidence.
The Markets:

Charts Courtesy of http://finance.yahoo.com/
Oil fell and the U.S. dollar index climbed higher after world leaders were able to come to an agreement over Irans nuclear program.
Treasuries remained higher after todays $32 billion 2-year note auction sold at a yield of 0.300% with a bid to cover of 3.54.
The Dow, Nasdaq, and S&P traded mostly slightly higher on optimism about Iran.
Among the big names making news in the market today were JPMorgan, Wal-Mart, Qualcomm, Blackberry, Boeing, and Apple.
The Commentary:
As we draw near to the close of November, I thought it fitting to provide a look at the gold chart over several time frames, near-term, intermediate and long term, in regards to the trend of the market.
For this purpose, I am using an old but reliable indicator known as the Directional Movement Index, which is as good as any others out there when it comes to determining whether a market is in a trending phase or is moving sideways within a range.
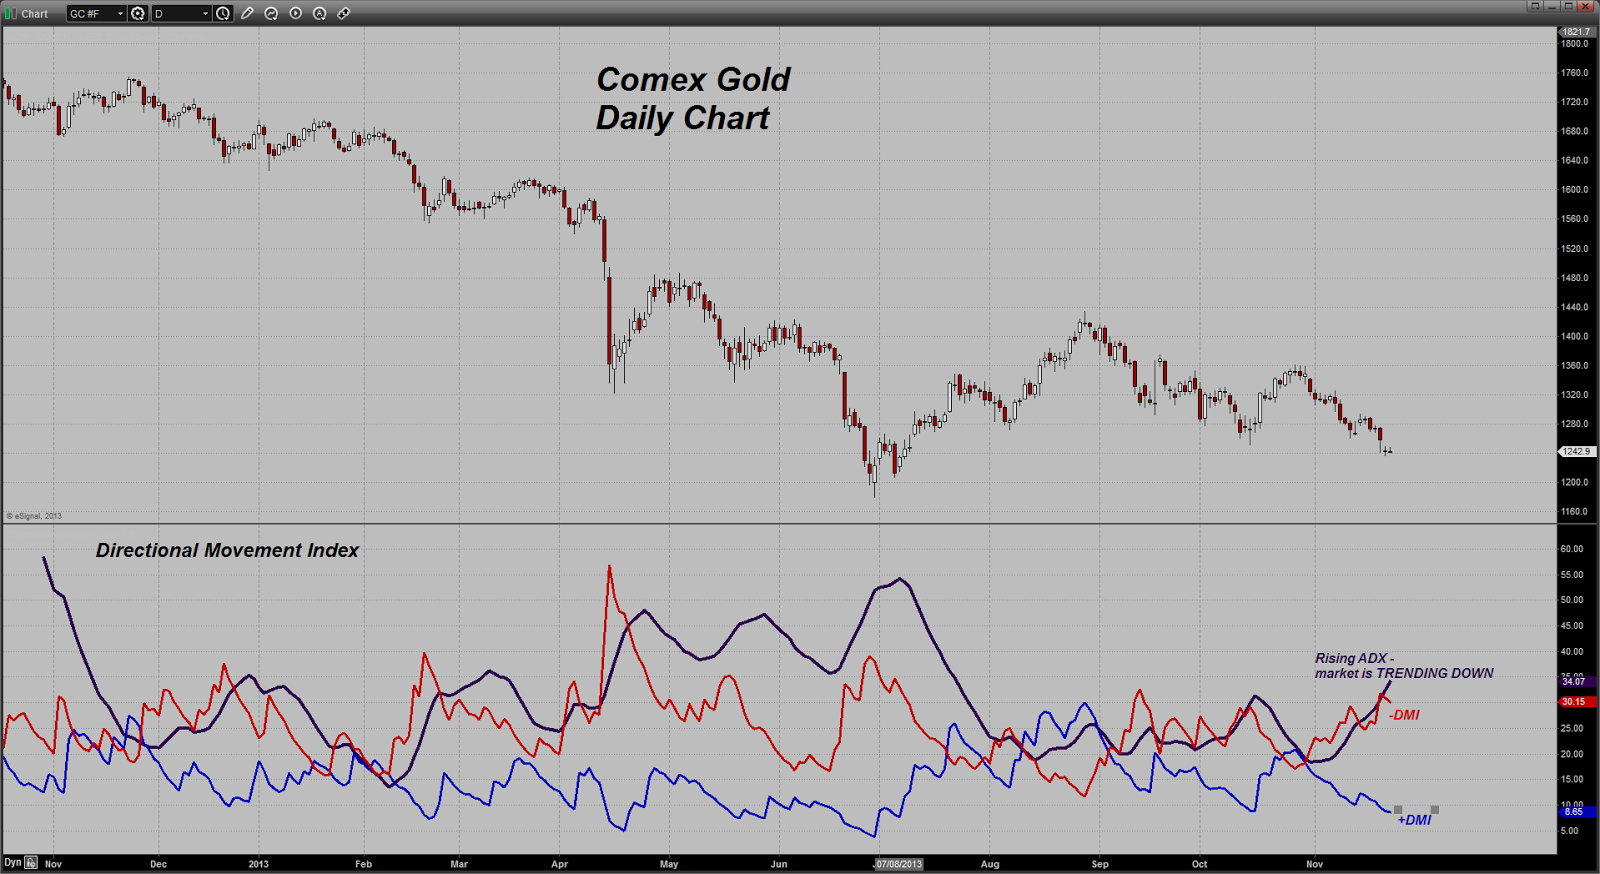
Let's start with the Daily Chart first....
Notice, Negative Directional Movement ( the Red Line) continues to remain ABOVE Positive Directional Movement ( the Blue Line ) indicating that the bears are in control of this market. Further, the ADX line is rising indicating the presence of a STRONG TRENDING MOVE. Because -DMI is above +DMI, we know that the trend is therefore DOWN.
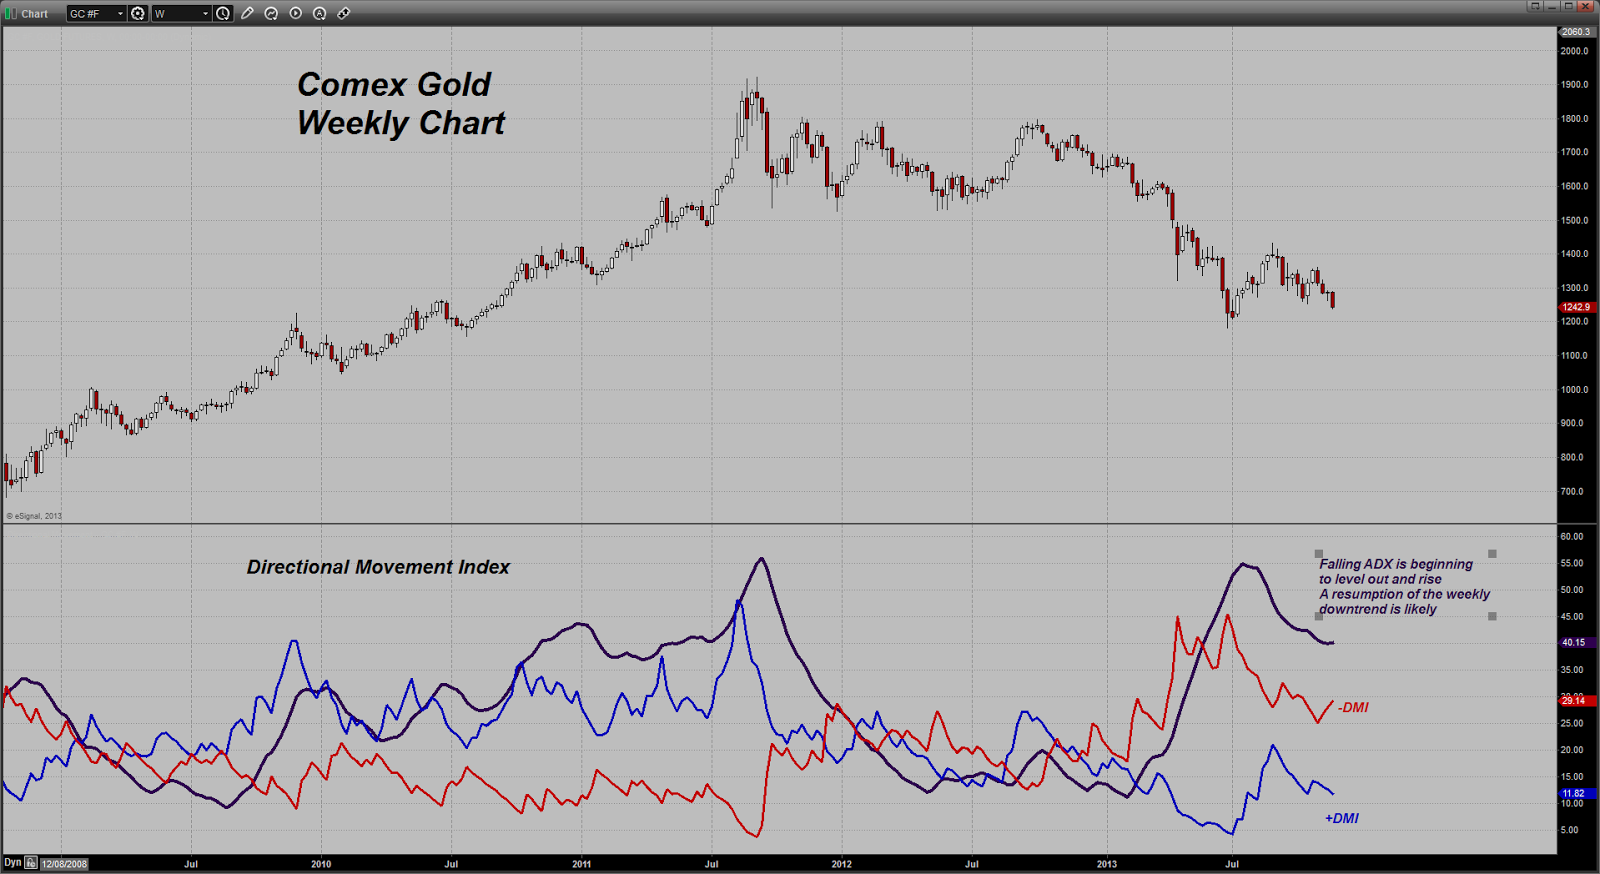
Let's now shift out to the intermediate or weekly time frame. There is one very noteworthy item that immediately stands out to any technician: Negative Directional Movement has been ABOVE Positive Directional Movement since late November of LAST YEAR. In other words, the Bears have had control of this market for a full year now. That is why it particularly distresses me to read so much of the foolishness that keeps coming out of some quarters of the gold community talking about such things as BACKWARDATION, GOFO rates, COIN DEMAND, etc. It makes for interesting reading and such but is of no value when it comes to interpreting the language of the gold market itself.
Furthermore, the ADX line had been steadily rising since the beginning of this year indicating the presence of a strong trending move lower until the middle of July when the line turned lower indicating a disruption in the ongoing downtrend.
As the price of gold recovered from the spike low near $1180, it rallied up to near $1420 relieving the downward pressure for a bit. However, and this is important to note, the -DMI remained above the +DMI during this time frame. That means the rally was merely a pause in the ongoing downtrend and that the bears still had control of the market.
What gives me reason for concern with gold is the fact that the ADX is showing signs of turning higher once again. It is likely, not guaranteed, that line will show a definite turn higher if gold cannot close higher this next week. Also, the market is moving down into a dangerous area. If it cannot attract the same kind of buying that it did back in the summer of this year, when demand soared higher, chart support will not be able to hold. It is imperative for this market that demand for the physical metal ramps up significantly right away or there is the danger that gold could start yet another leg down in price.
The last time frame we want to look at is the monthly chart. Something that stands out to me on this chart is the fact that the ADX has never yet ( since 2001 ) moved higher while gold was in a corrective phase lower. In other words, on the monthly chart, we have not yet had a period during which the market was in a DOWNTRENDING PHASE. All corrections lower in price were just that, corrections, not changes in the ongoing UPtrend. As you can see, the Negative Directional Movement line remained BELOW the BLUE or Positive Directional Movement Line even in 2008 when we had the debacle in the market. Bulls were remained in control of the market, even if they did just barely manage that.
However, in March of this year, for the first time since the bull market in gold began back in 2001, the Red line or Negative Directional Movement crossed ABOVE the Blue Line or Positive Directional Movement. The BEARS had seized control of the gold market. Shortly thereafter, the ADX line began to rise for the first time in over a decade while the price of gold moved lower, indicating what looked to be an incipient trending move lower. However the price recovery off of that spike low when gold moved up some $240 or so in price, dented the downtrend and the ADX began moving lower once again showing that the market was going into a consolidative phase.
Significantly, with the fall in the price of gold from $1400 to its current $1242, the ADX is threatening to turn higher once again. It is not yet there but it is certainly not falling. Translation - gold is flirting with indicating a trending move lower on the LONG term chart.
This is the reason I have been bearish on gold now for some time - the charts are indicating that bearish pressure is building in the market and is hinting at building across all three time frames. It is imperative for gold bulls that the price recovers strongly before the end of this year to prevent heading into the New Year with a strong bearish bias. Index fund rebalancing might help somewhat but with hedge funds plowing money into the short side of the gold market, Asian and middle East physical offtake is going to have to be large enough to absorb Western-based selling.
What worries me about gold is that the hedge funds still remain NET LONG, even if that position has shrunk to relatively low levels. That means that there remains more than enough firepower to take this market lower if those remaining long positions have to be jettisoned in the event of a breach of downside chart support.
Keep in mind that the first chart to respond to any upside movement in the metal will be the daily time frame. Thus we will continue to closely monitor the price action so look for any signs of a market turn higher first on that chart.- Dan Norcini, More at http://www.traderdannorcini.blogspot.com/
GATA Posts:

TF Metals Report: Perception deception
Another overnight intervention against gold
Pinnacle Digest elaborates on gold suppression, Zero Hedge on bank deposit fees
Michael Pento: What hypocrisy from Bernanke on QE
Iran will be allowed to buy gold but not take it as payment for oil
Jim Sinclair: My mission on our behalf
The Statistics:
As of close of business: 11/22/2013
Gold Warehouse Stocks: | 7,198,792.443 | +5,357.91 |
Silver Warehouse Stocks: | 170,970,768.971 | +440,985.10 |
Global Gold ETF Holdings
[WGC Sponsored ETFs]

| Product name | Total Tonnes | Total Ounces | Total Value |
New York Stock Exchange Arca (NYSE Arca) AND Singapore Exchange (SGX) AND Tokyo Stock Exchange (TSE) AND Hong Kong Stock Exchange (HKEx) AND Mexico Stock Exchange (BMV) | SPDR® Gold Shares | 852.209 | 27,399,356 | US$34,046m |
London Stock Exchange (LSE) AND NYSE Euronext Paris AND Borsa Italiana AND Frankfurter Wertpapierbörse (Deutsche Börse - Xetra) | Gold Bullion Securities | 138.13 | 4,441,056 | US$5,515m |
London Stock Exchange (LSE) AND NYSE Euronext Paris AND Borsa Italiana AND Frankfurter Wertpapierbörse (Deutsche Börse - Xetra) AND NYSE Euronext Amsterdam | ETFS Physical Gold | 152.66 | 4,908,200 | US$8,004m |
Australian Stock Exchange (ASX) | Gold Bullion Securities | 11.16 | 358,789 | US$445m |
Johannesburg Securities Exchange (JSE) | New Gold Debentures | 41.76 | 1,342,738 | US$1,713m |
Note: Change in Total Tonnes from yesterdays data: SPDR subtracted 4.501 tonnes.
COMEX Gold Trust (IAU) Total Tonnes in Trust: 170.30: -1.30 change from yesterdays data.
Silver Trust (SLV) Total Tonnes in Trust: 10,359.94: -44.93 change from yesterdays data.
The Miners:
Timberlines (TLR) development progress, Kirklands (KGI.TO) corrected second quarter operating results, Impact Silvers (IPT.V) third quarter results, Paramounts (PZG) drill results, and Fortunas (FSM) drill results were among the big stories in the gold and silver mining industry making headlines today.
WINNERS
1. Paramount | PZG +4.46% $1.17 |
2. Pretivm | PVG +3.95% $5.53 |
3. AuRico | AUQ +3.24% $3.82 |
LOSERS
1. DRDGOLD | DRD -4.65% $4.10 |
2. Seabridge | SA -3.15% $7.08 |
3. Allied Nevada | ANV -2.71% $3.23 |
Winners & Losers tracks NYSE and AMEX listed gold and silver mining stocks that trade over $1.
Please see Yahoos Mining/Metals News Wire for all of todays mining news.
- Chris Mullen, Gold Seeker Report
- Would you like to receive the Free Daily Gold Seeker Report in your e-mail? Click here
Additional Resources for todays Gold Seeker Report can be found:
© Gold Seeker 2013
Note: This article may be reproduced provided the article, in full, is used and mention to Gold-Seeker.com is given.
Disclosure: The owner, editor, writer and publisher and their associates are not responsible for errors or omissions. The author of this report is not a registered financial advisor. Readers should not view this material as offering investment related advice. Gold-Seeker.com has taken precautions to ensure accuracy of information provided. Information collected and presented are from what is perceived as reliable sources, but since the information source(s) are beyond Gold-Seeker.coms control, no representation or guarantee is made that it is complete or accurate. The reader accepts information on the condition that errors or omissions shall not be made the basis for any claim, demand or cause for action. Past results are not necessarily indicative of future results. Any statements non-factual in nature constitute only current opinions, which are subject to change. Nothing contained herein constitutes a representation by the publisher, nor a solicitation for the purchase or sale of securities & therefore information, nor opinions expressed, shall be construed as a solicitation to buy or sell any stock, futures or options contract mentioned herein. Investors are advised to obtain the advice of a qualified financial & investment advisor before entering any financial transaction.
-- Posted Monday, 25 November 2013 | Digg This Article | Source: GoldSeek.com


 Gold Seeker Closing Report: Gold and Silver Close Higher After Overnight Losses


