-- Posted Monday, 9 December 2013 | | Disqus
| Close | Gain/Loss |
Gold | $1240.60 | +$11.90 |
Silver | $19.87 | +$0.39 |
XAU | 82.48 | +2.08% |
HUI | 196.85 | +2.16% |
GDM | 580.00 | +1.95% |
JSE Gold | 1064.47 | -7.67 |
USD | 80.13 | -0.15 |
Euro | 137.40 | +0.36 |
Yen | 96.82 | -0.35 |
Oil | $97.34 | -$0.31 |
10-Year | 2.857% | -0.026 |
T-Bond | 130.90625 | +0.53125 |
Dow | 16025.53 | +0.03% |
Nasdaq | 4068.75 | +0.15% |
S&P | 1808.37 | +0.18% |
The Metals:
Gold edged down to $1227.33 at about 6:30AM EST before it climbed up to $1237.94 by late morning in New York and then fell back toward $1233 in early afternoon trade, but it then jumped to a new session high of $1242.98 in the last hour of trade and ended with a gain of 0.97%. Silver slipped to $19.476 before it rose to $19.814 and then also fell back off, but it then climbed to a new session high of $19.997 and ended with a gain of 2%.
Euro gold climbed to almost 903, platinum gained $15 to $1315, and copper climbed slightly to about $3.27.
Gold and silver equities rose about 2% in the first half hour of trade and remained near that level for the rest of the day.
The Economy:
Fed's Fisher wants December taper, clear path to end of QE3 Reuters
Fed's Lacker: Risks of further bond-buying outweigh benefits Reuters
Bullard Sees Odds of Taper Rising Along With Labor-Market Gains Bloomberg
There were no major economic reports today. Tomorrow brings Wholesale Inventories and JOLTS job openings data.
The Markets:

Charts Courtesy of http://finance.yahoo.com/
Oil ended slightly lower in mixed trade on the outlook for well-supplied markets.
The U.S. dollar index fell on mixed comments from various fed officials that sent treasuries higher.
The Dow, Nasdaq, and S&P traded mostly slightly higher on hopes for continued fed stimulus.
Among the big names making news in the market today were and Twitter, Sysco, OSI, and McDonalds.
The Commentary:
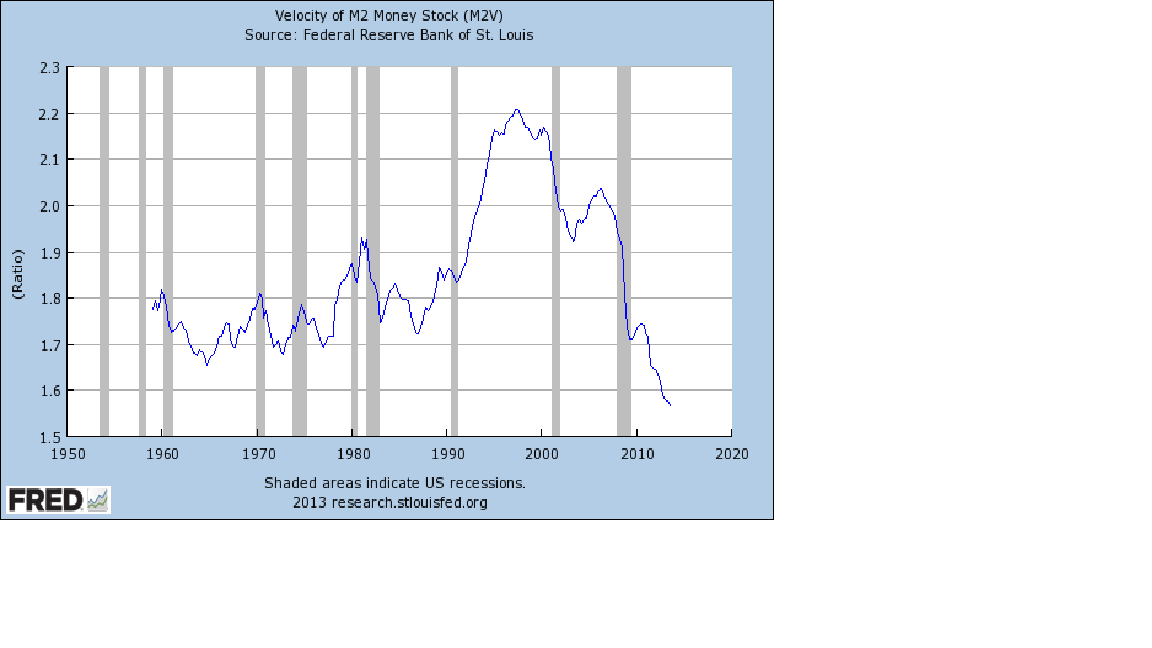
In response to some private emails, I wanted to post up a chart detailing why, in spite of the massive amount of money created through the Federal Reserve's Quantitative Easing, there simply does not seem to be a massive wave of inflation building here in the US. Some may be wondering why I tend to focus on this thing termed, "Velocity of Money" but in my view, even though at times it may seem to delve into the realm of the esoteric, nothing can be more important in determining the future direction of the gold price.
Many will recall that when the first QE program was instituted ( late 2008) commodity prices and stock prices both bottomed out. The view of the majority of investors/traders was that the creation of such enormous sums of money through bond buying and mortgage backed security buying was going to result in a sharp jump in inflation. Almost as if on cue, commodity prices began to rocket higher as hedge funds jumped in on the long side of that asset class.
As the initial QE I began to near expiration, the Fed announced round 2 and thus QE II was born. More commodity buying ensued with gold soaring higher, eventually reaching a peak above $1900.
A strange thing began to happen however after QE II wound down - after that was replaced by QE III, Operation Twist, and then QE IV, gold continued to move lower along with most of the rest of the commodity complex. The US equity markets continued to ascend however.
I am not an economist nor do I make any such pretense of so being. What I am is a trader and traders have to notice when markets no longer respond in the manner to which one expects or assumes that they will respond.
Something had changed and for whatever the reason ( we can leave that to those who are more sophisticated about such matters ) a general wave of deflationary pressures surfaced in the commodity complex. I maintain that most of the "money" being created by the QE programs has not and continues to NOT make its way into the broader economy. It has gone primarily into the hands of speculative forces which have directed into equities. In other words, while these QE programs have not resulted in the widespread outbreak of inflation that most market participants originally expected them to produce during rounds I and II, one thing I think we can say with absolute certainty, is they have indeed produced a MASSIVE WAVE OF INFLATION in the US EQUITY MARKETS.
Such huge sums of "money"/ liquidity cannot be conjured into existence WITHOUT SOME CONSEQUENCES SOMEWHERE. To believe otherwise is to suspend all economic common sense and logic.
Let me interject one note here when it comes to general commodity prices. Many who read this site have seen me use ( to the point of disabuse ) the phrase, " the best cure for high prices is high prices". What is meant by this is that high prices encourage those entities engaged in the creation/manufacture/production/growth of the various commodities that are rising in price to INCREASE their production in order to maximize their profits as they take advantage of this increase in the price.
This is capitalism at its finest - the market gives the signal and the industry responds to the signal. As the supply then increases due, it eventually overwhelms the demand at that level and price then falls to balance the new increase in supply with the current level of demand.
During the run up in commodity prices during QE I and QE II, producers/growers, etc. responded to the higher prices by ramping up the supply. As there is always a lag time between the rise in price and the subsequent increase in supply, we are now seeing that. One can merely look at the corn and soybean markets as an example. I had quipped to some newswire writers and some friends that these extreme prices for both of these commodities was going to send growers in both S. America and here in N. America down to their local Home Depot/Lowes to buy clay pots and other assorted window boxes so as to have even more space/"land" to plant these crops. Lo and behold, we put in a record corn crop this year and an extremely large bean crop. Ditto for S. America.
So now we have two forces that have been working against any rises in commodity prices ( in general ). The increase in supply resulting from higher prices a couple of years ago combined with an outflow of speculative money in SEARCH OF YIELD in this NEAR-ZERO interest rate environment.
This has been a bit of a digression from my main point here but I felt it was important enough to note this. Here is that chart again.
Note how in spite of the QE programs, this key indicator, has continued to fall. Again, not being an economist I cannot get into all the when, where's and why's about this indicator but suffice it to say, my understanding of the inflation phenomenon, in the sense of sharp jumps in inflation, requires that money be changing hands in the general economy at an INCREASING RATE. That is clearly not happening.
What is rather startling is that this indicator has fallen to its lowest level since this data set was collected. That was over 50 years ago!
Look closely at the last grey area on the chart indicating a recession. Can you see how the Velocity of Money plummeted during the onset and into the depth of the credit crisis that erupted in 2008? Then look at the brief blip higher on the right edge of that grey region. Velocity of Money shot up rather sharply when QE I was announced. However it did not last in that uptrend for long. The graph peaked in the second half of 2010 and has been moving lower ever since.
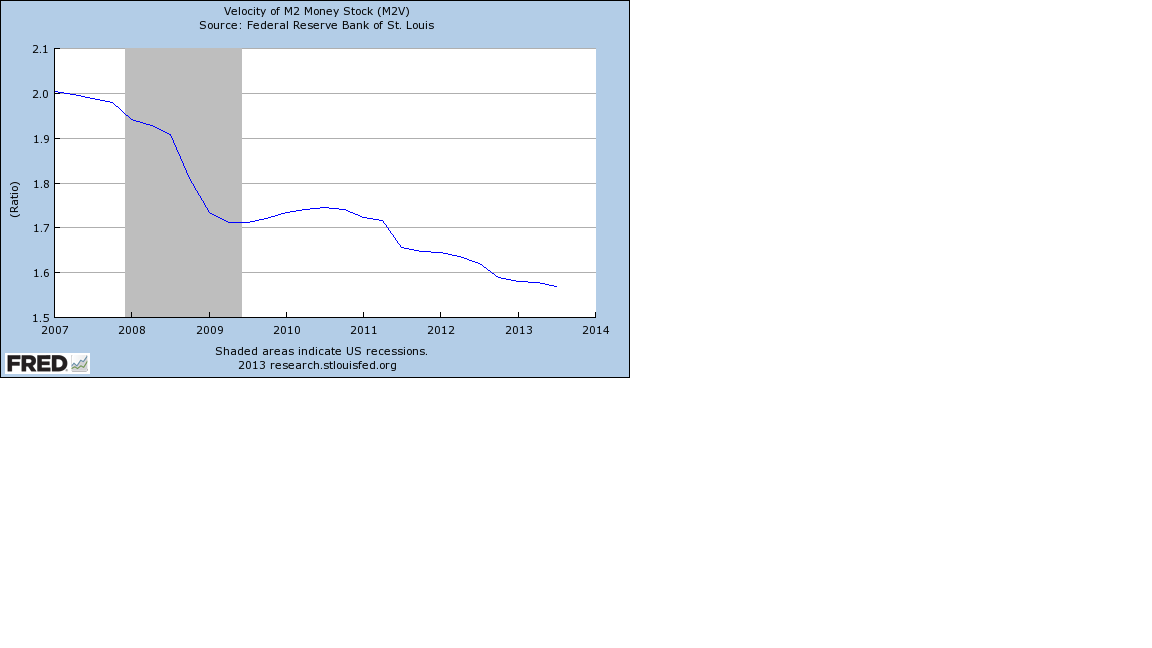
Here is a closer look.
Here is a chart of gold.
It continued moving higher for nearly a year after the Velocity of Money turned lower. Some of this is the result of the sharp fall in the US Dollar that began at precisely the same time that the Velocity of Money chart peaked.
Here is a chart of the US Dollar index peaking at the same time VoM turned lower.
We then had the outbreak of the European Sovereign Debt crisis which triggered another huge round of gold buying but once that crisis was "contained" ( not solved ) there was nothing left to support gold based on the "inflation is inevitable" prognosis as the Velocity of Money continued moving lower.
Note how gold turned lower after the ECB took actions to stem the bleeding in the European sovereign debt market.
It seems to me that gold is now basically mirroring the Velocity of Money at this point. Outbreaks of confidence-rattling episodes have brought buying into the metal, but once that issue(s) is(are) resolved, or better, removed from the forefront of trader/investor's minds, the path of least resistance takes over and gold heads downwards once again.
This now brings me full circle to why I believe any sort of SUSTAINED RALLY in the price of gold will not occur until either CONFIDENCE in the ability of the monetary masters is shattered or rattled, or INFLATION EXPECTATIONS begin to arise. The latter is tied directly to the Velocity of Money in my opinion. When/if we see that indicator turn higher, gold prices should respond. I do want to note however that it will be important to also watch the bond/interest rate market to confirm market sentiment in that regards.
As always, we can posit a theory but until the market confirms it and sentiment shifts in that direction, a theory is simply that, a theory, or better, an opinion.- Dan Norcini, More at http://www.traderdannorcini.blogspot.com/
GATA Posts:

Alasdair Macleod: The great game accelerates
JPM e-mails link China business with hiring ruling elite's kids
China's gold imports through Hong Kong are back near record high
BBC explains gold's suitability as money and its unique color
GATA Chairman Murphy interviewed by Future Money Trends
The Statistics:
As of close of business: 12/06/2013
Gold Warehouse Stocks: | 7,382,295.063 | +31,251.106 |
Silver Warehouse Stocks: | 169,071,616.204 | -498,474.896 |
Global Gold ETF Holdings
[WGC Sponsored ETFs]

| Product name | Total Tonnes | Total Ounces | Total Value |
New York Stock Exchange Arca (NYSE Arca) AND Singapore Exchange (SGX) AND Tokyo Stock Exchange (TSE) AND Hong Kong Stock Exchange (HKEx) AND Mexico Stock Exchange (BMV) | SPDR® Gold Shares | 835.705 | 26,868,753 | US$33,220m |
London Stock Exchange (LSE) AND NYSE Euronext Paris AND Borsa Italiana AND Frankfurter Wertpapierbörse (Deutsche Börse - Xetra) | Gold Bullion Securities | 138.13 | 4,441,056 | US$5,482m |
London Stock Exchange (LSE) AND NYSE Euronext Paris AND Borsa Italiana AND Frankfurter Wertpapierbörse (Deutsche Börse - Xetra) AND NYSE Euronext Amsterdam | ETFS Physical Gold | 152.66 | 4,908,200 | US$8,004m |
Australian Stock Exchange (ASX) | Gold Bullion Securities | 11.16 | 358,789 | US$446m |
Johannesburg Securities Exchange (JSE) | New Gold Debentures | 41.88 | 1,346,506 | US$1,674m |
COMEX Gold Trust (IAU) Total Tonnes in Trust: 168.97.
Silver Trust (SLV) Total Tonnes in Trust: 10,304.49.
The Miners:
SEMAFOs (SMF.TO) soil sampling program, Goldcorps (GG) land claim settlement progress, and Avinos (ASM) production report were among the big stories in the gold and silver mining industry making headlines today.
WINNERS
1. Paramount | PZG +6.93% $1.08 |
2. Timmins | TGD +5.71% $1.11 |
3. Almaden | AAU +4.76% $1.10 |
LOSERS
1. Tanzanian Royalty | TRX -5.06% $1.69 |
2. Alexco | AXU -4.88% $1.17 |
3. Avino | ASM -1.77% $1.11 |
Winners & Losers tracks NYSE and AMEX listed gold and silver mining stocks that trade over $1.
Please see Yahoos Mining/Metals News Wire for all of todays mining news.
- Chris Mullen, Gold Seeker Report
- Would you like to receive the Free Daily Gold Seeker Report in your e-mail? Click here
Additional Resources for todays Gold Seeker Report can be found:
© Gold Seeker 2013
Note: This article may be reproduced provided the article, in full, is used and mention to Gold-Seeker.com is given.
Disclosure: The owner, editor, writer and publisher and their associates are not responsible for errors or omissions. The author of this report is not a registered financial advisor. Readers should not view this material as offering investment related advice. Gold-Seeker.com has taken precautions to ensure accuracy of information provided. Information collected and presented are from what is perceived as reliable sources, but since the information source(s) are beyond Gold-Seeker.coms control, no representation or guarantee is made that it is complete or accurate. The reader accepts information on the condition that errors or omissions shall not be made the basis for any claim, demand or cause for action. Past results are not necessarily indicative of future results. Any statements non-factual in nature constitute only current opinions, which are subject to change. Nothing contained herein constitutes a representation by the publisher, nor a solicitation for the purchase or sale of securities & therefore information, nor opinions expressed, shall be construed as a solicitation to buy or sell any stock, futures or options contract mentioned herein. Investors are advised to obtain the advice of a qualified financial & investment advisor before entering any financial transaction.
-- Posted Monday, 9 December 2013 | Digg This Article | Source: GoldSeek.com


 Gold Seeker Closing Report: Gold and Silver Gain About 1% and 2%


