-- Published: Monday, 17 March 2014 | Print | Disqus
| Close | Gain/Loss |
Gold | $1366.20 | -$14.80 |
Silver | $21.13 | -$0.28 |
XAU | 102.91 | -3.10% |
HUI | 248.70 | -3.70% |
GDM | 746.00 | -2.76% |
JSE Gold | 1643.01 | -10.12 |
USD | 79.38 | -0.05 |
Euro | 139.26 | +0.21 |
Yen | 98.30 | -0.36 |
Oil | $98.08 | -$0.81 |
10-Year | 2.699% | +0.054 |
Bond | 134.34375 | -0.65625 |
Dow | 4279.95 | +1.13% |
Nasdaq | 16247.22 | +0.81% |
S&P | 1858.83 | +0.96% |
The Metals:
Gold edged up to $1392.08 in early Asian trade before it fell back to $1375.51 by a little before 10AM EST and then bounced back higher in late morning trade, but it then dropped to a new session low of $1362.04 in afternoon trade and ended with a loss of 1.07%. Silver slipped to as low as $21.124 and ended with a loss of 1.31%.
Euro gold fell to about 981, platinum lost $2 to $1461, and copper remained at about $2.96.
Gold and silver equities fell about 3% by midday and remained near that level for the rest of the day.
The Economy:
Report | For | Reading | Expected | Previous |
Empire Manufacturing | Mar | 5.6 | 5.4 | 4.6 |
Industrial Production | Feb | 0.6% | 0.1% | -0.2% |
Capacity Utilization | Feb | 78.8% | 78.5% | 78.5% |
NAHB Housing Market Index | Mar | 47 | 50 | 46 |
Tomorrow brings Housing Starts, Building Permits, and CPI.
The Markets:

Charts Courtesy of http://finance.yahoo.com/
Oil fell on relative calm in Ukraine.
The U.S. dollar index reversed early gains and ended slightly lower on mixed economic data.
Treasuries fell as the Dow, Nasdaq, and S&P jumped higher on easing geopolitical tensions.
Among the big names making news in the market today were VW, Vodafone, Chesapeake, and Fannie Mae.
The Commentary:
At the risk of further alienating some former "friends" in the gold community, I felt the necessity to post up a long term chart of the gold price so as to provide a bigger picture perspective of how I see this market at the current time.
The gold price has a nice recovery off of the double bottom near $1180 and in the process, has improved the balances of the long suffering bulls' investment portfolios. Those who failed to heed the charts on the breakdown of support at $1530-$1525 and instead listened to all the perma bulls and their various theories of why the market simply HAD TO GO HIGHER, are finally seeing a respite in the bleeding of their net worth. I am happy for them as some of them are advanced in years (I Have read their private emails to me) and were incredibly fearful of what these paper losses meant to their retirement plans or their livelihood.
By the way, for some of you folks, I do hope you have learned the painful lesson of being 100% invested in a single sector. Under any circumstances, that is simply not wise. Too many things can occur which none of us can foresee as we are at best mere mortals.
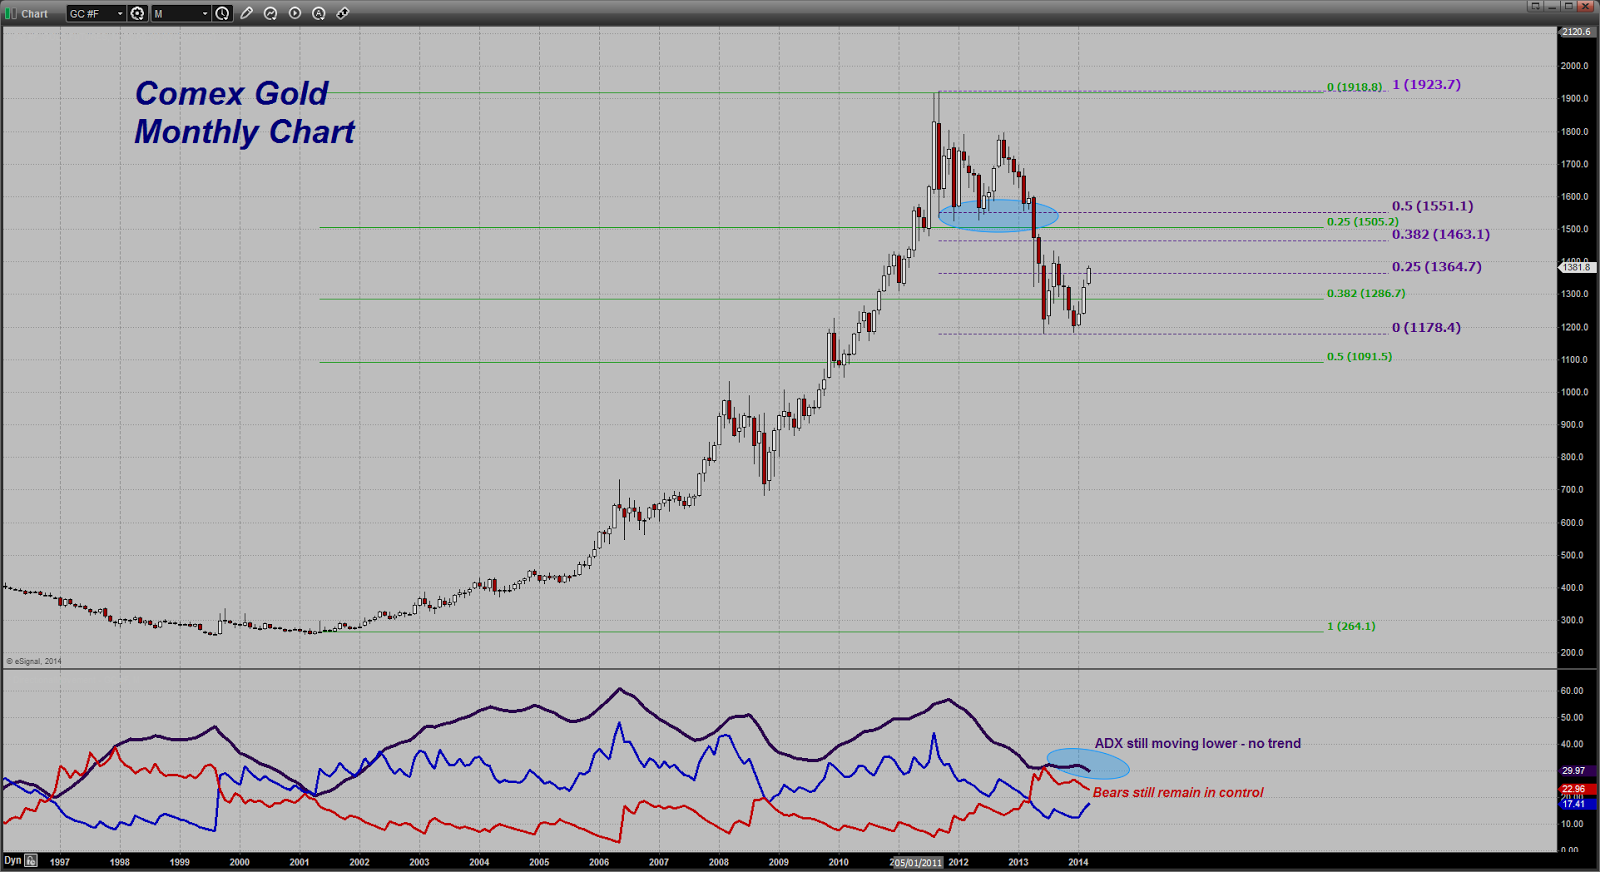
Let's start with the monthly gold chart and with my favorite technical indicator, the Directional Movement Index. I like this one (I use many others) because it helps me to gauge sentiment and that is what I am after as a trader.
For a bit of a refresher course - the index is comprised of three lines. Two of them are called Directional Movement Indicators. One is the Positive Directional Movement Indicator; the second is the Negative Directional Movement Indicator.
When price is moving higher or sideways, and the +DMI ( the BLUE LINE ) is above the -DMI ( the RED LINE ), the bulls are in control of the market and sentiment is bullish.
When price is moving lower or sideways, and the -DMI is above the +DMI, bears are in control of the market and sentiment is bearish.
The third line, the ADX line ( DARK PURPLE ) is the trending indicator. If it is rising, no matter if prices are going up or going down, the market is trending. If it is falling, the current trend has been interrupted and the market is either reversing course temporarily or moving sideways. Only if this line is rising is the market in a trending move.
With these few facts in mind, let's now apply this to the chart and see what we can discern.
Go back to the early inception of the decade+ long bull move in gold and look at late 1999. There, for the first time in some years, the +DMI crossed above the -DMI. The bulls had regained control of the market from the bears. However, look at the ADX line - notice is was moving lower. What does that tell you?
Answer - the downtrend that had been in place was interrupted but the market had NOT YET entered a trending move higher. All that this indicator was telling us was the bullish forces had asserted themselves with enough vigor that the bears could no longer gain any further downside traction.
It was not until 18 months or so later that the ADX began to turn higher indicating that the strong potential for a trending move was now present. A few months later, that is precisely what happened and look at what happened to the price - it moved $150 or so higher.
Here is what is important to note however and why my current view of gold is what it is - that gold is currently in a BEAR MARKET on the long term charts with the latest move higher a bear market rally. Take a look again at that +DMI line and compare it to the -DMI line. When that +DMI first crossed over the -DMI line back in 1999, it DID NOT once ever fall below that line again for a full 14 years! Please bear in mind that even with the sharp fall in price during the onset of the US credit crisis in 2008, when price imploded lower by over $300, the +DMI remained ABOVE the -DMI line. The two lines did meet but the negative crossover never occurred.
How do we interrupt this? Answer - even though the price had been walloped, bullish sentiment remained intact. Yes, it was battered and badly bruised, but it was still there.
Do you also see what was happening to the ADX line. Over this same period, it never once ROSE DURING A PERIOD OF FALLING PRICES. What does this tell you? Answer - all moves lower in price were viewed as price retracements in an ongoing bull market. The idea of a LONG TERM BEARISH TREND did not exist.
Now, let's look at what happened in early 2013. Do you see it and do you the significance of that event? If you guessed that the -DMI crossed above the +DMI and that the bears had seized control of this market for the first time in 14 years, go to the head of the class! In other words, the bullish sentiment had been finally broken completely. Bearish forces were now in ascendency in gold.
If you also look closely, you can see for the first time that the ADX line, the trending indicator stopped moving lower during this fall in price and actually began turning higher as price moved lower. For the first time in over a decade, the potential for a trending move LOWER was in place.
That potential was aborted when the price refused to break any lower than $1180, ( not far from the industry average of the cost of production ) and the potential downtrend was halted. However, the -DMI line remained above the +DMI line revealing that bearish sentiment towards gold remained intact.
If you look at the area within the ellipse noted on the chart, you can see that the ADX is again moving lower, this time as the price moves higher. That tells me that the market has not yet resumed a bullish trend higher. What it tells us is that the market is moving sideways and while the bears remain in control, the bulls are attempting to regain control of the market. As long as the +DMI remains below -DMI, the bears, while ceding ground at the moment, still dominate.
That explains the Directional Movement Indicator and why I maintain my view that the current move higher is a rally in a longer term bear market. Based on this analysis, gold is moving sideways (falling ADX) and is in a range trade between $1425 on the top and $1180 on the bottom. Now one may not agree with my assessment, but that is the interpretation based on my analysis of this particular indicator. Again, one can disagree with using this indicator but I am basing my view on how this same indicator has served us so adequately over the last 14 years. That is an objective interpretation and as such as it is a fact.
Now note the Fibonacci Retracement levels I have noted on the chart. I have drawn them (the purple dashed lines) off the all time high above $1900 to the double bottom low at $1180. As you can see, gold has managed to claw its way above the first Fibonacci retracement level of that plunge, which is the 25% retracement currently coming in near $1365. Can you now see why there was such a battle at that region and why gold seemed to hesitate before punching through this level last week?
Notice that the next important Fibonacci retracement level does not come in until near the $1463 level ( please bear in mind that I do not use the hard number but rather look at the zone near that area). If gold can crack resistance near $1425, that looks to me to be the most viable nearer term target.
However, and this is a biggie - the 50% retracement level - the level that is most commonly noted and which carries the most significance from a technical analysis perspective, does not come in until near the $1550 region. I think it no small matter that this region is not that far removed from the critical former support level within the ellipse drawn on the chart, namely the $1525-$1530 level. Remember, it was the downside violation of that level that started a bear market in gold; therefore for gold to undergo a change from a bear market to a bull market that level MUST BE RECAPTURED by the bulls and price must stay above it.
I have no doubt that should such a thing occur, the ADX line would be moving higher and the +DMI line would be firmly above the -DMI line.
Let's take a look at one last thing and we are done - I have also drawn in another set of Fibonacci Retracement levels (the green lines ) that mark the bottom or beginning of the bull market in gold near 250-260 and extend to the high near $1920. That is also to provide some perspective. I did not want to emphasize this set of Fibonacci retracement levels too much because I am using the ADX and the +DMI and -DMI to essentially filter my reliance on this latter set. Those are clearly bearish.
However, I have noticed over the years, that the principle of reverse polarity oftentimes extends to the use of Fibonacci levels. This means that those former levels which oftentimes mark areas of chart support or resistance, can serve as resistance on the way back if - if they served as support on the way down - or vice versa.
Note how the price fall did not fall below the 50% retracement level near $1091. It has since then moved back above the 38.2% retracement level near $1287 but remains well below the 25% retracement level at $1505.
Putting this altogether, one can see levels at which they expect opposition to gold's advance intensify should it continue to move higher. Start near $1463 and go on up to $1550 or so and you have a big zone where selling can be expected to show up in size. You can also see that if bullish forces can take out these respective levels, the bears are going to be on the defensive if their lines are shattered.
I would also think that for the metal to claw itself back up to that region, some significant events, either geopolitically or economically, are going to have occurred.
Let's see how events unfold and what we get moving forward. For now, I am done writing this weekend and need a break!- Dan Norcini, More at http://www.traderdannorcini.blogspot.com/
GATA Posts:

Russia has big advantage in confrontation over Ukraine, Sinclair says
Gold trading to open up to foreigners in Shanghai
Koos Jansen: New York Fed lying about gold storage
The Statistics:
Activity from: 3/14/2014
Gold Warehouse Stocks: | 7,104,660.431 | - |
Silver Warehouse Stocks: | 182,262,347.600 | -575,116.17 |
Global Gold ETF Holdings
[WGC Sponsored ETFs]

| Product name | Total Tonnes | Total Ounces | Total Value |
New York Stock Exchange Arca (NYSE Arca) AND Singapore Exchange (SGX) AND Tokyo Stock Exchange (TSE) AND Hong Kong Stock Exchange (HKEx) AND Mexico Stock Exchange (BMV) | SPDR® Gold Shares | 816.593 | 26,254,283 | US$36,172m |
London Stock Exchange (LSE) AND NYSE Euronext Paris AND Borsa Italiana AND Frankfurter Wertpapierbörse (Deutsche Börse - Xetra) | Gold Bullion Securities | 138.13 | 4,441,056 | US$6,089m |
London Stock Exchange (LSE) AND NYSE Euronext Paris AND Borsa Italiana AND Frankfurter Wertpapierbörse (Deutsche Börse - Xetra) AND NYSE Euronext Amsterdam | ETFS Physical Gold | 152.66 | 4,908,200 | US$8,004m |
Australian Stock Exchange (ASX) | Gold Bullion Securities | 11.16 | 358,789 | US$492m |
Johannesburg Securities Exchange (JSE) | New Gold Debentures | 40.03 | 1,287,107 | US$1,783m |
Note: Change in Total Tonnes from yesterdays data: SPDR added 3.297 tonnes.
COMEX Gold Trust (IAU) Total Tonnes in Trust: 165.14: No change from yesterdays data.
Silver Trust (SLV) Total Tonnes in Trust: 10,164.74: No change from yesterdays data.
The Miners:
AuRicos (AUQ) priced notes, Buenaventuras (BVN) resumed operations, MAG Silvers (MVG) assay results, Silvercorps (SVM) drill results, and Great Panthers (GPL) resumed operations were among the big stories in the gold and silver mining industry making headlines today.
WINNERS
1. ITH | THM +24.73% $1.16 |
2. Mines Management | MGN +9.02% $1.4063 |
3. Alexco | AXU +5.45% $2.13 |
LOSERS
1. Fortuna | FSM -14.35% $4.06 |
2. McEwen | MUX -12.36% $3.12 |
3. Rio Alto | RIOM-11.02% $2.10 |
Winners & Losers tracks NYSE and AMEX listed gold and silver mining stocks that trade over $1.
Please see Yahoos Mining/Metals News Wire for all of todays mining news.
- Chris Mullen, Gold Seeker Report
- Would you like to receive the Free Daily Gold Seeker Report in your e-mail? Click here
Additional Resources for todays Gold Seeker Report can be found:
© Gold Seeker 2014
Note: This article may be reproduced provided the article, in full, is used and mention to Gold-Seeker.com is given.
Disclosure: The owner, editor, writer and publisher and their associates are not responsible for errors or omissions. The author of this report is not a registered financial advisor. Readers should not view this material as offering investment related advice. Gold-Seeker.com has taken precautions to ensure accuracy of information provided. Information collected and presented are from what is perceived as reliable sources, but since the information source(s) are beyond Gold-Seeker.coms control, no representation or guarantee is made that it is complete or accurate. The reader accepts information on the condition that errors or omissions shall not be made the basis for any claim, demand or cause for action. Past results are not necessarily indicative of future results. Any statements non-factual in nature constitute only current opinions, which are subject to change. Nothing contained herein constitutes a representation by the publisher, nor a solicitation for the purchase or sale of securities & therefore information, nor opinions expressed, shall be construed as a solicitation to buy or sell any stock, futures or options contract mentioned herein. Investors are advised to obtain the advice of a qualified financial & investment advisor before entering any financial transaction.
| Digg This Article
-- Published: Monday, 17 March 2014 | E-Mail | Print | Source: GoldSeek.com


 Gold Seeker Closing Report: Gold and Silver Fall Over 1%


