-- Published: Thursday, 15 May 2014 | Print | Disqus
| Close | Gain/Loss |
Gold | $1295.60 | -$10.50 |
Silver | $19.48 | -$0.29 |
XAU | 89.33 | -1.42% |
HUI | 218.87 | -1.65% |
GDM | 654.44 | -1.46% |
JSE Gold | 1471.02 | -11.62 |
USD | 80.04 | -0.02 |
Euro | 137.10 | -0.03 |
Yen | 98.45 | +0.28 |
Oil | $101.50 | -$0.87 |
10-Year | 2.502% | -0.041 |
Bond | 137.6875 | +0.65625 |
Dow | 16446.81 | -1.01% |
Nasdaq | 4069.29 | -0.76% |
S&P | 1870.85 | -0.94% |
The Metals:
Gold edged down to $1301.44 in late Asian trade before it bounced back to $1306.36 in London and then dropped to a new session low of $1293.01 by a little after 8:30AM EST, but it then bounced back higher in late trade and ended with a loss of just 0.8%. Silver slipped to as low as $19.437 and ended with a loss of 1.47%.
Euro gold fell to about 945, platinum lost $17 to $1461, and copper fell a couple of cents to about $3.14.
Gold and silver equities fell almost 2% by late morning and remained near that level for the rest of the day.
The Economy:
Report | For | Reading | Expected | Previous |
Initial Claims | 5/10 | 297K | 325K | 321K |
CPI | Apr | 0.3% | 0.3% | 0.2% |
Core CPI | Apr | 0.2% | 0.2% | 0.2% |
Empire Manufacturing | May | 19.0 | 4.8 | 1.3 |
Net Long-Term TIC Flows | Mar | $4.0B | - | $90.3B |
Industrial Production | Apr | -0.6% | 0.0% | 0.9% |
Capacity Utilization | Apr | 78.6% | 79.2% | 79.3% |
Philadelphia Fed | May | 15.4 | 9.1 | 16.6 |
NAHB Housing Market Index | May | 45 | 48 | 46 |
Tomorrow brings Housing Starts, Building Permits, and Michigan Sentiment.
The Markets:

Charts Courtesy of http://finance.yahoo.com/
Oil fell along with the U.S. dollar index on mixed economic data in the US and Europe that sent treasuries higher and the Dow, Nasdaq, and S&P lower.
Euro zone first-quarter growth disappoints, puts pressure on ECB to act Reuters
Euro Growth Diverges; Strong Germany Offsets France Bloomberg
Among the big names making news in the market today were Cisco, UBS, AerCap, Genworth, GM, Kindred Healthcare, Wal-Mart, and AstraZeneca.
The Commentary:
Yesterday we got a surprise PPI number. Today we got a CPI that came in right on expectations. It showed a seasonally adjusted 0.3% rise over April, which was the biggest increase since June of last year.
Much is being made of the rise in food prices which were up 0.4% compared to last month, and which have increased four straight months now. Meat prices in particular have risen sharply putting in their largest increase since 2003.
However, as I have made clear many times here recently, the CPI is a BACKWARD looking indicator. It measures "that which has been" not "that which shall be".
Just today, corn prices fell to a SIX WEEK LOW. Wheat prices have hit a three week low as widespread rains have put a halt to the drought/heat induced deterioration in the crop.
The spread between old crop beans and new crop beans is nearly $2.60 a bushel. Just today Informa raised expected soybean acreage to a stunning 82.1 million acres. Looking FORWARD, barring any severe weather issues this growing season, there will be more than enough soybeans around to meet existing demand.
Incidentally, soybean crush was 132.67 million bushels compared to last month's 153.84. High prices continue to eat away at demand.
By the fourth quarter of this year, meat prices will begin to ease lower with supplies increasing in Q1 2015.
What I am saying is that price pressures in the food component of the CPI should ease later this year.
Energy remains a wild card. Gasoline prices rose 2.4%, which was the first gain since December of last year. If you observe the price chart however, gasoline prices spiked higher during the month of April pushing above December's level but have since fallen back somewhat. We will want to monitor this key commodity as it has such a big impact on both the consumer and on business. I am surprised that crude oil prices have been able to stay above the $100/barrel level but the market is proving to be rather resilient. I personally would love to see it move closer to $92 - $93 as it would push the price of gasoline lower and we consumers love that. Right now that appears to be rather unlikely.
Medical costs are worth noting - They rose 0.3% last month and are up 2.4% compared to a year ago.
In other economic news - the Philly Fed May Business Index came in at 15.4 compared to April's 16.6. New orders were at 10.5 versus 14.8.
US April Industrial Production was down -0.6% compared to the market expectation of a -0.1% decline. The March number was revised upward however to a 0.9% increase from the previous 0.7% increase. Capacity utilization fell 0.7% to 78.6%. The market was looking for 79.0%.
Jobless claims were the big mover today - the number for initial unemployment claims plunged by 24,000 to a SEVEN YEAR low of 297,000. The market had been looking for a slight increase to 320,000. This number is notorious for its volatility so we will want to see next month's numbers but for right now, traders are interpreting the data as further evidence that the employment situation in the country is slowly improving. The Labor Department did issue a report showing that INFLATION ADJUSTED average weekly earnings actually fell 0.3% in April from March. Without the adjustment, wages were flat.
There still appears to be a great deal of slack in the labor market and that is working to hold down inflationary pressures. This phenomenon seems to be widespread in the Western economies at the moment and is one of the reasons that Central Bankers do not appear particularly concerned about the about of widespread inflation pressures at the moment.
Equity markets were pummeled lower today with the S&P 500 down nearly 1.5% as I type these comments. The HUI is down even harder (near 1.67%).
The key index is perched precariously above a key chart support zone once again. So far it is holding but it does seem that general equity weakness tends to impact the mining shares more severely than the S&P 500 itself.
Bonds of course are going in the opposite direction and having yet another huge rally with the yield on the Ten Year falling below 2.5% at the moment.
I find it absolutely amazing at how skillful these Central Bankers have become at scaling back bond buying programs all the while without impacting the demand for bonds in the slightest. Remember all the talk coming from the perma gold bull community that as soon as the Fed stopped or scaled back their QE programs, that interest rates were going to soar because no one would be left to buy bonds? Well guess what - that is another prediction that has been proven to be completely and utterly wrong. Demand for bonds is still very strong at the moment. It should be borne in mind that the Fed is still buying bonds - albeit at a reduced level - and that its balance sheet is still growing. For whatever the reason, demand for bonds is currently exceeding the available supply and thus the price of the bonds is rising with interest rates moving correspondingly lower.
Along this same line however, the Bank of Canada's Schembri today was quoted saying that these "low interest rates pose a serious challenge for pension funds". Ain't that the truth and do not forget senior citizens and those living on fixed incomes. Those of you who have senior parents alive are all too sadly aware of this. Many hedge fund managers however are thrilled with these low rates as their fears of slowing global growth have most of them singing from the same hymn book.
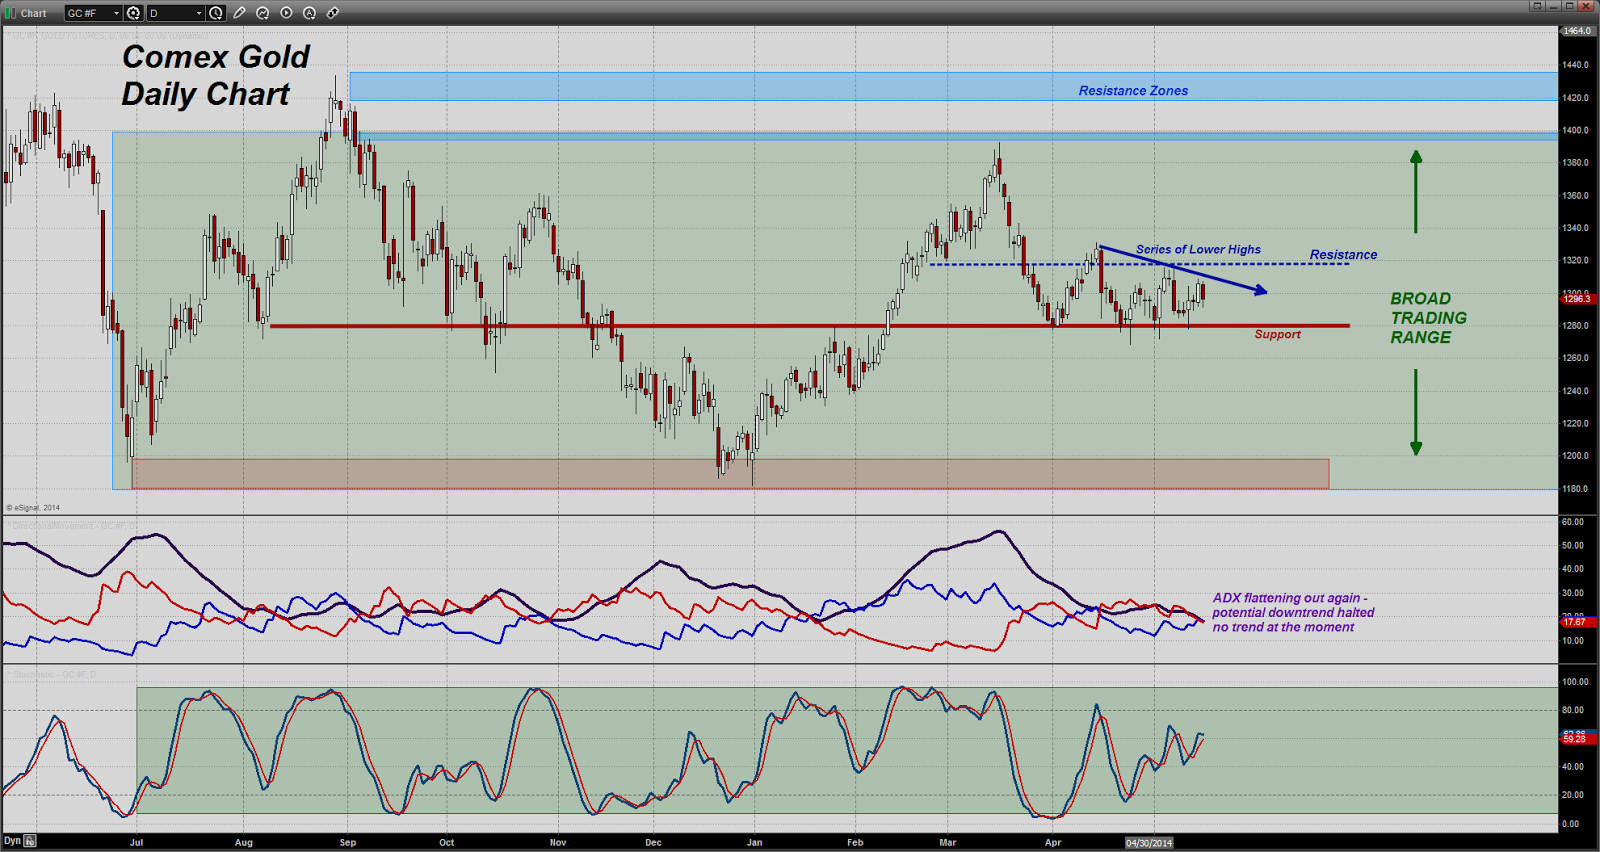
Back to gold for a moment - the price chart continues to show the metal range bound but that series of lower highs is also continuing. Rallies are being sold. The giant gold ETF, GLD, now has reported gold holdings at 780.46 tons, that is down from the ending level last week of 782.85 tons. Thus far the ETF has shed 2.4 tons of gold this week. It will be interesting to see what the number comes in at by the end of trading this Friday, especially if gold fails to recapture the psychological "13" handle.
One last comment for now, the Treasury's International Capital Flows data (TIC) showed that Russia's US Treasury holdings fell $25.8 billion in March to $100.4 billion. Their holdings as of February had been $126.2 billion. This can be explained as investors, fearing the impact of Western-backed sanctions, yanked money out of Russia. The exodus of capital caused the ruble to fall and this induced the Russian Central Bank to intervene in the forex markets. To do so, they would have needed to sell US Treasuries to raise the Dollars needed to sell those to keep the ruble from dropping even more sharply than it did.
In looking at the report, China's holdings are essentially unchanged from this same time last year (1272.1 billion to 1270.3 billion). Japan's holdings are up from 1114.3 billion to 1200.2 billion, an increase of $85.9 billion.
The chatter going around is that Belgium is taking up the slack in Treasury buying brought about by the Fed's tapering program. Belgium holdings are at $381.4 billion compared to last year's $188.4 billion, an increase of $193 billion. That is a big increase over the last year.
However, in going through the data, I have decided to start with the month of June 2013 and do some examination. Why? Because that is the month during what all adjustments are made in the TIC data. You see, many foreign buyers of US Treasuries, will do their buying through banks IN OTHER COUNTRIES other than their own. That shows up in the country in which the banks are located. However, that data does not show the originating buyer of the Treasuries but only the country in which the transaction was conducted. In June of each year, the Treasury Department will then properly credit the actual ownership of the Treasuries to the host country. Generally at that time, we will then see a big adjustment in the reported holdings of the various countries. That is the data I am interested in seeing. In the past, we have seen big buying out of the United Kingdom which then, during June, has been moved out of the UK and credited to China. In other words, a great deal of Chinese Treasury buying had been done through London banks which when properly credited, ends up in China.
I suspect we might have some of the same thing occurring with this Belgium deal but of course we will have to wait until the report showing the June updates is released. That will be three months from now unfortunately.
But let's go back to June of 2013. It reported Belgium holdings were at $176.2 billion. As of March 2014, those holdings are at $381.4 billion. That is a $205.2 billion increase. That certainly is a big increase.
China lowered their holdings by around $3.7 billion.
Japan's reported Treasury holdings as of June 2013, were at $1083.3 billion. They are currently sitting at $1200.2 billion. That is a 116.9 billion increase, a fairly sizeable jump.
The Caribbean Banking Centers were at $286.3 billion and increased by $26.2 billion to $312.5 billion. Those are often used by hedge funds.
Brazil registered a slight decrease in holdings from June (about $8 billion). Taiwan dropped about $10 billion and Switzerland lowered their holdings by about $5 billion. Opec dropped by around $19 billion.
Those were mostly offset by increases in the UK of about $13 billion and Hong Kong by some by some $21 billion.
So what does all this mean? Right now, not much because we do not know where the final destination of those holdings are going to end up in June this year when Treasury does its annual adjustments.
But the fact that it is Belgium, the headquarters of the European Union doing the buying is interesting. That is because the various European nations, Germany, France, Italy, etc. that make up the EU are listed separately. We can speculate what is going on with that but one thing that I am wondering is whether or not the ECB might be buying US Treasuries as a way to undermine some of the stubborn strength that has been seen in the Euro.
Back in March of this year, the Euro was quite strong, trading near the 1.39 level for some time that month. I am only guessing as I have no proof whatsoever, but it is no secret that many European based political and monetary leaders do not want a strong Euro. Perhaps, that Treasury buying has been to derail some of the Euro's strength in relation to the US Dollar. I simply do not know but the fact that ECB President Mario Draghi felt compelled to talk down the Euro last week is rather revealing if you ask me.
One last thing - while this TIC data is interesting, the majority of US Treasuries are still owned internally here in the US. By that I mean private investors, pension funds, mutual funds, etc. Those investors, looking to take some of the gains that they have made in equities and put that aside into something more conservative while they try to get a sense of what the next direction in the broader equity markets might be, should not be underestimated.
Perhaps my friend Eric de Groot might be able to shed a bit of light on this as he is very good at studying money flows.- Dan Norcini, More at http://www.traderdannorcini.blogspot.com/
GATA Posts:

Andy Hoffman: Speck-tacular analysis
What has the Swiss National Bank been doing with the country's gold reserves?
The Statistics:
Activity from: 5/14/2014
Gold Warehouse Stocks: | 8,060,705.912 | - |
Silver Warehouse Stocks: | 175,106,654.378 | -814,273.22 |
Global Gold ETF Holdings
[WGC Sponsored ETFs]

| Product name | Total Tonnes | Total Ounces | Total Value |
New York Stock Exchange Arca (NYSE Arca) AND Singapore Exchange (SGX) AND Tokyo Stock Exchange (TSE) AND Hong Kong Stock Exchange (HKEx) AND Mexico Stock Exchange (BMV) | SPDR® Gold Shares | 780.456 | 25,092,435 | US$32,575m |
London Stock Exchange (LSE) AND NYSE Euronext Paris AND Borsa Italiana AND Frankfurter Wertpapierbörse (Deutsche Börse - Xetra) | Gold Bullion Securities | 138.13 | 4,441,056 | US$5,757m |
London Stock Exchange (LSE) AND NYSE Euronext Paris AND Borsa Italiana AND Frankfurter Wertpapierbörse (Deutsche Börse - Xetra) AND NYSE Euronext Amsterdam | ETFS Physical Gold | 152.66 | 4,908,200 | US$8,004m |
Australian Stock Exchange (ASX) | Gold Bullion Securities | 11.16 | 358,789 | US$465m |
Johannesburg Securities Exchange (JSE) | New Gold Debentures | 40.85 | 1,313,469 | US$1,709m |
Note: No change in Total Tonnes from yesterdays data.
COMEX Gold Trust (IAU) Total Tonnes in Trust: 164.02: No change from yesterdays data.
Silver Trust (SLV) Total Tonnes in Trust: 10,320.26: No change from yesterdays data.
The Miners:
Eurasians (EMXX) optioned project and first quarter results, Rio Altos (RIOM) drill results, and Timberlines (TLR) second quarter results were among the big stories in the gold and silver mining industry making headlines today.
WINNERS
1. Rio Alto | RIOM +3.09% $2.00 |
2. Gold Resource | GORO +1.39% $4.37 |
3. Comstock | LODE +0.60% $1.67 |
LOSERS
1. DRDGOLD | DRD -9.87% $2.75 |
2. Timmins | TGD -5.52% $1.37 |
3. Silver Standard | SSRI -5.02% $7.75 |
Winners & Losers tracks NYSE and AMEX listed gold and silver mining stocks that trade over $1.
Please see Yahoos Mining/Metals News Wire for all of todays mining news.
- Chris Mullen, Gold Seeker Report
- Would you like to receive the Free Daily Gold Seeker Report in your e-mail? Click here
Additional Resources for todays Gold Seeker Report can be found:
© Gold Seeker 2014
Note: This article may be reproduced provided the article, in full, is used and mention to Gold-Seeker.com is given.
Disclosure: The owner, editor, writer and publisher and their associates are not responsible for errors or omissions. The author of this report is not a registered financial advisor. Readers should not view this material as offering investment related advice. Gold-Seeker.com has taken precautions to ensure accuracy of information provided. Information collected and presented are from what is perceived as reliable sources, but since the information source(s) are beyond Gold-Seeker.coms control, no representation or guarantee is made that it is complete or accurate. The reader accepts information on the condition that errors or omissions shall not be made the basis for any claim, demand or cause for action. Past results are not necessarily indicative of future results. Any statements non-factual in nature constitute only current opinions, which are subject to change. Nothing contained herein constitutes a representation by the publisher, nor a solicitation for the purchase or sale of securities & therefore information, nor opinions expressed, shall be construed as a solicitation to buy or sell any stock, futures or options contract mentioned herein. Investors are advised to obtain the advice of a qualified financial & investment advisor before entering any financial transaction.
| Digg This Article
-- Published: Thursday, 15 May 2014 | E-Mail | Print | Source: GoldSeek.com


 Gold Seeker Closing Report: Gold and Silver Fall About 1%


