-- Published: Tuesday, 7 July 2020 | Print | Disqus
Kirkland Lake Gold has been one of the biggest winners over the past 5yrs, propelling itself from a 160k oz. Au producer to what has emerged [along with Endeavour Mining] as the next senior gold producer [1m oz. of production or greater]. Kirkland Lake has a great asset to start, the Kirkland Lake mining complex, notably the Macassa mine, which has taken several years to optimize and will reach full strike in 2023/2024. What has really propelled its stock price in recent years was the acquisition and optimization of Newmarket Golds for its cornerstone Fosterville Mine. Kirkland acquired [during the bear market in gold] both St. Andrews Goldfields and Newmarket Gold.
More recently it made a second transformational through the acquisition of Detour Gold, which propelled the company firmly in the ranks of a senior producer in 2020. Kirkland Lake withdrew guidance in 2020 and recently provided updated guidance. 2020 production guidance of 1.35-1.4m oz. Au [210-220k oz. Au (Macassa), 520-540k oz. Au (Detour Lake), 29k oz. and 590-610k oz. Au (Fosterville). Both operating costs and all-in sustaining costs (AISC) were actually lowered to $410-$430/oz. and $790-$810/oz., which will allow the company to generate very substantial cash flow in what has been a crazy year due to mandated shutdowns a result of CV19. It is worth noting that this updated guidance (and the original guidance) excluded production from the Holt Complex and other operations in the Northwest Territories. The entirety of its asset portfolio is located in tier-1 mining jurisdictions. Not only does Kirkland Lake generate significant cash flow, but it has what it arguably the most pristine balance sheet in the gold mining sector, at least its cash flow generation, cash position, and the fact it is debt free. It also has a number of substantial investments in various companies.
The acquisition (of Detour) was nearly perfectly timed, announced about 6-months following the breakout in gold beyond the six-year resistance level of $1,350/oz. At the time gold stocks were priced as if the gold price was quite a bit lower than the prevailing spot price in addition to Kirkland having a very low cost of equity. This continues to be the case but the royalty and streaming companies along with most senior gold producers are pricing in gold prices that is roughly equal to spot/closest future price less (-$50/oz.) to (-$100/oz.). Gold prices at the time of this writing are a firm +$175/oz. higher relative to when the deal was announced.
Prior to the acquisition, Kirkland Lake was unquestionably one of the premier mid-tier/emerging senior producers. Nonetheless, the market punished Kirkland Lake because Detour Lakes cost structure is significantly higher relative to its two other cornerstone assets and has since fallen out of favor, at least relative to the valuation prior to the announcement of the deal, in which the stock price was trading considerably higher at a lower gold price.
Kirkland Lake believes it can reduce AISC (at Detour) from $1,075-$1,175/oz. down to roughly $950-$1,050/oz. while increasing gold production, making Detour it a high-margin, long-lived gold asset in this price environment. Detour currently has a mine life of roughly 22yrs with average annual gold production of 625-650k oz. p.a. (based on 15-16m oz. of reserves) based on the most recently updated LOM plan. Detour has an additional 534k oz. (underground at Zone 58N) of M&I resources and an additional 4.8m oz. (open-pit) of M&I. Further, there is an additional 1.137m oz. Inferred. Excluding additional exploration upside, Kirkland could increase the mine life of Detour through conversion of M&I and Inferred resources, such that the mine life is somewhere between 25-30yrs. However, Kirkland will look to expand production, which will increase the NPV and reduce the mine life. More recently, Kirkland has come out with some very exciting news flow regarding exploration at Detour Lake, both for the open-pit and potential underground.
Kirkland Lake should be given the benefit of the doubt as its wowed the market following the Newmarket acquisition after the stock price was initially punished on the news. It grew production and reserves (and grade) at Fosterville from 140-150k oz. p.a. @ AISC of $850/oz. +/- to what it is now production of roughly 550-600k oz. p.a. with AISC of $275-$375/oz., a true free cash flow machine.
Given when Detour Gold was acquired in the cycle, it should prove immensely accretive, especially if Kirkland Lake can capitalize on its objectives of increasing output to 740-800k oz. p.a. +/- at AISC of $950-$1,000 +/- $40/oz. and as gold prices move closer to an eventually surpass $2k/oz. If this can be achieved, it should once again obtain a premium valuation as it did previously to the announcement, such that it trades with a higher NAV multiple. It is worth noting that it is still trading with a reasonable premium, just not that which it has traded with over the past couple of years.
Kirkland Lake has other assets, both in production and development. Its Holt complex is comprised of four primary mines, with three producing operation (Taylor, Hislop, Holt, and Holloway), feeding a central mill. This came to be through the acquisition of St. Andrew Goldfields in January 2016. Kirkland, following the Newmarket deal, then the Detour acquisition categorizes these as non-core assets, so it is likely this complex will be sold within the next 12-18 months. It is worth noting that with moderate capital investment, production would be upwards of 150-160k oz. +/- 50k p.a. At such production levels are just having that capability to reach those levels should fetch Kirkland a pretty penny. However, if the gold price continues to appreciate and does so sooner rather than later, it is possible Kirkland ultimately decides to keep these assets.
Kirkland Lake has other assets included in the Newmarket acquisition (Stawell, Cosmo/Union Reefs) and the former has since been divested. Cosmo/Union Reefs (Northern Territory assets) are currently placed on care and maintenance and the company discontinued all test mining and milling in Northern Territory. In other words, these too are considered non-core and are also likely to be divested should the right opportunity present itself. This could very well change as in December 2019, the company reported some very nice, high-grade intersects which could support a potential resumption of operations, especially if gold prices continue to rise.
5.9m @ 17.9 g/t Au [Lantern Deposit]
2.8m @ 67.6 g/t Au [Lantern Deposit]
6.9m @ 13.7 g/t Au [Lantern Deposit]
1.4m @ 26.3 g/t Au [Lantern Deposit]
Drilling down plunge below the 550m level at Lantern:
6.2m @ 8.8 g/t Au
2m @ 28 g/t Au
1.4m @ 21.5 g/t Au
Drilling at Union Reefs:
1.4m @ 53.4 g/t Au
1.4m @ 26.3 g/t Au
2.9m @ 7 g/t Au
Drilling at Gandys Deposit at Pine Creek:
2.8m @ 16.1 g/t Au
3.3m @ 9.7 g/t Au
3.2m @ 9.1 g/t Au
7.6m @ 5.4 g/t Au
Ore from Lantern, Union Reefs and Pine Creek would feed a 6,500tpd mill, which could contribute material annual production. It remains to be seen if Kirkland does follow through with divesting the Holt Complex as well Union Reefs/Cosmo in the Northern Territory. If Kirkland decided to keep both complexes, it would allow the company to increase production pushing 1.75-2m oz. Au by 2023/2024. If it should go ahead and divest these assets, it should be able to get at least $150m in cash, and likely closer to $250m (and of course is dependent what the prevailing gold price is at such time).
In addition to on-going and growing cash flow generation and its $531m of net cash on hand (plus investments in several companies as of end of Q1) as Kirkland Lake bought a considerable quantity of shares back. It has repurchased a total of 9.70mm shares in Q1 2020 for $330m, which explains why its net cash position decreased relative to year end 2020 ($707m). Relative to its size, it has a tight capital structure with 277.2m shares outstanding. This should continue to contract as the company announced it has restarted its stock buy-back program (which it paused amid the CV19 pandemic). On June 4th, 2020, Kirkland Lake renewed its NCIB, which allows the company to purchase up to 27.71m shares, which is equivalent to 10% of the current common shares in the public float. Should the stock see any material pullbacks, if only for a day or week(s), the company can purchase 425.23k common shares per day on the open-market. In addition to having a material net cash position, its investment portfolio as of year-end 2019 was over $250m and is approximately worth $210m today, with its largest positions being Novo and Wallbridge. These investments could be to get a foot in the door of a future potential acquisition as all investments are in companies in Canada or Australia).
The company has also been hiking its dividend, having increased its dividend six times since mid-2017 and recently doubled its quarterly dividend to $0.125/share. Because Kirkland Lake is debt free, again a very rare thing for a senior producer, it only really has two choices in terms of what to do with what is significant excess cash generation [beginning in Q3, which is also well above and beyond the capital investment to optimize Detour Lake and complete the Macassa #4 shaft expansion], which is either identify and acquire a 4thcornerstone asset [producing or advanced exploration/development stage asset or company] or begin to return significant cash back to shareholders through buybacks or a significantly higher dividend.
Assets:
Macassa (Producing & Undergoing Expansion: Ontario, CA):Kirklands founding core asset is the Kirkland Lake complex, which hosts the producing high-grade Macassa mine and mill. The company has been successful in continuing to increase production over the past 5-yrs, which will continue through at least 2023-2024. With the discovery of the South Mine Complex (SMC), grades have continued to improve at depth (which can also been seen through the increased reserve grade, which is currently 22.1 g/t Au and among the worlds highest-grade gold mines) and has been increasing the assets reserve and resource base net of depletion, with substantial exploration upside remaining. The mill has 2.2ktpd capacity but is currently operating with significant excess capacity (operating at roughly 880-950ktpd in 2019). The company has undertaken the #4 shaft expansion project, which will allow more material to feed the mill and increase annual production, which is expected to greatly increase throughput [1.65ktpd-1.75ktpd assuming a head grade of 21.6 g/t Au], and in turn an increase in production in excess of 400k oz. annually at lower costs. Macassa initially reached production in 1933. In 2019, Macassa produced roughly 240k oz. Q1 2020 was a bit weaker at Macassa as it produced roughly 50k oz. Au and Q2 will of course be similar to lower which didnt suspend operations but did operate at reduced levels. On May 6th, 2020, the company announced it was beginning to recall employees who were off as part of CV19 protocols.
Construction of the shaft will be completed in two phases. The first will be to a depth of 5,450 feet and include a mid-shaft loading pocket. Completion of phase one is targeted for the second quarter of 2022 at a capital cost estimated at $240 million (approximately $40 million of expenditures planned in 2020). Phase two of the project will be undertaken following the commencement of production from phase one, and will involve extending the shaft to an ultimate depth of approximately 7,000 feet. Completion of phase two is targeted for the end of 2023 at an estimated capital cost of approximately $80 million. There will remain additional excess capacity at the Macassa Mill. 2023 will see significantly higher production of 320-340k oz. Au, and 2024 will mark its first full year of operations following the expansion.
Aside from the other properties in the Kirkland Lake land package, which are next to Macassa [Kirkland Minerals, Tech-Hughes, Lakeshore, Wright Hargreaves], there remains significant exploration potential at Macassa, which only seems to get better and better as exploration continues. The key areas of focus have been the SMC and the Main Break over recent years. In Mid-April, the company identified a new large corridor of high-grade mineralization along Main Break East of Macassa. Drilling through east portion of the Main Break at Macassa intersected high-grade mineralization close to the #4 shaft being developed and planned exploration drift off 5700 level. The key intercept was 2.4m @ 141.3 g/t Au. The companys identification of the 700m x 300m high corridor of high-grade mineralization remains open along strike and to depth. Drilling at SMC East intersected high-grade mineralization up to 75m outside of current resource, highlights potential for continued growth of SMC. The key intercepts from this include: 2.1m @ 43.1 g/t Au, 2.3m @ 31 g/t, 2.1m @ 16.4 g/t, and 4.2m @ 19.3 g/t. The SMC continues to be expanded, something which can be expected to continue. Macassa should be able to maintain elevated production (>=400k oz. Au) for many years to come, post-2023.
Longer-term, given the high-grade nature of the Kirkland camp, its other properties such as Kirkland Minerals [which has historically produced 1.173m oz. Au at an average grade of 11.50 g/t Au between 1919 and 1960] should see exploration in the longer-term. The Tech-Hughes mine which is bordered by Kirkland Minerals and the Lake Shore mine has produced an aggregate of 3.69m oz. at an average grade of 11.82 g/t Au. The Lake Shore mine, located at the center of the Kirkland Lake Camp is situated between the Tech-Hughes Mine and the Wright Hargreaves Mine. Lake shore was considered the crown jewel of the Kirkland Lake Camp as it was the largest producer, producing 8.5m oz. Au at an average grade of 15.86 g/t Au. Lastly the Wright-Hargreaves Mine ranks second in terms of historical gold production and grade, having produced 4.82m oz. Au and an average grade of 15.24 g/t. High-grade gold mineralization is still present at Wright Hargreaves and Lake Shore at the 8100 level.
Before moving on to the other two cornerstone assets, it is worth noting that as Kirkland continues to optimize Macassa operations or sources additional material from adjacent properties or elsewhere at Macassa i.e. near-surface, it could add incremental production by filling excess mill capacity. Today, with the operation producing 240k oz. Au (though will be closer to 210-220k oz. Au due operating at a reduced level for part of the year due to CV19 safety protocol measures) at an average grade of 21.5 g/t Au, it is achievable will the mill operating well below nameplate capacity. As you can see, if the #4 shaft increases mill throughput, the 400k oz. Au level +/- 20k oz. is achievable at 1,700-1,800tpd. 21.5 g/t is right around the current reserve grade (>23 g/t in 2019 and current reserve grade of 22.1 g/t). However, if exploration success continues at the lower levels (grades have increased at depth), it should be able to maintain this head grade. Should the head grade fall to say 17.5 g/t, Kirkland can make up for any potential shortfall by increasing mining rates so the mill is processing 2-2.2ktpd.
Macassa Mill Production Potential
TPD
Au g/t
Recoveries
Production
800
21.5
97.50%
191,405
900
21.5
97.50%
215,330
1000
21.5
97.50%
239,256
1100
21.5
97.50%
263,181
1200
21.5
97.50%
287,107
1400
21.5
97.50%
334,958
1600
21.5
97.50%
382,809
1800
21.5
97.50%
430,660
2000
21.5
97.50%
478,512
2200
21.5
97.50%
526,363
Should head grades decline below the current reserve grade well into the future, Kirkland can maintain steady state 400k oz. Au output by feeding the mill incremental ore feed. If head grades fall further [below 17.5 g/t], it will still be able to maintain high levels of production.
Macassa Mill Production Potential
TPD
Au g/t
Recoveries
Production
800
17.5
97.50%
155,794
900
17.5
97.50%
175,269
1000
17.5
97.50%
194,743
1100
17.5
97.50%
214,217
1200
17.5
97.50%
233,692
1400
17.5
97.50%
272,640
1600
17.5
97.50%
311,589
1800
17.5
97.50%
350,538
2000
17.5
97.50%
389,486
2200
17.5
97.50%
428,435
Fosterville;What has become a cornerstone asset for the company and its biggest contributor of free cash flow saw what was essentially three consecutive years of reserves increases, and more importantly a vast increase in reserve grade, transformed the asset into what it is now, a >500-600k oz. producer (at least through 2023 +/-) with a cost structure in the lowest decile on the industry cost curve. Prior to be acquired, Fosterville had seen moderate year over year production growth to 140-160k oz. p.a. When Kirkland started to engage in aggressive exploration, it was able to greatly expand mineral reserves because of the down-plunge extensions of the high-grade, visible gold-bearing Lower Phoenix gold system. In particular, the footwall, now referred to as the Swan Zone added 532k oz. Au @ an average grade of a staggering 58.8 g/t Au.
Continued exploration success expanding the Swan Zone continued to grow mineral reserves and led to another significant increase in high-grade reserves. The Fosterville Mill has capacity of 2.275ktpd. If we look at 2019 production:
619k oz. Au
Ore processed (tons): 492,874 [1,380-1,400tpd or 61% +/- of capacity]
Gold grade: 39.6 g/t Au
Recovery Rate: 98.8%
In other words, if we assume the mine operated 350 days out of the year, daily throughput averages 1.380k-1.400ktpd. This is a great thing as in 2019, Kirkland Lake discovered a potential future 2ndmining front (Robins Hill), which over the next couple of years [expected in 2023] can be developed and fill at least some of the excess 800-850tpd +/-. The company currently envisions further exploration and development by 2023 or so, which is part of the reason our projected production in 2023 will be 525k oz.
It is very unlikely Fosterville will be able to maintain production between 500-600k oz. p.a. beyond 2023/2024, if not 2025 but a second mining front could make up some of the lost production. This should allow Kirkland Lake to maintain production between 350-450k oz. or if the high-grade Lower Phoenix and Swan Zone can continue to expand high-grade mineralization, Robins hill could actually augment production, only time will tell. For the time being, we will assume 2021-2023 production of 575k oz, 575k oz., and 525k oz. Also, given the exploration upside, we will assume a mine life of 7.5yrs. In other words, we are assuming no additional discoveries are even half the grade of the Swan zone.
At this point in time, it is extremely variable as we dont know yet know what the grade will be of additional reserves. There is vast exploration upside so increases the reserve base is unlikely to be a problem in the near-term but over time [whether it be 3yrs or 5yrs], grades could fall be considerably lower impacting production but be partially negated by production from Robins Hill. as well as result in higher costs, albeit still low-cost.
Alternatively, there could me another, perhaps multiple Swan Zones or other higher-grade areas [i.e. 20-25 g/t Au] like areas on the property, propelling annual production above 450-500k oz. Au over the next 5 or more years. In Early December, Kirkland extended high-grade, visible gold mineralization down-plunge of the Swan Zone. Key intercepts include: 5.5m @ 87.6 g/t Au, 4.7m @ 45 g/t Au, and 4.7m @ 59.1 g/t Au. The drilling conforms continuity of the Lower Phoenix gold system over 950m down-plunge of Swan Zone, representing a large target area for future exploration drilling. Highlights include: 4.5m @ 14.8 g/t Au and 13.8m @ 6.2 g/t Au. The company also engaged in expansion drilling into Cygnet Zone, which returned high-grade, visible-gold bearing intersections, and strike continuity of mineralization over 650m. Key intercepts included: 0.9m @ 239 g/t Au, 1.5m @ 28.4 g/t, 4.5m @ 11.2 g/t, and 29m @ 4.8 g/t Au. Drilling at Harrier South remains at an early stage given the time required to extend the existing exploration drift and poor ground conditions encountered in some areas. Having already intersected quartz veins with visible gold similar in texture to those found in the Swan Zone is promising. The bonanza grade at Swan has not yet been seen at Harrier South but it is early days. It will remain a high-priority target with extensive drilling throughout 2020.
It is anticipated mineral reserves will be extended down-plunge of the Swan reserves with some intercepts noted above. Intercepts through the Swan footwall splay returned some excellent high-grade intercepts. The Swan footwall splay fault originates from and branches off the Swan Fault. Key intercepts include: 2.6m @ 1,083 g/t Au, 4.4m @ 40.8 g/t Au, 2m @ 52.4 g/t, and 3.5m @ 38 g/t Au.
Drilling at Robins Hill confirmed continuity of high-grade mineralization to depth. Key intercepts include 3.4m @ 24.5 g/t Au, 7.2m @ 11.7 g/t Au, 10.1m @ 11.3 g/t Au, 9.2m @ 10.5 g/t Au. That being said combined with near-mine exploration could easily increase the reserve grade at Robins Hill.
Drilling outside Robins Hill illustrates potential to extend resource an additional 500m down-plunge. Key intercepts include: 4.5m @ 10.4 g/t and 4.8m @ 9.5 g/t Au. Robins hill is being considered another Fosterville at Fosterville, with potentially more of these identified with additional exploration on the land package. Robins Hill remains open at depth and along strike, and it is believed it will support substantial resources.
Total Fosterville Resource estimate:
Category
Tons
Au g/t
Gold oz. [Koz.]
Proven/Probable
3,000
21.8
2,100
2P (Robins Hill)
1,240
5.5
218
M&I Fosterville
12,300
5.3
2,080
M&I Robins Hill
3,460
3.5
386
Inferred Fosterville
8,450
6.4
1,740
Inferred (Robins Hill)
2,670
4.5
383
Total Resources
31,120
6,907
Resources Estimate from the Swan Zone:
Category
Tons
Au g/t
Gold oz. [Koz.]
Proven/Probable
1,260
38.6
1,560
M&I (Exclusive)
89
27.7
79
Inferred
93
19.3
57
Detour Lake:Kirkland announced the acquisition of Detour Lake in November 2019 in an all-stock transaction with an implied equity value of C$4.9b (US$3.60b), with ownership of existing KL shareholders at 73% and 27% for Detour Gold shareholders. Detour Lake has been a rather troubled asset over recent years due to high and rising costs for three years (AISC in 2016-2019 of $1,007/oz., $1,064/oz., $1,158/oz. and $1,162/oz.). It wouldnt have been nearly as troubled if not for a low gold price, which traded between $1,100-$1,350/oz. from 2016-1H 2019. Kirkland Lake believes that it will be able to optimize operations which include lower costs and higher output. It believes it will be able to reduce 100mt of waste through 2022 thereby reducing costs. Kirkland is also applying to increase throughput from 75ktpd to 90ktpd, which could be expanded further in the near future.
In 2021, Kirkland will look to increase mining and processing rates closer to 90ktpa, which should lower AISC, at least marginally which should begin to show-up in operating results in the 2H 2021. Detour was also in the process of re-negotiating some contracts, which would also serve to put downward pressure on costs. Reducing waste in the near-term would do the same. Kirklands key objectives when it acquired Detour Lake was to increase output and reduce costs. There are plenty of opportunities to do, some of which have already mentioned. When it comes to production, increasing production would also serve to lower costs, at least marginally. Kirkland should focus on expanding what is looking to be like a lucrative underground component. The 58N zone, while relatively small at 660k oz. of total resources has an average grade of roughly 5.5 g/t. If this can be expanded to 1-2m oz. Au over time and incorporated into the mine plan, it will most likely mean AISC could drop toward or below the $1k/oz. level, when combined with other optimization measures.
Kirkland also expects to realize synergies of $75-$100m/yr. from this deal. The Detour land package add to the exploration upside and potential for new discoveries, which may be higher-grade. This could potentially also set-up for additional acquisitions such as Wallbridge Mining (which Kirkland Lake already has a position in) as it controls a district scale land position along the Detour-Fenelon gold trend. It should also be noted, Kirklands ability to integrate and optimize Detour Lake shouldnt be judged based on performance in 2020, rather 2021, notably the back half of the year. Kirkland recently released some initial impressive drill results at Detour illustrating potentially higher open-pit grades as well as continued exploration success at depth for a future underground component:
Saddle Zone [identified broad zones of mineralization at attractive open-pit grades with higher-grade intervals at depth]:
121m @ 1.41 g/t Au including 3.5m @ 16.33 g/t Au
138m @ 1.23 g/t Au including 24m @ 4.11 g/t Au
65m @ 1.25 g/t Au
37m @ 1.77 g/t Au including 3m @ 14.73 g/t Au
58N Zone: intersects high grades 175m west of current underground mineral resources:
5m @ 14.6 g/t Au
13m @ 11.7 g/t Au
8m @ 5.9 g/t Au
3m @ 8.6 g/t Au
Drilling at North Pit extends mineralization to depth and along strike of current mineral resource:
9m @ 1.1 g/t Au
5m @ 1.76 g/t Au
4m @ 1.8 g/t Au
3m @ 1.82 g/t Au
Kirkland also see many areas to unlock value through optimizing the mine plan and exploiting areas such as the Saddle zone which has the potential for a lower strip ratio or Zone 58N, which is a higher-grade satellite pit with underground potential.
Category
Tons
Grade g/t
Au oz.
2P Reserves
477,450
0.97
14.85m
M&I [Zone 58N]
2,900
5.8
534k
M&I Detour Pit
134,700
1.1
4.8m
Inferred [Zone 58N]
1,000
4.4
136k
Inferred Detour Pit
42,900
0.82
1.14m
Total
658,950
21.46m
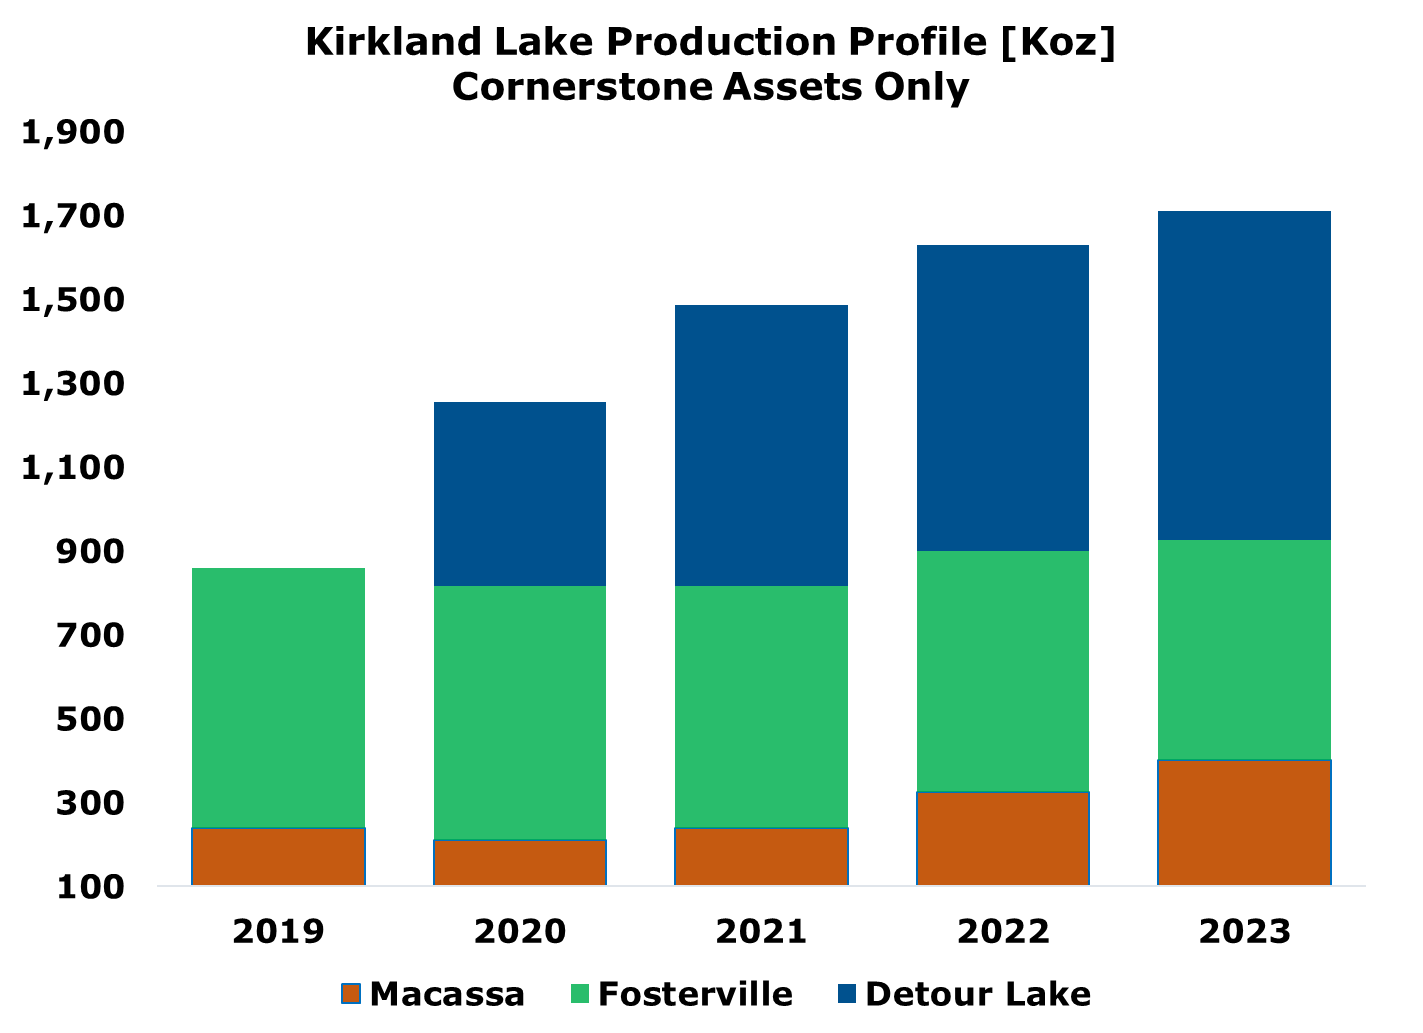
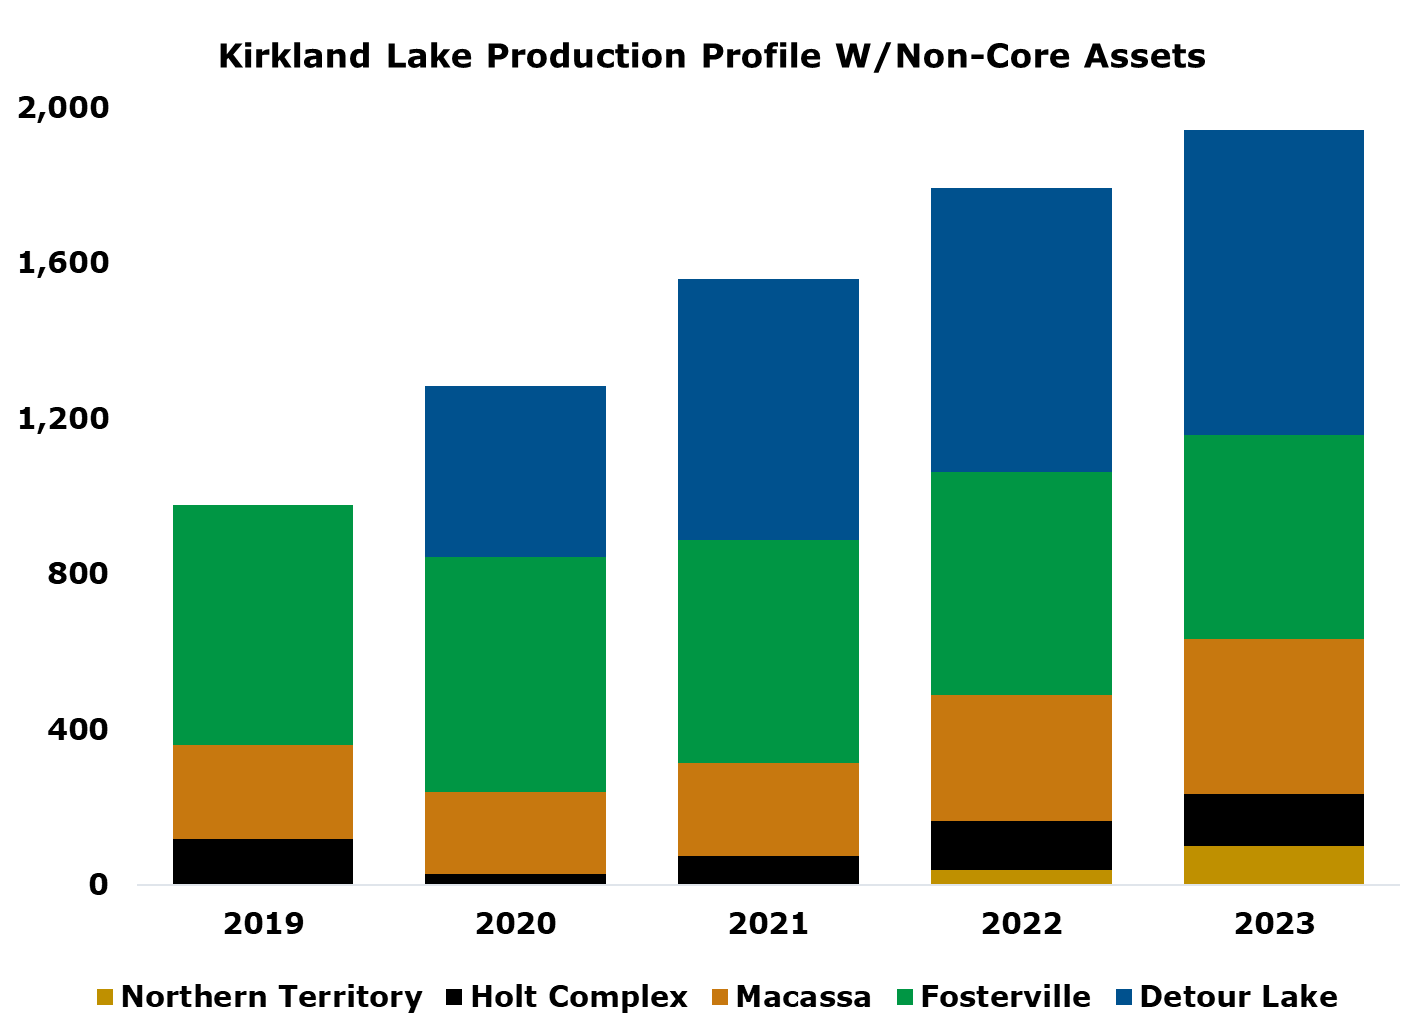
Because of the exploration results in the Northern Territory i.e. Lantern Deposit and the production potential of the Holt Complex, and the ability to increase output in excess of 150k oz. p.a., the following two graphic depict Kirklands production profile from its cornerstone assets as well as its other assets which it has said it will look to divest. It is worth taking a look because since that declaration, the gold price has appreciated by a significant degree, which could make Kirkland change its mind. This may be a similar situation to that of Pan-American, when it acquired Tahoe Resources and designated the Timmins gold mine as held-for-sale, only for that designation to be removed as a result of materially higher gold prices and lower than projected costs.
One of the following projections [2ndchart] is inclusive of what are now non-operating assets, it is assumed production from the Northern Territory would commence in 2022 at 40k oz. and 90k oz. in 2023, while the Holt Complex would resume operations in 2021 at 75k oz., increasing to 125k oz. in 2022 and 135k oz. in 2023. Both projections also assume Detour Lake is expanded to 90ktpa and operates on average 82.50ktpd, 350 days a year with 90% recoveries and begins mining the reserve grade [0.97 g/t Au]. Under this scenario, Detour would produce roughly 750-800k oz. Au of annually. Production in 2020-2023 is estimated at 440k oz. in 2020, 670k oz. in 2021, 730k oz. in 2022, and 785k oz. in 2023.
Including Kirklands non-core asset base, both of which have a material resource base and significant exploration upside, this could push Kirkland towards becoming a 2m oz. senior gold producer.
While this is the current production projection it is assumed Fosterville will see a marginal drop-down in production to 525k oz. Au in 2023, but that is also the time Robins Hill could begin adding supplemental mill feed to fill the excess capacity the same year. It is assumed Macassa will see a two-year increase in production beginning in 2022, as the first phase of the expansion will be complete, which will see 2022 and 2023 production of 320k oz. Au [per lower end of $KLs 3yr guidance] and 400k oz. Au. Given Kirkland Lakes financial position, it wouldnt be surprising to see the company acquire a 4thcornerstone asset, likely a development project or two, so this is subject to change.
Valuation:
Kirklands three cornerstone assets make-up the majority of its Net Asset Value, but it also has the Holt Complex [+Hislop] and Cosmo and Union Reefs, not to mention over $700m in net cash and investments. Kirkland is trading at a discount to its peer group, trading with a relatively low NAV multiple relative to its peer group, which NAV multiples between 1.40-1.75x.
Assumptions: Given the vast exploration upside potential at its key assets, we will use conservative albeit still relatively conservative assumptions. We will assume a 9.5yr mine life at Macassa life, 7.5yr mine life at Fosterville, and a 17yr mine life at Detour [due to at least one planned expansion to 90ktpd and operating at 82.5ktpd beginning in 2022/2023]. We will use a 6.0% discount rate across the board and total other expenses [i.e. leases and corporate not mine site G&A, greenfield exploration, etc.] of $175m. At Fosterville, production is forecast to be 525k oz. Au in 2023, falling to 450k oz., 375k oz., 300k oz., and 210k oz. in the following years. In other words, there is a lot of potential to increase those numbers with continued exploration success. At Detour Lake it is assumed Kirkland can execute on its cost reduction plans, down to AISC of $1,040/oz. beginning in 2022.
For Holt, until we know how much it will be sold for, assuming production remains flat i.e. similar to 2019 [even though mining operations have been suspended], the NPV of the Holt Complex and Hislop is estimated at $227m [inclusive of $35m of capital investment]and because its non-operating it will be reduced 40%. The Northern Territory assets have an estimated NAV of $140m but that too will be reduced by 40%.
Net Asset Value: $1,700/oz. Au @ 6.0%
Asset
NAV6%
NAVPS
1.50x NAV
Macassa
$1,922,499,923
$6.93
$10.40
Fosterville
$2,515,433,264
$9.07
$13.61
Detour Lake
$4,367,403,334
$15.75
$23.63
Holt Complex
$136,544,674
$0.49
$0.74
Northern Territory
$94,480,056
$0.34
$0.51
Cash+ Investments
$741,000,000
$2.67
$2.67
Debt
0
0
0
Other Expenses
($175,120,448)
($0.63)
($0.63)
Total/VPS
9,602,240,802
$34.63
50.93
Shares Out
277,244,914
NAV Sensitivity: Changes in Gold Price & Discount Rate
Gold Price
$34.63
5.0%
6.0%
7.0%
8.0%
$1,250
$18.61
$17.80
$17.05
$16.37
$1,400
$24.56
$23.41
$22.36
$21.40
$1,550
$30.51
$29.02
$27.67
$26.43
$1,700
$36.46
$34.63
$32.98
$31.47
$1,850
$42.40
$40.25
$38.29
$36.50
$2,000
$48.35
$45.86
$43.60
$41.54
$2,150
$54.30
$51.47
$48.91
$46.57
$2,300
$60.25
$57.09
$54.22
$51.61
$2,400
$64.21
$60.83
$57.76
$54.96
1.50x NAV Sensitivity: Changes in Gold Price & Discount Rate
Gold Price
$50.93
5.0%
6.0%
7.0%
8.0%
$1,250
$26.91
$25.67
$24.54
$23.51
$1,400
$35.83
$34.09
$32.51
$31.06
$1,550
$44.75
$42.51
$40.47
$38.61
$1,700
$53.67
$50.93
$48.44
$46.16
$1,850
$62.60
$59.35
$56.40
$53.71
$2,000
$71.52
$67.77
$64.37
$61.27
$2,150
$80.44
$76.19
$72.33
$68.82
$2,300
$89.36
$84.61
$80.29
$76.37
$2,400
$95.31
$90.22
$85.60
$81.40
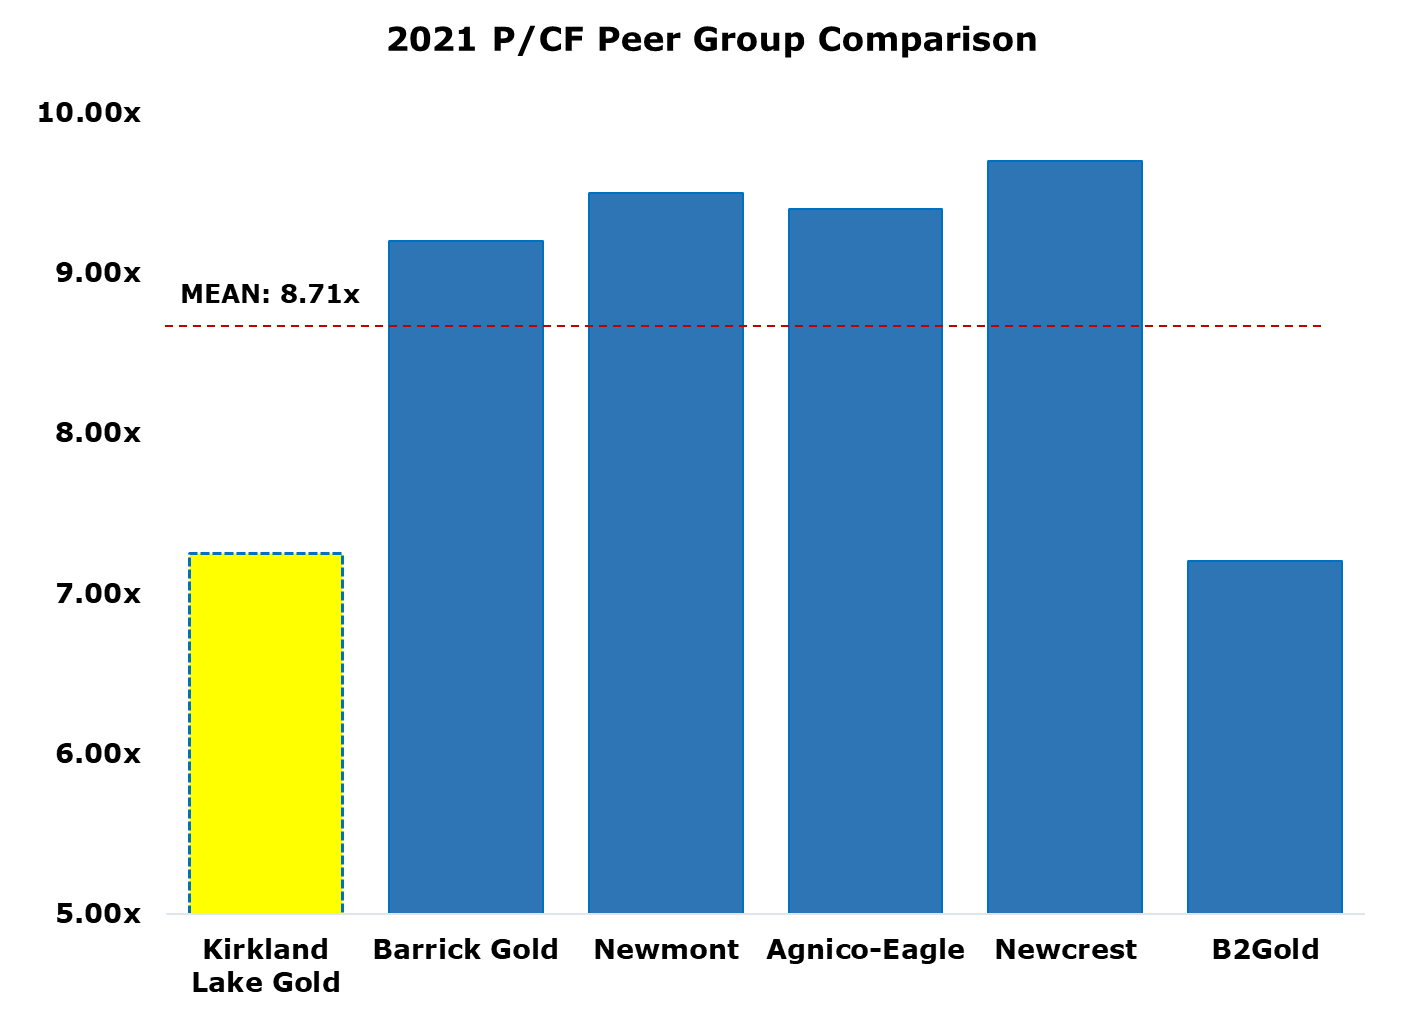
Kirkland Lake Gold presents a good value investment at current levels if you believe gold prices will remain at or above $1,600/oz. The company also has a strong history of value creation through M&A and through exploration. Looking at different valuation metrics, such as P/CF, also paints of picture of relative value.
Depending on your risk appetite, those who desire a conservative name or two amongst the royalty & streaming companies and senior gold producers, Kirkland presents a good value given its asset base, unrivaled balance sheet among its peer group, geopolitical risk, and valuation. If it werent for market punishing Kirklands stock price following the Detour Gold acquisition, it should be trading with a 1.50-1.75x NAV multiple and a 9-11x 2021 cash flow multiple, which provides a nice margin of safety at current prices [$39/share].
One could argue that such companies as Barrick Gold or Newmont Mining rightly deserve a higher P/CF multiple but Barrick for example, while it has a much more diversified asset base, it also has some large assets is risky jurisdictions such as the DRC while Kirkland Lake strictly has assets in Tier-1 mining jurisdictions. That aside, the best comparison would be Agnico-Eagle, which has the majority of its operations in Canada and has a 9.40x multiple relative to Kirklands 7.25x multiple in 2021. It is much more in-line with B2Golds, which is a good company but its asset base overall isnt of the quality such as that of Kirkland Lake and has operations is riskier jurisdictions.
The content on this site is protected
by U.S. and international copyright laws and is the property of GoldSeek.com
and/or the providers of the content under license. By "content" we mean any
information, mode of expression, or other materials and services found on GoldSeek.com.
This includes editorials, news, our writings, graphics, and any and all other
features found on the site. Please contact
us for any further information.
Live GoldSeek Visitor Map | Disclaimer
The views contained here may not represent the views of GoldSeek.com, Gold Seek LLC, its affiliates or advertisers. GoldSeek.com, Gold Seek LLC makes no representation, warranty or guarantee as to the accuracy
or completeness of the information (including news, editorials, prices, statistics,
analyses and the like) provided through its service. Any copying, reproduction
and/or redistribution of any of the documents, data, content or materials contained
on or within this website, without the express written consent of GoldSeek.com, Gold Seek LLC,
is strictly prohibited. In no event shall GoldSeek.com, Gold Seek LLC or its affiliates be
liable to any person for any decision made or action taken in reliance upon
the information provided herein.