Rick Ackerman, Rick's Picks 
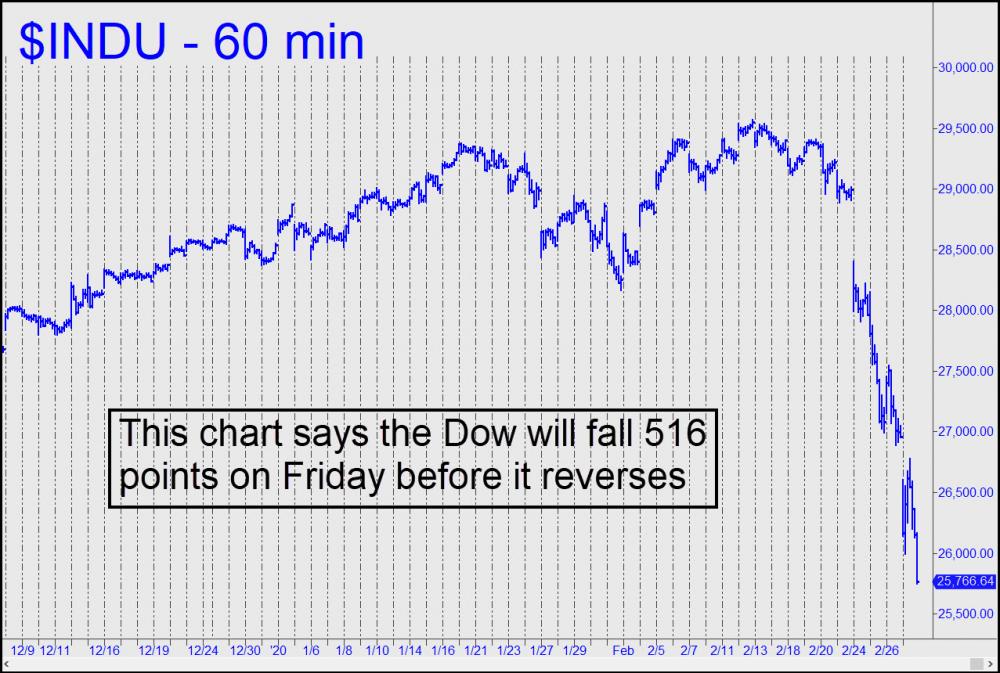
The stock market at its most violent this week has been an easy read, just as it was when the tech sector imploded 20 years ago and during the financial collapse of 2007-08. On the eve of today's memorable carnage the short-term charts practically glowed with warnings of the Dow's imminent, record-breaking plunge. I'd predicted as much in commentary sent out the night before, along with targets for the E-Mini S&Ps that caught the exact bottom of one of the best rallies of the year. Subscribers reported getting the profitable ride of their lives in both directions. In the Rick's Picks Trading Room, where actionable ideas are shared freely 24/7, a few of them said they'd had their best day ever. In some cases this involved getting aboard for the rally at the exact low of the first selling climax, in the morning, riding it to within an inch of the mid-day peak, and then surfing the subsequent avalanche into the close. This chart shows how a Coney Island kind of day looked to traders and technicians.
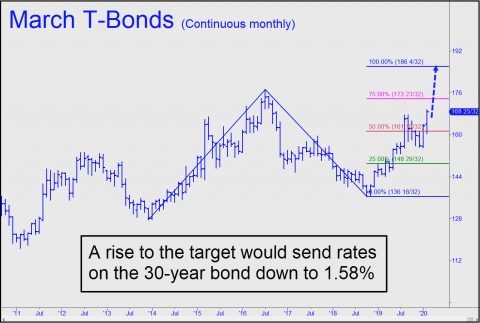
T-Bonds Saying 'Recession' Good technical analysis frees us from having to listen to all of the blather one hears these days about coronavirus and its potential effect on the global economy. To take one significant example, it's possible to predict with confidence that Treasury Bonds are headed much higher. Here's the chart -- 
-- showing a 186^04 target for T-Bond futures that would equates to a rate on the 30-yer of 1.58%. That would be quite a slide from the current rate of 1.78%, and it suggests that the recession threat that everyone will be debating in the months ahead is already baked in the cake. By all means, jot those numbers down and share them with financial advisor. If he goes all-in on Treasury paper, I predict that you'll both sleep better than investors who are in stocks up to their eyeballs. And if he knows anyone at Pimco, tell them too. They could use some help. Here's the chart -- not quite a sure thing, since nothing is, but still a very good bet. If you want the details, click here for a timely video I posted at Facebook and (YouTube) on the subject.
But what's going to happen tomorrow? I've often said that if you get AAPL right, you will get the stock market right. I am predicting a bottom at or very near 267.82 based on the gnarly pattern in this chart. If the stock bottoms there, so will the market's hellacious slide. Curse me if I'm wrong, but please do tell your friends if I am right. Rick Ackerman | 
