-- Published: Wednesday, 16 November 2016 | Print | Disqus
The real interest rate is one of gold’s true fundamentals, with a rising real interest rate exerting downward pressure on the gold price and a falling real interest rate exerting upward pressure on the gold price. However, it is important to keep in mind that the real interest rate is just one of several fundamental drivers of the gold price.
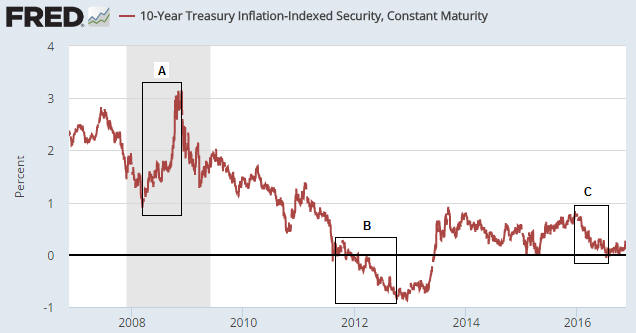
Due to the relationship between gold and the real interest rate, the gold price will often trend in the opposite direction to the 10-year TIPS yield. This is because the TIPS yield is a practical, albeit not theoretically correct, proxy for the real interest rate. For example, the sharp rise in the TIPS yield between March and November of 2008 (Period A on the following chart) coincided with a substantial downward correction in the gold price, and the multi-year decline in the TIPS yield from its November-2008 peak coincided with a powerful upward trend in the gold price.
Note, though, that the downward trend in the TIPS yield continued until September of 2012 whereas the gold price peaked in September of 2011. The period of divergence is labeled “B” on the following chart.
That the gold price stopped trending with the real interest rate for 12 months beginning in September of 2011 is related to the real interest rate being only one of several (six, to be specific) fundamental drivers of the gold price*. Other fundamental price drivers turned bearish during the second half of 2011 or the first half of 2012, thus counteracting the bullish influence of the declining real interest rate. That being said, substantial weakness in the gold price didn’t show up until after the real interest rate began to trend upward.
The real interest rate reached its post-2011 peak in December of 2015 — at around the same time that the Fed made its initial rate hike. The December-2015 downward reversal in the real interest rate marked the start of an intermediate-term rally in the gold price.
The most recent low in the real interest rate occurred in early-July (the end of Period C on the following chart) and coincided almost to the day with gold’s price top.

Prior to the Trump election victory there was no way of knowing whether the choppy sideways move in the real interest rate since early-July was a ‘pause for breath’ within a continuing downward trend or the start of a new upward trend. Prior to last week I therefore viewed this particular gold-market fundamental as neutral. It had stopped being a tailwind, but it hadn’t become a headwind.
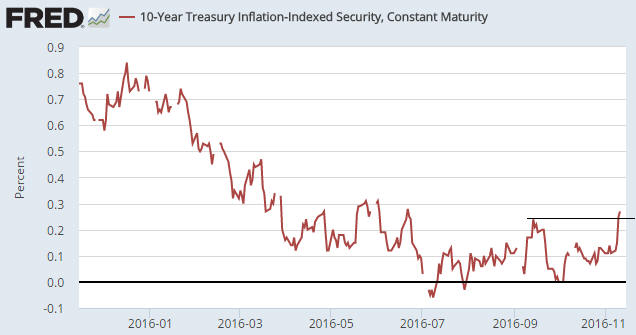
The next chart shows that one consequence of last week’s post-election volatility was an upside breakout by the 10-year TIPS yield from its 4-month range. This means that the ‘real interest rate’ has temporarily become a headwind for gold.

The TIPS yield is just one of six true fundamental drivers of the US$ gold price, but the post-election shift in this one indicator tipped (no pun intended) the overall fundamental balance from neutral to slightly-bearish for gold. This won’t prevent a multi-week rebound in the gold price, but the next major rally won’t begin until the fundamental backdrop has become more supportive.
*The other fundamental drivers of the gold price are the US yield curve (as indicated by the 10yr-2yr yield spread), credit spreads (as indicated by the IEF/HYG ratio), the relative strength of the banking sector (as indicated by the BKX/SPX ratio), the US dollar’s exchange rate and the overall trend for commodity prices.
| Digg This Article
-- Published: Wednesday, 16 November 2016 | E-Mail | Print | Source: GoldSeek.com

