-- Published: Monday, 16 January 2017 | Print | Disqus
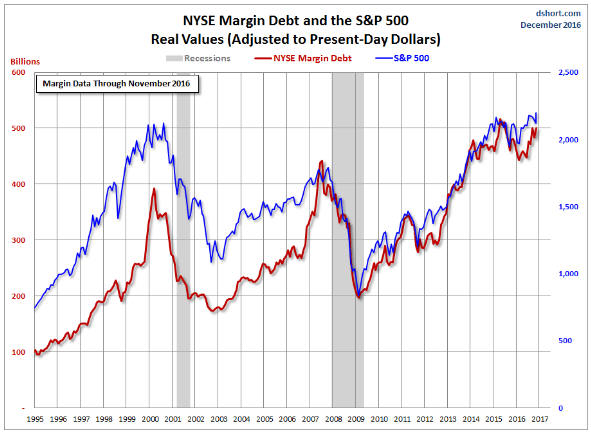
Until the S&P500 Index (SPX) broke out to the upside in early-July of 2016 we favoured the view that an equity bear market had begun in mid-2015. Supporting this view was the performance of NYSE Margin Debt, which had made what appeared to be a clear-cut downward reversal from an April-2015 peak.
As we’ve explained in the past, leverage is bullish for asset prices as long as it is increasing, regardless of how far into ‘nosebleed territory’ it happens to be. It’s only after market participants begin to scale back their collective leverage that asset prices come under substantial and sustained pressure. For example, it was a few months AFTER leverage (as indicated by the level of NYSE margin debt) stopped expanding and started to contract that major stock-market peaks occurred in 2000 and 2007. That’s why, during the second half of 2015 and the first few months of this year, we considered the pronounced downturn in NYSE Margin Debt from its April-2015 all-time high to be a warning of an equity bear market.
As at the end of November-2016 (the latest data) NYSE Margin Debt still hadn’t exceeded its April-2015 high, but the following chart from Doug Short shows that it is close to doing so. Furthermore, given the price action in December it is likely that NYSE Margin Debt has since made a new all-time high.

Even if it didn’t make a new high in December, the rise by NYSE Margin Debt to the vicinity of its April-2015 peak is evidence that leverage is still in a long-term upward trend and that the equity bull market is not yet complete.
More timely evidence that the US equity bull market is not yet complete is provided by indicators of market breadth, the most useful of which is the number of individual stocks making new 52-week highs.
The number of individual stocks making new highs on the NYSE and the NASDAQ peaked with the senior stock indices at multi-year highs during the first half of December. The number of individual-stock new highs has since fallen sharply, but this is normal and is not yet a significant bearish divergence.
The change over the past 6 weeks in the number of individual stocks making highs is consistent with the view that a sizable short-term decline is coming, but at the same time it suggests that neither a long-term top nor an intermediate-term top is in place. The reason is the strong tendency for the number of individual-stock new highs to diverge bearishly from the senior indices for at least a few months prior to an intermediate-term or a long-term top.
The US equity bull market may well continue, but that doesn’t mean it’s worth participating in. No investor should attempt to buy into all, or even into most, bull markets. In our opinion, it’s best to restrict participation to those bullish trends that are underpinned by relative value.
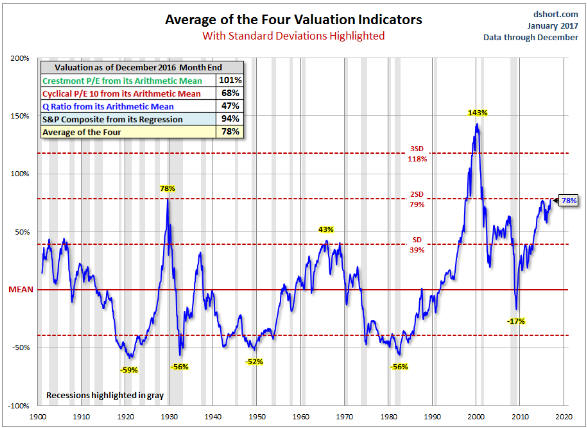
If the US equity bull market continues it will definitely not be because the market is underpinned by relative value. As illustrated by another chart from Doug Short (see below), based on an average of four valuation indicators the S&P500′s valuation today is the same as it was at the 1929 peak and second only to the 2000 peak.

The market has primarily been propelled by and to a certain extent remains underpinned by the combination of monetary inflation and artificially-low interest rates, that is, by the machinations of the Fed.
| Digg This Article
-- Published: Monday, 16 January 2017 | E-Mail | Print | Source: GoldSeek.com

