-- Published: Wednesday, 22 February 2017 | Print | Disqus
For an industrial commodity with a liquid futures market, the “term structure” of the futures market is the most useful — perhaps even the only useful — indicator of whether physical supply is tight, abundant or somewhere in between.
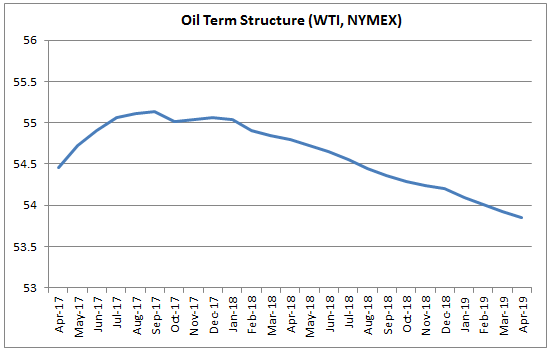
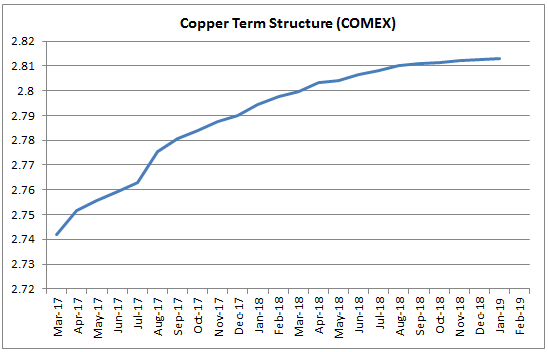
The term structure of a commodity futures market is the prices of futures contracts for the commodity over all available expiration months. It can be displayed as a chart, with price along the vertical axis and the expiration months along the horizontal axis. Here are examples for oil and copper.


If a market is in “contango” then the later the delivery month the higher the price, resulting in the chart of the term structure being an upward-sloping curve. If a market is in “backwardation” then the earlier delivery months will have the higher prices and the term structure will be represented by a downward-sloping curve. It is also possible for the curve representing the term structure to have an upward slope over some future delivery periods and a downward slope over others. This often happens with commodities that experience large seasonal swings in production (e.g. grains) or consumption (e.g. natural gas), but it can also happen with other commodities.
For an industrial commodity such as oil or copper it will be normal for the term-structure curve to slope upwards, that is, for the market to be in “contango”, with the extent of the “contango” reflecting the cost of physical-commodity storage. To further explain, let’s say you are a large-scale commercial consumer of oil and you estimate that you will need X barrels of the stuff in August of this year. In this case, if you don’t want to assume any price risk you can either take delivery of physical oil immediately and store it until August or buy oil for delivery in August (August-2017 oil futures). It will make sense to buy the physical oil if the cost of storage and financing is less than the premium over the spot (cash) price that you would have to pay for the August futures contracts. Otherwise, it will make sense to buy the futures and take delivery when the oil is needed in August.
It is, however, possible for a commodity such as oil to go into backwardation, that is, for the later delivery months to trade at a discount to the earlier delivery months and the spot price. Such a situation would create a risk-free profit for a commercial trader with excess oil on hand (“excess oil” being oil that will be needed by the trader in the future but isn’t needed immediately), because the trader could sell his excess physical supply on the spot market and lock-in his future supply needs by purchasing futures contracts at a discount to spot. In doing so he would not only pocket the difference between the spot and futures prices, he would also save on storage costs.
Due to the attractive arbitrage opportunity that would be presented by backwardation, it’s a situation that will usually arise only if there’s a shortage of currently-available physical supply. Backwardation, or a downward-sloping term-structure curve, is therefore a clear sign that the physical market is tight. By the same token, if the physical supply situation is genuinely tight then the market will either be in backwardation or the positive slope of the term-structure curve will be much gentler than usual.
Sometimes the term-structure curve will have a steeper upward slope than usual, that is, the later delivery months will trade at larger-than-usual price premiums to the earlier delivery months and the spot price. This will create an opportunity for traders to make risk-free profits by selling the futures and buying the physical, unless there is presently so much physical supply bidding for storage space that the price of storage is high enough to eliminate the potential arbitrage profit. Since risk-free arbitrage opportunities tend to be fleeting, a term-structure curve with a sustained steeper-than-usual upward slope indicates an abundance of currently-available physical supply.
Looking at the “term structure” charts displayed above, it is apparent that the fundamental backdrop is currently supportive for the oil price. This, by the way, constitutes a significant bullish change over the past 1-2 months. It is also apparent that the fundamental backdrop is neutral for the copper price, in that the “term structure” for the copper market has a fairly normal upward slope. The copper market appears to be adequately supplied at this time, although a more thorough analysis would take into account the LME term structure in addition to the COMEX term structure.
What about the reported inventory levels for commodities such as oil and the base metals? Is this information useful?
In general, no, because a lot of aboveground supply is not held in the storage facilities that are covered by such reports. There will be times when a relative shortage or abundance of physical supply is correctly signaled by the widely-reported inventory levels, but in such cases the evidence of shortage or abundance will also appear in the “term structure”. And the “term structure” will be more reliable, meaning that it will generate fewer false signals.
A final point worth making is that a bearish supply-demand situation doesn’t necessarily mean that the price will fall and a bullish supply-demand situation doesn’t necessarily mean that the price will rise. For example, in January-February last year I wrote that a strong rally in the oil price would probably soon begin even though oil’s supply-demand situation was as price-bearish as it ever gets. Part of my reasoning was that with the oil price having already dropped to near a 50-year low in real terms, the worst-case scenario had been factored into the current price. Also, after the fundamentals become as bearish (or bullish) as they ever get, what’s the most likely direction of the next move?
| Digg This Article
-- Published: Wednesday, 22 February 2017 | E-Mail | Print | Source: GoldSeek.com

