-- Published: Monday, 21 August 2017 | Print | Disqus
[This post is a slightly-modified excerpt from a recent TSI commentary]
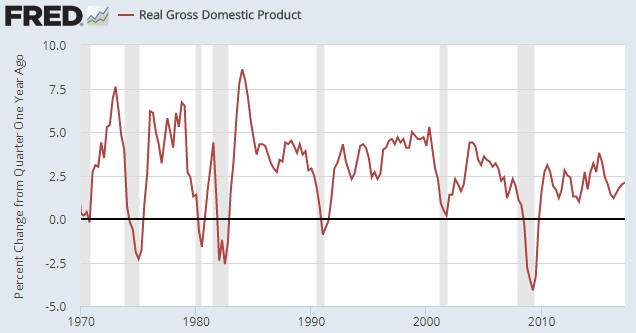
The US economic boom that followed the bust of 2007-2009 is still in progress. It has been longer than average, but at the same time it has been unusually weak. The weakness is even obvious in the governments own heavily-manipulated and positively-skewed data. For example, the following chart shows that during the current boom* the year-over-year growth rate of real GDP peaked at only 3.3% and has averaged only about 2.0%. Why has the latest boom been so weak and what does this say about the severity of the coming bust?
Before attempting to answer the above question its important to explain what is meant by the terms boom and bust.
An economy doesnt naturally oscillate between boom and bust. The oscillations are related to fractional reserve banking and these days are driven primarily by central banks. When I use the term boom in relation to an economy I am therefore not referring to a period of strong and sustainable economic progress, I am referring to a period during which monetary inflation and interest-rate suppression bring about an unsustainable surge in economic activity.
Booms are always followed by and effectively give birth to busts, with each bust wiping out a good portion (sometimes 100%) of the gain achieved during the preceding boom. Putting it another way, once a boom has been set in motion by the central bank a bust becomes an inevitable consequence. The only unknowns are the timing of the bust and how much of the boom-time gain will be erased.
Returning to the question asked in the opening paragraph, the main reason for the unusual weakness of the latest boom is the unprecedented aggressiveness of the central banks response to the 2007-2009 bust. In broad terms, this response came in two parts. First, there was the initial knee-jerk reaction during 2008-2009 that involved massive bailouts for banks and bondholders. In particular, by various means the Fed channeled many hundreds of billions of dollars into financial institutions to keep these institutions in business and ensure that their largest creditors remained whole. Because the Fed cannot create new wealth, this effectively involved a huge transfer of wealth from the rest of the economy to financial institutions and the associated bondholders. Second, the Fed continued to ramp up the money supply and keep its targeted interest rates near zero for several years after a recovery had begun, that is, the Feds crisis-fighting persisted for many years after the crisis was over. Ironically, this got in the way of the recovery.
A related point is that from a monetary perspective the biggest difference between the current boom and earlier booms is that a lot of the monetary fuel for the current boom was directly provided by the Fed, whereas almost all of the monetary fuel for earlier booms was loaned into existence by the commercial banks. When commercial banks lend money into existence the first receivers of the new money are individual and corporate customers of the banks, but when the Fed creates money via its QE programs the first receivers of the new money are Primary Dealers (PDs). The PDs invest the money in bonds, which means that the second receivers of the new money will be bond investors. These investors then use the money to buy other securities (bonds or stocks). The upshot is that when the Fed creates money the money gets shuffled around between the accounts of financial-market operators for an extended period, only leaking slowly into the real economy.
This explains why the economy has fared unusually poorly during the current boom while the stock and bond markets have fared unusually well. In effect, due to the way the new money was injected it had a much greater impact on financial asset prices than the real economy.
This could actually be a blessing in disguise. If the boom were to end within the coming 12 months, which it will if monetary conditions continue to tighten, then the ensuing recession may be far more severe in the financial markets (where the monetary inflation had its greatest impact) than in the real economy. In other words, the bust may look more like 2000-2002, when a short and mild economic recession was accompanied by a 50% decline in the stock market, than 2007-2009, when a devastating economic recession was accompanied by a similar decline in the stock market.
*The booms in the GDP growth chart included herewith are roughly equal the periods between the shaded areas, except that the official recessions (the shaded areas on the chart) typically didnt begin until 6-12 months after the preceding boom ended. For example, whereas the most recent official recession began in December-2007, the bust probably began in late-2006 when (mal) investments in sub-prime lending started blowing up.
| Digg This Article
-- Published: Monday, 21 August 2017 | E-Mail | Print | Source: GoldSeek.com


 The weakest boom ever