LIVE Gold Prices $  | E-Mail Subscriptions | Update GoldSeek | GoldSeek Radio 

Commentary : Gold Review : Markets : News Wire : Quotes : Silver : Stocks - Main Page 

 GoldSeek.com >> News >> Story  Disclaimer 
 
Latest Headlines

GoldSeek.com to Launch New Website
By: GoldSeek.com

Is Gold Price Action Warning Of Imminent Monetary Collapse Part 2?
By: Hubert Moolman

Gold and Silver Are Just Getting Started
By: Frank Holmes, US Funds

Silver Makes High Wave Candle at Target – Here’s What to Expect…
By: Clive Maund

Gold Blows Through Upside Resistance - The Chase Is On
By: Avi Gilburt

U.S. Mint To Reduce Gold & Silver Eagle Production Over The Next 12-18 Months
By: Steve St. Angelo, SRSrocco Report

Gold's sharp rise throws Financial Times into an erroneous sulk
By: Chris Powell, GATA

Precious Metals Update Video: Gold's unusual strength
By: Ira Epstein

Asian Metals Market Update: July-29-2020
By: Chintan Karnani, Insignia Consultants

Gold's rise is a 'mystery' because journalism always fails to pursue it
By: Chris Powell, GATA

 
Search

GoldSeek Web

 
The most useful leading indicator of the global boom-bust cycle


By: Steve Saville, The Speculative Investor

 -- Published: Friday, 1 September 2017 | Print  | Disqus 

The long-term economic oscillations between boom and bust are caused by changes in the money-supply growth rate. It can therefore make sense to monitor such changes, but doing so requires knowing how to calculate the money supply. Unfortunately, most of the popular monetary aggregates are not useful in this regard because they either include quantities that aren’t money or omit quantities that are money.

What “Austrian” economists refer to as TMS (True Money Supply) is the most accurate monetary aggregate. Whereas popular measures such as M2, M3 and MZM contain credit instruments, TMS only contains money. Specifically, TMS comprises currency (notes and coins), checkable deposits and savings deposits.

The following chart shows the year-over-year TMS growth rate (the monetary inflation rate) in the US. It has fallen sharply over the past 8 months — from around 11% to around 5% — and is now at its lowest level since 2008.

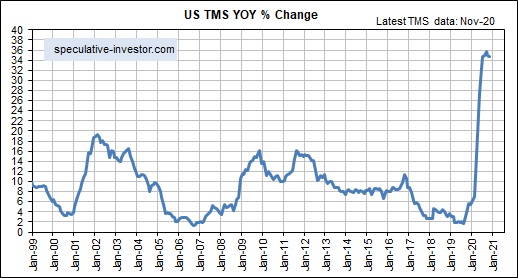
The chart displayed above suggests that the US economic boom* is on its last legs. It may well be, but the 2002-2006/7 boom continued for almost 2 years after the US monetary inflation rate fell to near its current level in early-2005.

The reason for the long delay during 2005-2007 between the decline in the US TMS growth rate to a level that ordinarily would have ended the boom in less than 12 months and the actual ending of the boom was the offsetting effect of rapid monetary inflation in the euro-zone. This prompted me to develop a monetary aggregate that I call “G2 TMS”, which combines the US and euro-zone money supplies. Here is a monthly chart showing the growth rate of G2 TMS.

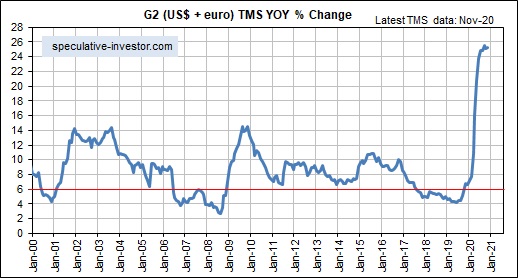
The rate of change in the G2 TMS growth rate has been the most useful leading indicator of the global boom-bust cycle over the past two decades. Of particular significance, a decline in the G2 TMS growth rate from well above 6% to below 6% warns of a shift from boom to bust within 12 months.

At the end of July the G2 TMS growth rate was slightly above the boom-bust transition level.

*An economic boom is defined as a multi-year period during which the creation of a lot of money out of nothing causes an unsustainable increase in economic activity.


| Digg This Article
 -- Published: Friday, 1 September 2017 | E-Mail  | Print  | Source: GoldSeek.com

comments powered by Disqus


Regular financial market forecasts and analyses are provided at our web site. We aren’t offering a free trial subscription at this time, but free samples of our work (excerpts from our regular commentaries) can be viewed here.

E-mail: Steve Saville


Increase Text SizeDecrease Text SizeE-mail Link of Current PagePrinter Friendly PageReturn to GoldSeek.com

 news.goldseek.com >> Story

E-mail Page  | Print  | Disclaimer 


© 1995 - 2019


GoldSeek.com Supports Kiva.org

© GoldSeek.com, Gold Seek LLC

The content on this site is protected by U.S. and international copyright laws and is the property of GoldSeek.com and/or the providers of the content under license. By "content" we mean any information, mode of expression, or other materials and services found on GoldSeek.com. This includes editorials, news, our writings, graphics, and any and all other features found on the site. Please contact us for any further information.

Live GoldSeek Visitor Map | Disclaimer


Map

The views contained here may not represent the views of GoldSeek.com, Gold Seek LLC, its affiliates or advertisers. GoldSeek.com, Gold Seek LLC makes no representation, warranty or guarantee as to the accuracy or completeness of the information (including news, editorials, prices, statistics, analyses and the like) provided through its service. Any copying, reproduction and/or redistribution of any of the documents, data, content or materials contained on or within this website, without the express written consent of GoldSeek.com, Gold Seek LLC, is strictly prohibited. In no event shall GoldSeek.com, Gold Seek LLC or its affiliates be liable to any person for any decision made or action taken in reliance upon the information provided herein.