-- Published: Sunday, 17 December 2017 | Print | Disqus
The central bank is not the root cause of the boom-bust cycle. The root cause is fractional reserve banking (the ability of banks to create money and credit out of nothing). The central banks effect on the cycle is to extend the booms, make the busts more severe and prevent the investment errors of the boom from being fully corrected prior to the start of the next cycle. Consequently, there are some important relationships between interest rates and the performance of the economy that would hold with or without a central bank, provided that the practice of fractional reserve banking was widespread. One of these relationships is the link between a reversal in the yield curve from flattening to steepening and the start of an economic recession/depression.
Unfortunately, the data we have at our disposal doesnt go back anywhere near as far as wed like, where as far as wed like in this case means 150 years or more. For example, the data we have for the 10year-2year spread, which is our favourite indicator of the US yield curve, only goes back to the mid-1970s.
For a longer-term look at the performance of the US yield curve the best we can do on short notice is use the Feds data for the 10year-3month spread, which goes back to the early-1960s. However, going back to the early-1960s is good enough for government work and is still satisfactory for the private sector.
As explained in many previous commentaries, the boom phase of the cycle is characterised by borrowing short-term to lend/invest long-term in order to take advantage of the artificial abundance of cheap financing enabled by the creation of money and credit out of nothing. This puts upward pressure on short-term interest rates relative to long-term interest rates, meaning that it causes the yield curve to flatten.
At some point, usually after the boom has been in progress for several years, it becomes apparent that some of the investments that were incentivised by the money/credit inflation were ill-conceived. Losses start being realised, the quantity of loan defaults begins to rise, and the opportunities to profit from short-term leverage become scarcer. At this point everything still seems fine to casual observers, central bankers, the average economist and the vast majority of commentators on the financial markets, but the telltale sign that the cycle has begun the transition from boom to bust is a trend reversal in the yield curve. Short-term interest rates begin to fall relative to long-term interest rates, that is, the yield curve begins to steepen.
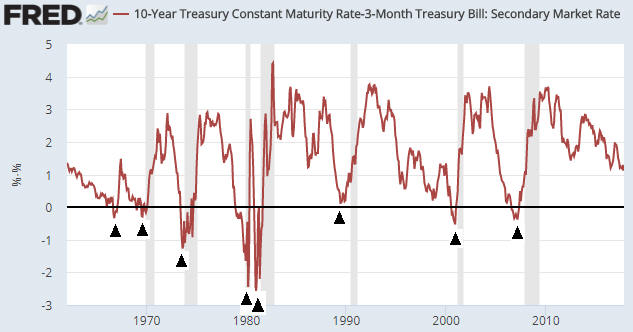
The following monthly chart of the 10year-3month spread illustrates the process described above. On this chart, the boom periods roughly coincide with the major downward trends (the yield-curve flattenings) and the bust periods roughly coincide with the major upward trends (the yield-curve steepenings). The shaded areas are the periods when the US economy was officially in recession.
The black arrows on the chart mark the major trend reversals from flattening to steepening. With two exceptions, such a reversal occurred shortly before the start of every recession.
The first exception occurred in the mid-1960s, when a reversal in the yield spread from a depressed level was not followed by a recession. It seems that something happened at that time to suddenly and temporarily elevate the 10year yield relative to the 3month yield.
The second exception was associated with the first part of the famous double-dip recession of 1980-1982. Thanks to the extreme interest-rate volatility of the period, the yield spread reversed from down to up shortly before the start of the recession in 1980, which is typical, but during the first month of the recession it plunged to a new low before making a sustained reversal.
Due to the downward pressure being maintained on short-term interest rates by the Fed, the yield curve reversal from flattening to steepening that signals an imminent end to the current boom probably will happen with the above-charted yield spread at an unusually high level. We cant know at what level or exactly when it will happen, but it hasnt happened yet.


 The Yield Curve And The Boom-Bust Cycle