|
-- Posted Friday, 9 June 2006 | Digg This Article
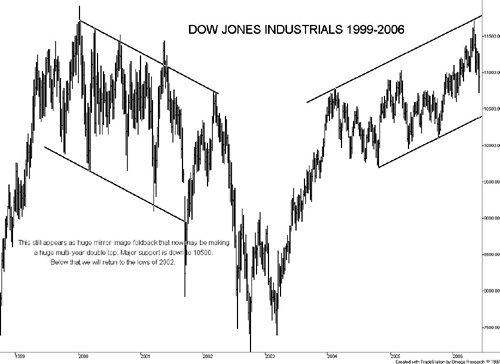
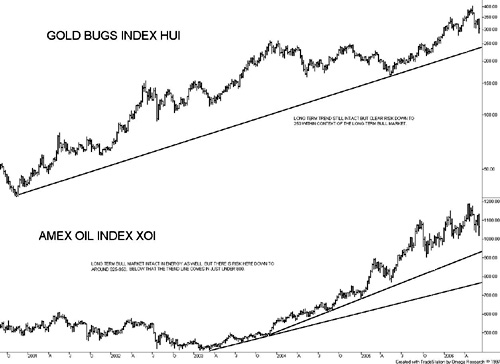
Investors may be in for a surprise when they open their May investment statements. For the first time in a while the markets had a down month. For the record, the Dow Jones Industrials (DJI) fell 1.7 percent, the S&P 500 3.0 percent, the NASDAQ 6.1 percent, the TSX Composite 3.8 percent, and the AMEX Oil Index (XOI) 2.7 percent. The worst performer was the Gold Bugs Index (HUI), down 12 percent. A number of the indices were down at important support zones and threatening to break through them, while the DJI also failed to take out highs seen in January 2000, leaving the potential for a massive multi-year double top. Shudder at the thought, as potential targets would be around 4,000. This all started with sharp drops in Middle Eastern markets: the Saudi Arabian stock market has fallen 33 percent so far this year (to May 31) while Kuwait has fallen over 50 percent. European and Asian markets also fell sharply in May with the Paris CAC down 5.0 percent, the Frankfurt DAX 5.3 percent, Hong Kong 5.0 percent and the high flying Tokyo Nikkei Dow down 7.7 percent. Emerging markets in particular have taken it on the chin. This is a global meltdown and not something exclusive to North America. The impact is being seen globally as well, with announcements over the past few weeks of some large hedge funds going under. Hedge funds and some were already struggling this year are particularly vulnerable because of their aggressive strategies and use of leverage. A number of them were already under investigation by the SEC on suspicion of insider trading and other nefarious activities. Hedge funds often account for half or more of daily trading activity in markets. In a down period, when all markets are being impacted, this activity is magnified and drives it even lower. And since hedge funds just have to sell, they are indifferent to which sectors are sold. It is across the board. The other area coming unravelled is the housing market. The collapse in US housing prices is now getting under way in earnest. An cover article in Barrons (The Big Glut Trouble in Paradise May 29, 2006) outlined how the second home market in particular is coming unglued with prices in some areas falling as much as 40 percent from original listing prices. Even mid-priced second homes are down at least 12-14 percent. Unit sales are down 40 percent or more and the list of unsold homes has shot up. Second homes now account for 40 per cent of the US market, said Barrons. Florida, Nevada and North Carolina have been particularly badly hit. A recent article in the Financial Times (US surge in unsold homes may herald cooling market June 7, 2006) noted that the number of unsold homes is up more than one million in the past year. The inventory of unsold homes now stands at four million. On the surface at least, housing starts and sales remain reasonably robust and therefore there does not seem to be any panic. But foreclosures, while remaining low on an historical basis, have been rising. Recent numbers indicate that foreclosures are running 30-40 percent above year-ago levels. Delinquencies are also rising, and all of this will feed on consumer confidence. All of this is bad news for the steady market of those borrowing against their home through home equity lines of credit. Over the past few years this has been a steady source of funds for retail sales. Given that US consumer spending accounts for over 70 percent of GDP, any pullback in this sector has serious consequences for the economy. Putting it bluntly, there are a lot of people living in mortgaged homes whose budgets are really stretched. Another factor has been the trend over the past few years to variable interest rate mortgages. It is estimated that over half the mortgages of the past few years were of this variety. As interest rates rise, so do the payments. Couple that with numerous households already spending their entire income to live on with declining house prices and you have a recipe for disaster. We might soon see a surge in walk-aways (where the balance owing on the mortgage exceeds the value of the house). Another problem area is the south coast that was hit hard by Katrina, Rita and Wilma in last years hurricane season. Many borrowers whose houses were either seriously damaged or just razed were given grace periods and now those grace periods are up. Numerous southern banks are facing the possibility of billions of dollars in write-offs as people are still not in a position to pay mortgages back, and many properties (especially in the New Orleans area) are all but worthless. With the growing turmoil in the housing market, homebuilders stocks have taken a beating over the past year. We still dont see a bottom in that sector. And the hurricane season is about to get underway once again amidst predictions that it could be as bad or almost as bad as last year. Some areas have still not recovered from hurricanes of two and three years ago, never mind 2005. While numerous economic numbers have not been favourable of late, there is still no sign that the economy may actually dip into recession. But the numbers are not encouraging and it may be only a matter of time. Co-incident and leading indicators have been weak or falling for months. Factory orders for April had their biggest drop in three months; non-farm payrolls for April came in at a paltry 75,000, well below the expected 170,000 (and the previous month was revised downward); and construction spending is slowing as the housing market slows. So what is the culprit? Simply, rising interest rates. At least that is the reason consistently trotted out by pundits as to why things are softening. (Not collapsing, note, but softening.) It is not just US interest rates that have been rising they have been rising globally. US market participants were floored recently when Fed Chairman Bernanke suggested that the Fed wont pause in its (to date) two-year run of interest rate increases. Bernanke, known as an inflation fighter, noted that recent measures of inflation are unwelcome. This raised the odds that the Fed will hike the rate to 5.25 percent at the June meeting. We have consistently said that the Fed will not be pausing at 5.0 percent and that the chances were good that we could see 6.0 percent before this cycle is finished. But it is not just the Fed that has been hiking interest rates, and therein lies a big part of the problem in the global meltdown. Falling global markets indicate that liquidity is being sucked out. The global equity rise over the past few years was fed by a combination of huge liquidity injections, not only from the US, but more importantly Japan. Here the global carry trades carried the day, supplying liquidity all over the world for speculators (dealers, hedge funds and even banks) to invest anywhere, from simple bond carry trades to emerging markets. That is now all coming unwound, and global liquidity with it. It seems that even a small upward adjustment in interest rates has started the removal of funds everywhere. The Bank of Japan has been draining the banking system, and with it the funds that have been used for global investment. The situation is the same in the European Union area, where interest rates have also been rising. And this is against a backdrop of growing global political, economic and social instability. The growing geopolitical instability has a number of causes: the continuing spat between Iran and the US over Irans nuclear ambitions (under the Nuclear Proliferation Treaty, Iran is within its rights to enrich uranium); the deteriorating situation in Iraq, where the revelation of a US slaughter of civilians in Haditha has put the US firmly on the defensive over why they are there; the deteriorating situation in Afghanistan, where the Taliban is making inroads against a small contingent of NATO troops and a growing perception of a corrupt government in Kabul surrounded by warlords (the Soviet Union had over 100,000 troops in Afghanistan and still left NATO has about 30,000); and, more recently, Islamic militants in Somalia pushing out US-backed warlords who were widely regarded as corrupt and terrorizing the population. On the US home front, Bushs popularity remains in the low 30s and wont be helped by the Haditha slaughter. Despite the still rosy outlook for the economy Bush is suffering there as well. Polls continue to show that Democrats may regain Congress in the November elections and possibly even the Senate as well. But the elections are five months away and anything can happen before then. Technical analyst Michael Jenkins reminds us that 40 years ago, another US president involved in a growing unpopular war and declining personal popularity also lost a mid-term election. That 1966 market topped in February then collapsed some 22 percent into October. The recent breakdown in the market has to be of concern to all participants. The key markets of the Dow Jones Industrials, S&P 500 and NASDAQ have broken important support levels. This tells us that unless the interest rate and liquidity situation turns around soon we are headed for lower levels even if we can sustain a rebound for a few weeks. With the S&P 500 breaking below the key 1260 level we are now looking at minimum targets of 1220. Below that level we are assured of a return of the bear market of 2000-2002. But of bigger concern to many investors is that the bull markets in gold, metals and energy stocks have also taken a beating over the past month. Despite gold prices remaining above $600, precious metals stocks have fallen to levels seen when gold was trading in the $550 area. Energy stocks have also fallen despite oil prices remaining around $70. Natural Gas prices remain depressed in the $6 area, down sharply from the highs above $15. But precious metals and energy stocks falling in tandem with the market is not unusual. An examination of the 1970s, a period that saw oil prices soar to $40 and gold spike to $850, shows that energy and gold stocks often followed the general market and not necessarily the commodity. 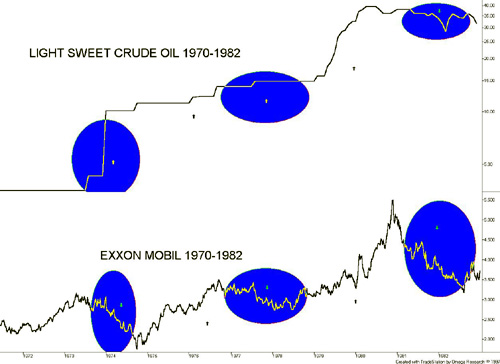
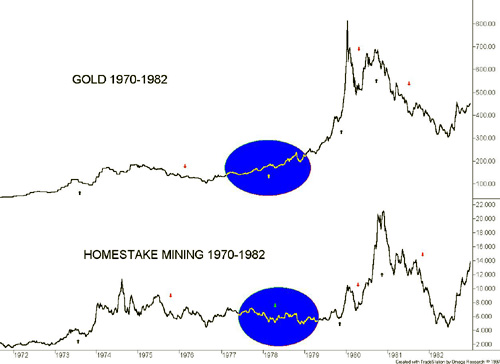
Our chart of Light Sweet Crude and Exxon Mobil shows that despite the sharply rising oil prices seen in 1973-75, Exxon collapsed with the market in 1973-74. And again Exxon was very weak throughout 1977-79 even as oil prices remained high due to the Arab oil crisis. Only as oil prices spiked to $40 with the Iranian hostage crisis did the two generally work in sync. Oil prices remained stable from 1975 to 1977 and Exxon Mobil enjoyed a sharp rise along with the rest of the market. We notice a somewhat similar phenomenon when we compare gold prices and the share price of Homestake Mining, a leading gold company during that period. Both rose during the market meltdown of 1973-74 and both fell as the rest of the market rallied in 1975-76. But during the period 1977-79, as gold prices were initially slowly rising and then spiking to $850, Homestake Mining remained very weak and only rallied feebly during the final spike run-up. It was not until after gold had its sharp correction in 1980 and tried to return to the former highs that Homestake Mining enjoyed a huge rally. They both collapsed in 1981-82 along with the rest of the market.
So there is no assurance that just because commodity prices (gold and oil) rise in price that the stocks will follow. They could follow the general market instead. Investors are advised to ensure that they are holding at least 10 percent bullion in their portfolios, and an increase to 15 percent should not be ruled out. Investors should carefully examine the various ways to invest in bullion as different investments can react differently in a bull market. Only the Millennium BullionFund, a mutual fund trust that invests in unencumbered fully allocated gold and silver and platinum, will trade at its Net Asset Value through all conditions. MBF is also insured and has clear custodial arrangements with the Bank of Nova Scotia. MBF can be found at www.bmsinc.ca. Other alternatives are primarily paper assets that may be impacted by the general market trading from anywhere to small discounts to substantial discounts, particularly in a down market. Precious Metals (gold, silver, platinum) and energy (oil and gas) are in multi year bull markets. Precious metals are recovering from two decades of inventory rundowns. While central banks in the western world have been major sellers of their gold reserves huge buying has come out of Asian central banks particularly China and Russia has increased its gold reserves to support the Rouble. On the supply side major producers such as South Africa are actually producing substantially less then a decade ago. It has also been slow to bring on new sources of production. Finally gold is attaining more monetary value and has been rising in value in all major currencies as instability grows. This is not going to change. Energy is facing potential shortages and soaring demand particularly from the Asian sub-continent of India and China. The major nations are in clear competition for the remaining sources of energy and it is currently driving much of the current growing global geopolitical situation. Russia is the worlds second largest producer of oil and also holds the worlds largest reserves of natural gas. Iran the worlds fourth largest oil producer is also has major reserves of natural gas. Iraq a former major producer that is but a shadow of its former self in terms of production is believed to hold vast untapped reserves of oil that may rival the Saudi oil fields that are now in decline. A potential major unknown is growing weather instability driven by global warming. Whether one wants to believe in global warming is beside the point as temperatures on average are up almost 3 degrees in the past decade, glaciers are receding, drought is growing in many parts of the world, hurricanes are becoming an annual growing hazard causing major property and crop damage depending on the part of the world, ice packs are breaking off in the polar regions threatening a rise in sea levels that will swamp low lying regions in both the developing and developed world and water tables are being impacted globally that will only increase global instability going forward. Global warming not only has implications for global stock markets but it has major implications for all life on earth. Investors are directed to a paper put out by Sprott Asset Management http://www.sprott.com/pdf/climate.pdf . The market right now may be slowly unravelling. Still, we are reminded of that 70-year cycle. In 1936, after an initial sharp 13 percent drop, the market recovered and rallied to new highs into March 1937. Somehow, though, we doubt that will come to pass this time. With the global draining of liquidity and rising interest rates, an imploding housing market and a deteriorating global geopolitical situation, odds are shaping up more for a crash rather than a huge rally. We dont mean a 1987 style crash but one that relentlessly falls as we saw in 2001 or 2002 or for that matter in 1966 and 1973-74. That suggests at least a 20-25 percent drop in the markets by October 2006. Whether the energy and precious metals go along with it remains to be seen. For precious metals we are encouraged by the reaction in the 1973-1974 bear market where they went firmly counter to the rest of the market. The precious metals markets have already seen a 20 percent plus drop and they remain firmly in a long-term bull market. The energy sector also remains firmly in a bull market as well. But investors had better be prepared to fasten their seatbelts.
Charts created using Omega TradeStation. Chart data supplied by Dial Data.
David Chapman is a director of Bullion Management Services the manager of the Millennium BullionFund www.bmsinc.ca Note: The opinions, estimates and projections stated are those of David Chapman as of the date hereof and are subject to change without notice. David Chapman, as a registered representative of Union Securities Ltd. makes every effort to ensure that the contents have been compiled or derived from sources believed reliable and contain information and opinions, which are accurate and complete. The information in this report is drawn from sources believed to be reliable, but the accuracy or completeness of the information is not guaranteed, nor in providing it does Union Securities Ltd. assume any responsibility or liability. Estimates and projections contained herein are Unions own or obtained from our consultants. This report is not to be construed as an offer to sell or the solicitation of an offer to buy any securities and is intended for distribution only in those jurisdictions where Union Securities Ltd. is registered as an advisor or a dealer in securities. This research material is approved by Union Securities (International) Ltd. which is authorized and regulated by the Financial Services Authority for the conduct of investment business in the U.K. The investments or investment services, which are the subject of this research material are not available for private customers as defined by the Financial Services Authority. Union Securities Ltd. is a controlling shareholder of Union Securities (International) Ltd. and the latter acts as an introducing broker to the former. This report is not intended for, nor should it be distributed to, any persons residing in the USA. The inventories of Union Securities Ltd., Union Securities (International) Ltd. their affiliated companies and the holdings of their respective directors and officers and companies with which they are associated have, or may have, a position or holding in, or may affect transactions in the investments concerned, or related investments. Union Securities Ltd. is a member of the Canadian Investment Protection Fund and the Investment Dealers Association of Canada. Union Securities (International) Ltd. is authorized and regulated by the Financial Services Authority of the U.K.
-- Posted Friday, 9 June 2006 | Digg This Article

- Visit Union Securities
The opinions, estimates and projections stated are those of David Chapman as of the date hereof and are subject to change without notice. David Chapman, as a registered representative of Union Securities Ltd. makes every effort to ensure that the contents have been compiled or derived from sources believed reliable and contain information and opinions, which are accurate and complete. Neither David Chapman nor Union Securities Ltd. take responsibility for errors or omissions which may be contained therein, nor accept responsibility for losses arising from any use or reliance on this report or its contents. Neither the information nor any opinion expressed constitutes a solicitation for the sale or purchase of securities. Union Securities Ltd. may act as a financial advisor and/or underwriter for certain of the corporations mentioned and may receive remuneration from them. David Chapman and Union Securities Ltd. and its respective officers or directors may acquire from time to time the securities mentioned herein as principal or agent. Union Securities Ltd. is an independent investment dealer and is a member of the Toronto Stock Exchange, the Canadian Venture Exchange, the Investment Dealers Association and the Canadian Investor Protection Fund.
Previous Articles by David Chapman
|