-- Published: Monday, 2 February 2015 | Print | Disqus
Within the physical world, vibrations are generally not a good thing, often warning of an impending event, with earthquakes perhaps the best comparative example for our purposes. With earthquakes, before the big one arrives, most often they are preceded by many smaller vibrations, many of which are in fact undetectable to those experiencing them. Of course with earthquakes, as with other such phenomena, smaller vibrations can occur without a larger event being triggered as well, or at least it may seem that way because said larger event may not arrive for some time. Such is the case with increasing smaller earthquakes now being experienced in oil producing regions of the US, where because of the man-made destabilizing effects of increasing crude oil pumping over the years, vibrations are being experienced now, but no larger events have occurred yet.
Enter hydraulic fracking, which is new technology that this highly destabilizing to the earths strata in using pressure and chemicals to shift things around that should not be, and it appears process accelerating not only in the traditional oil patch, but also former boom states and new regions of the US, along with the rest of the world. Whats scary about all this besides environmental (pollution) concerns, is one day these days something much larger and damaging might actually occur, a catastrophic earthquake further up the Richter scale. But what if I were to tell you these are not the only vibrations associated with fracking we should be concerned with, and that these other disturbances could affect your life directly sooner rather than later whether you live in Texas, Oklahoma, or any other place targeted for these activities.
To what do I refer? Aside from the fact fracking is partially responsible for crudes current crash (think bringing on supply causing supply related wars), and that this is undoubtedly going to have a detrimental impact on oil producing states for some time, on a larger scale it should be recognized this price drop is likely going to bankrupt many marginal drillers in the industry that used high cost credit (think junk bonds, etc.) to fund operations, popping a fracking finance bubble that dwarfs the 2008 credit default swap (CDS) bubble, which could lead to something much larger if the dominos keep falling. Because like the CDS bubble, the shale drilling bubble is part and parcel of the larger mega-bond bubble (including sovereign debt), which is likely the next candidate for collapse in a long history and fully mature consortium of serial bubbles. (i.e. and serial bubbles will lead to serial busts, with black swans shifting through the various stock, bond, commodity, and currency markets, evidenced by the Swiss National Bank (SNB) last week.)
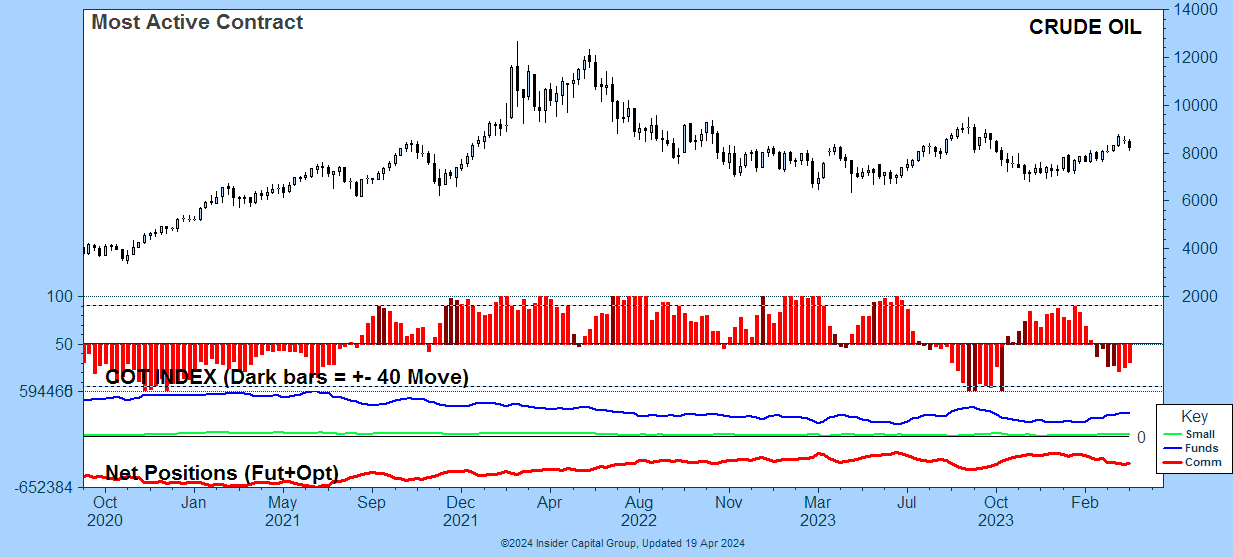
So its important to understand its not just the fracking industry thats going to feel the vibrations of these bubbles bursting, but its the fracking bubble that is getting the ball rolling in the larger sense. $180 billion dollars worth of energy sector junk bonds have been in free fall since the summer, which should eventually impact the broader universe later this year if the 2007 / 2008 sequencing of the larger CDS / housing bubble unwind is to be repeated. Whats more, it should be noted that the force of the decline in oil price (and natural gas) is showing many speculators have been caught flat-footed within this debacle, evidenced in high net long large speculator position in crude (seen here), which still needs to be worked off. And more cracks are being seen in copper (Dr. Copper), housing, bank stocks, and the broader stock market, not to mention Treasuries, with the TNX threatening to test 2012 lows at 1.5%.
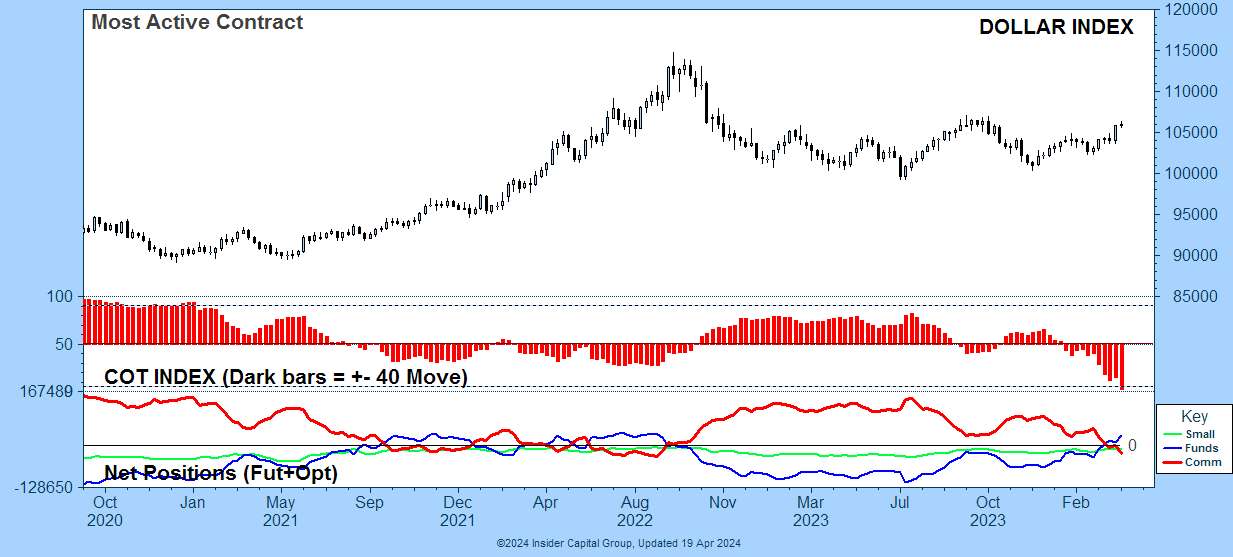
And then of course we have the bombshell announcement last week from with the SNB dropping their peg to the euro, which supercedes the vibrations created by the fracking bubble in terms of magnitude by a mile. Why? Because losses directly associated with the fracking bubble are in the billions; whereas, in the full measure of time, losses associated with the derivatives time bomb the SNB has now triggered will be in the multi-trillions (tens of trillions?), where it should be remembered the totality of these positions worldwide is in the high hundreds of trillions of notional value, if not more. So, the ripple effects throughout the markets and economy will be profound as the dominos continue to fall because the SNB protective action (reset) will likely cause others to follow, not to mention the meltdowns of those who dont, where the markets eventually catch up to them. Certainly the dollar($) fits this characterization well, with never before extremes being witnessed in the futures market. (See below.)
Moving onto the charts in order to add some dimension to all this, we have the S&P 500 (SPX) / CBOE Volatility Index (VIX) Ratio below, where it should be recognized there is no more important chart in the stock market universe right now than this one. Why? Because you cant get this information by looking an SPX chart in isolation. And you cant get this information by looking at the VIX in isolation either you need to look at the ratio of them put together to tell you what the probabilities are. So, whats it telling you? The answer is in the stochastics (and RSI which is on sinusoidal support), all of which displayed below derived from series of Fibonacci numbers that have proven reliable in measuring such things throughout the years. Going from shorter duration to longer down the plot, we can see that the SPX / VIX Ratio finished last week right on sinusoidal support, and that it needs to reverse higher immediately not to trigger what could turn out to be a profound sell signal, which of course has already happened in the second series (panel), and third with the crossover. (See Figure 1)
Figure 1

So, what does this tell you about future probabilities? Answer: This picture tells you that although anything can happen short-term, longer term, the stochastic break and crossover in second and third panels will need to be satisfied at some point (with the only real question being sooner or later), even if they are turned back up temporarily. The above is a monthly plot, so all that really matters is how it looks at months end, which puts a great deal of pressure on Draghi and the ECB not to screw things up this week a week that should be higher based on the seasonals. Does this mean what has happened so far this month doesnt matter, and that stocks could finish the month higher anyway? Thats exactly what I am saying. Again, with the February options cycle being extended, even if put / call ratios collapse post expiry, the boys in New York can fight this and give stocks a positive close for the month, which would allow the Dow to continue riding on top of the expanding triangle rail indicated below a bit longer (See Figure 2)
Figure 2

In looking at the Dow / Gold Ratio (DGR), we have a alternate scenario possibly developing in showing surprising weakness this past week. But in order to signal a bona fide an intermediate trend change, not only should it hit the 200-day MA, which it did on Friday, it should also go through it (carving out a triple top head & shoulders pattern [H&S]), which is what we will need to see before months end if one is to take a January Baromter (JB) sell signal seriously this time around. And it might just happen if you are to take the consensus of traders at their word, because most are now aware of the contrary indicator the JB has been these past three-years, which may at least partially explain the continued reductions in shorting / put buying as the month has pressed on. Therein, we already know about the big reductions in short interest discussed last week, however it also looks like open interest put / call ratios are set to decline also ahead of the ECBs QE decision this week, setting the stage for a nasty surprises in not only stocks, but currencies too. (i.e. think the dollar($) pulling a swissy.) (See Figure 3)
Figure 3

Because as warned a few weeks back, the $ is dangerously overcrowded with speculators the likes of which were gaming the Swiss franc (SF), and we all know how that turned out. The SF gained 20% in one day matched by an equal loss in their stock market. So, what could happen to the $ post the ECB meeting next week? If it starts to slide while speculators are positioned for continued gains, which is the case like never before (see attached directly above), then we could have quite the slide in the $ too. Whats more, even though the $ would be falling, stocks could slide further as well considering speculators are positioned at multi year-extremes (in some cases) gambling on continued gains in the futures (SPX, Dow, NDX), the shares, and increasingly in the options as well. (i.e. watch for post expiry key open interest put / call ratio charts to be posted as soon as they are available.) Please note that I am not predicting this, but pointing out its a possibility. (See Figure 4)
Figure 4

And I am also going to point out the possibility that if the $ snaps lower, gold will correspondingly snap higher, pushing it back into its long term growth channel denoted in the weekly plot above. How can this occur with paper market sentiment still so bullish for the metals, with open interest put / call ratios plumbing all time lows in both gold and silver ETFs? Answer: Obviously needs to happen is prices must begin trading on fundamentals, which in the case of gold (which will drag silver along), is primarily based in the publics confidence to maintain the status quo. This is why precious metals are rising right now along side the $, because people think deflation risk is present in Europe, which is why they need QE, in order to maintain the status quo (Western alliance). So, from this perspective, now that the Emperors on both sides of the pond are at risk of showing they are naked, precious metals are a win win scenario on a fundamental basis.
The only problem is fault and fraudulent Western pricing mechanisms continue to set the price as long as it appears the status quo is still in tact. And the primary signal in this regard is the Dow, which as you can see in Figure 2, is why the bureaucracys price managers will never let it get close to breaking back below 17,000 voluntarily, because this would spell doom for these assholes (they are assholes because they hasten our collective demise). So, this is why you can be confident the assholes will be out again this week propping stocks up again with the promise of the ECB maintaining the status quo with more fairy dust for their buddies, this, no matter what is happening in the real world. Again however, like what happened to the SNB, is despite what central planners think are best laid plans, sooner or later they will get caught because of their own frailties, and the jig will be up. And again, we are in fact at one of those test points again, where if the DGR were to push down through the 200-day MA, we would have a strong signal a lasting trend change (from up for stocks and down for gold) had occurred.
So no matter what happens this week, more frackers, banks, brokers, or traders go bust, the real economy continues to tank, no matter how violent the vibrations get, like gods, the powers that cannot allow an earthquake to shake the rotting core. They must keep stocks buoyant and gold suppressed or this JB might give a bona fide sell signal in two weeks, not that a rally in stocks into months end would be good sign for the entire year either. (i.e. because it might be a contrary indicator if speculators begin betting bullish in response.) As suggested in Figure 4 however, if you see gold close above the weekly 233 exponential moving average (EMA) at roughly $1330, then you would have a concrete signal the status quo is caput, and that the days of the American Empire (West), Anglo American banking cartel, and deep state are numbered. (i.e. because gold should rocket higher once firmly trading back in its long term growth channel.) We do not have that yet because the Western alliance (status quo) is still in charge. Apparently its going to take more than a reset in Switzerland to accomplish this, however this is a good start, because if it can happen there, it can happen anywhere, implying the collective and that process is accelerating.
However it should be pointed out again, that a total Western reset is not in the cards just yet, and that the status quo is still in charge, which is why the DGR is likely to bounce from here. The big question of course is how much? Does it just test the all-important 233-monthlty EMA, which it has fallen back through; or does it go back up when a brain dead public forgets about that and reasserts its party on dude posture once again? The reaction(s) to the ECB policy initiatives this week will likely tell the story regarding both the month, and (possibly) the quarter, so we will need to pay attention, because if the status quo boys are able to throw reality under the bus again in a big way, some nasty surprises for the gold bugs lay ahead, where they are now unanimously bullish once again. Therein, if gold is supposed to rally with the euro now (because the status quo says so), then if confidence is restored across the pond, would it fall with the $? The gamblers, represented by record low open interest put / call ratios are certainly positioned for such an outcome.
Because if the boys in New York are going to give it to the gold bugs again, considering the world as they would like to see it is falling apart, they will need to let precious metals rise to the point precious metals speculators will be willing to hold on what appears to be a routine pullback, and then crush them with some false news story. This is what has been happening since 2011 coupled with the observation gold bugs, as small as this population is, never did capitulate, as reflected in record low put / call ratios on the metal ETFs. This is why the correction in the shares has been so deep, and perhaps this was enough of a price FOR NOW, while the hoards that remain uninvolved in the sector pile back in. The Rydex Precious Metals Fund is telling us the shares could run further with lots of room for total assets to rise, however cumulative cash flow diverged lower on Friday with the big gains, suggestive knowledgeable traders are still hesitant to pick a fight with central bankers (think the ECB announcements this week) given they remain cornered.
With this in mind then, dont be surprised if precious metals end the week (and month) lower than Fridays close(s). Or perhaps I should say, dont be surprised if they finish higher given the vast majority of the investing world still wants to believe the status quo remains in tact. Along this line of thinking, and to conclude macro-talk for now, in looking back in history to the 70s (see here), which was the last Supercycle window, it should be pointed out that the DGR did not make much more headway in the mid-term retracement than it has these past three years, suggestive the vibrations hitting the system right now could be sufficient to reverse the cyclical correction in its descent that began in 2011. Again, we will know more by months end if the DGR cannot recover the 233-month EMA on a closing basis. If it cannot, and the SPX / VIX Ratio puts in two consecutive closes below the 21-month EMA (swing line), then we will know something smells rotten in Denmark. (i.e. and Europe if stock indexes cannot maintain recent strength in anticipation of ECB QE.)
And as forecast, the Amex Gold Bugs Index (HUI) is now at the large round number of 200, which was where we saw resistance coming in a few weeks back, so none of this should be surprising to you. Now of course, the question becomes, whats next? Again, we want to see how the various markets finish at months end for more profound signals, however one thing is for sure, any further strength in precious metals from here will tell us Western market(s) pricing market constraints (think sentiment driven market, HFTs, and derivatives) are becoming less important in terms of price discovery, if not entirely redundant. This was bound to come at some point when the daisy chain of risk in the quadrillions of notional value derivatives market(s) blew up, which was / is bound to happen given the entire system is essentially Ponzi finance. (i.e. hence the need for geometric growth rates until it explodes.) So, we might be there now, which would be signaled by continued strength in precious metals, especially if bullion and the shares were to continue rising, but derivatives products (think ETFs, etc.) not. This too is something that is bound to happen at some point as well, which will surprise the hell out of loose-minded quips who think they actually own something of value.
This is all speculation on my part of course, however not in terms of if, but when. These people, who have made an impressive observation about the present sequencing and position of the yield curves, make the case stocks can remain buoyant for a good part of 2015 possibly, given breadth would continue to deteriorate. And its hard to disagree given the evidence. That being said however, little doubt exists stocks are in the latter innings of a grand topping process that could witness new precedents, so being prudent is the word, without a doubt.
Physical bullion continues to be compelling at these prices in my opinion given what happened this week, and who knows, maybe more so in coming days if the ECB announcement triggers even more profound vibrations in the system. Therein, if the market views the EBC plan as insufficient or fragmentary, all hell could break loose on Thursday, making events last week just a warm up to a more robust earthquake.
And even if it goes back down, at least your hard earned money is anchored in eternal wealth that's bound to pay off sooner or later, with the latter becoming a higher probability by the day.
For the rest of the story, please visit our site and subscribe.
We have been providing this service for over ten years now, and our subscribers have been able to stay ahead of the curve in trading the various markets we cover, with a focus on US equities and precious metals. Coverage includes cutting edge fundamental, technical, and sentiment-based studies that have proven pivotal for our subscribers throughout the years.
So, give us a try. One will not regret it if looking for insightful big picture thinking that keeps you on the right side of the trade.
Good investing all.
Captain Hook
The above was commentary that originally appeared at Treasure Chests for the benefit of subscribers on Monday, January 16, 2015.
Treasure Chests is a market timing service specializing in value based position trading in the precious metals and equity markets, with an orientation primarily geared to identifying intermediate-term swing trading opportunities. Specific opportunities are identified utilizing a combination of fundamental, technical, and inter-market analysis. This style of investing has proven to be very successful for wealthy and sophisticated investors, as it reduces risk and enhances returns when the methodology is applied effectively. Those interested discovering more about how the strategies described above can enhance your wealth should visit our web site at http://www.treasurechests.info.
Disclaimer: The above is a matter of opinion and is not intended as investment advice. Information and analysis above are derived from sources and utilizing methods believed reliable, but we cannot accept responsibility for any trading losses you may incur as a result of this analysis. Comments within the text should not be construed as specific recommendations to buy or sell securities. Individuals should consult with their broker and personal financial advisors before engaging in any trading activities. Do your own due diligence regarding personal investment decisions.
Copyright © 2015 www.treasurechests.info . All rights reserved.
Unless otherwise indicated, all materials on these pages are copyrighted by www.treasurechests.info . No part of these pages, either text or image may be used for any purpose other than personal use. Therefore, reproduction, modification, storage in a retrieval system or retransmission, in any form or by any means, electronic, mechanical or otherwise, for reasons other than personal use, is strictly prohibited without prior written permission.
| Digg This Article
-- Published: Monday, 2 February 2015 | E-Mail | Print | Source: GoldSeek.com


